


The Stellar (XLM) price began a bounce in May, which could continue to the closest Fib resistance levels.
However, even though the bounce could continue in the short term, the long-term readings still indicate that the trend is bearish.
Stellar Price Might Have Completed Correction
The daily time frame outlook shows that the XLM price has descended since April 1, when it reached its yearly high of $0.11.
The decrease ended an upward movement that started at the beginning of the year. The upward movement resembles an A-B-C corrective structure (white).
Therefore, it is likely that the ensuing decrease is part of a new bearish trend. This is supported by the fact that the decrease looks like a five-wave downward movement (black).
Elliott Wave theory involves the analysis of recurring long-term price patterns and investor psychology to determine the direction of a trend.
During its descent, the XLM price fell below the $0.095 area, which is now likely to provide resistance.
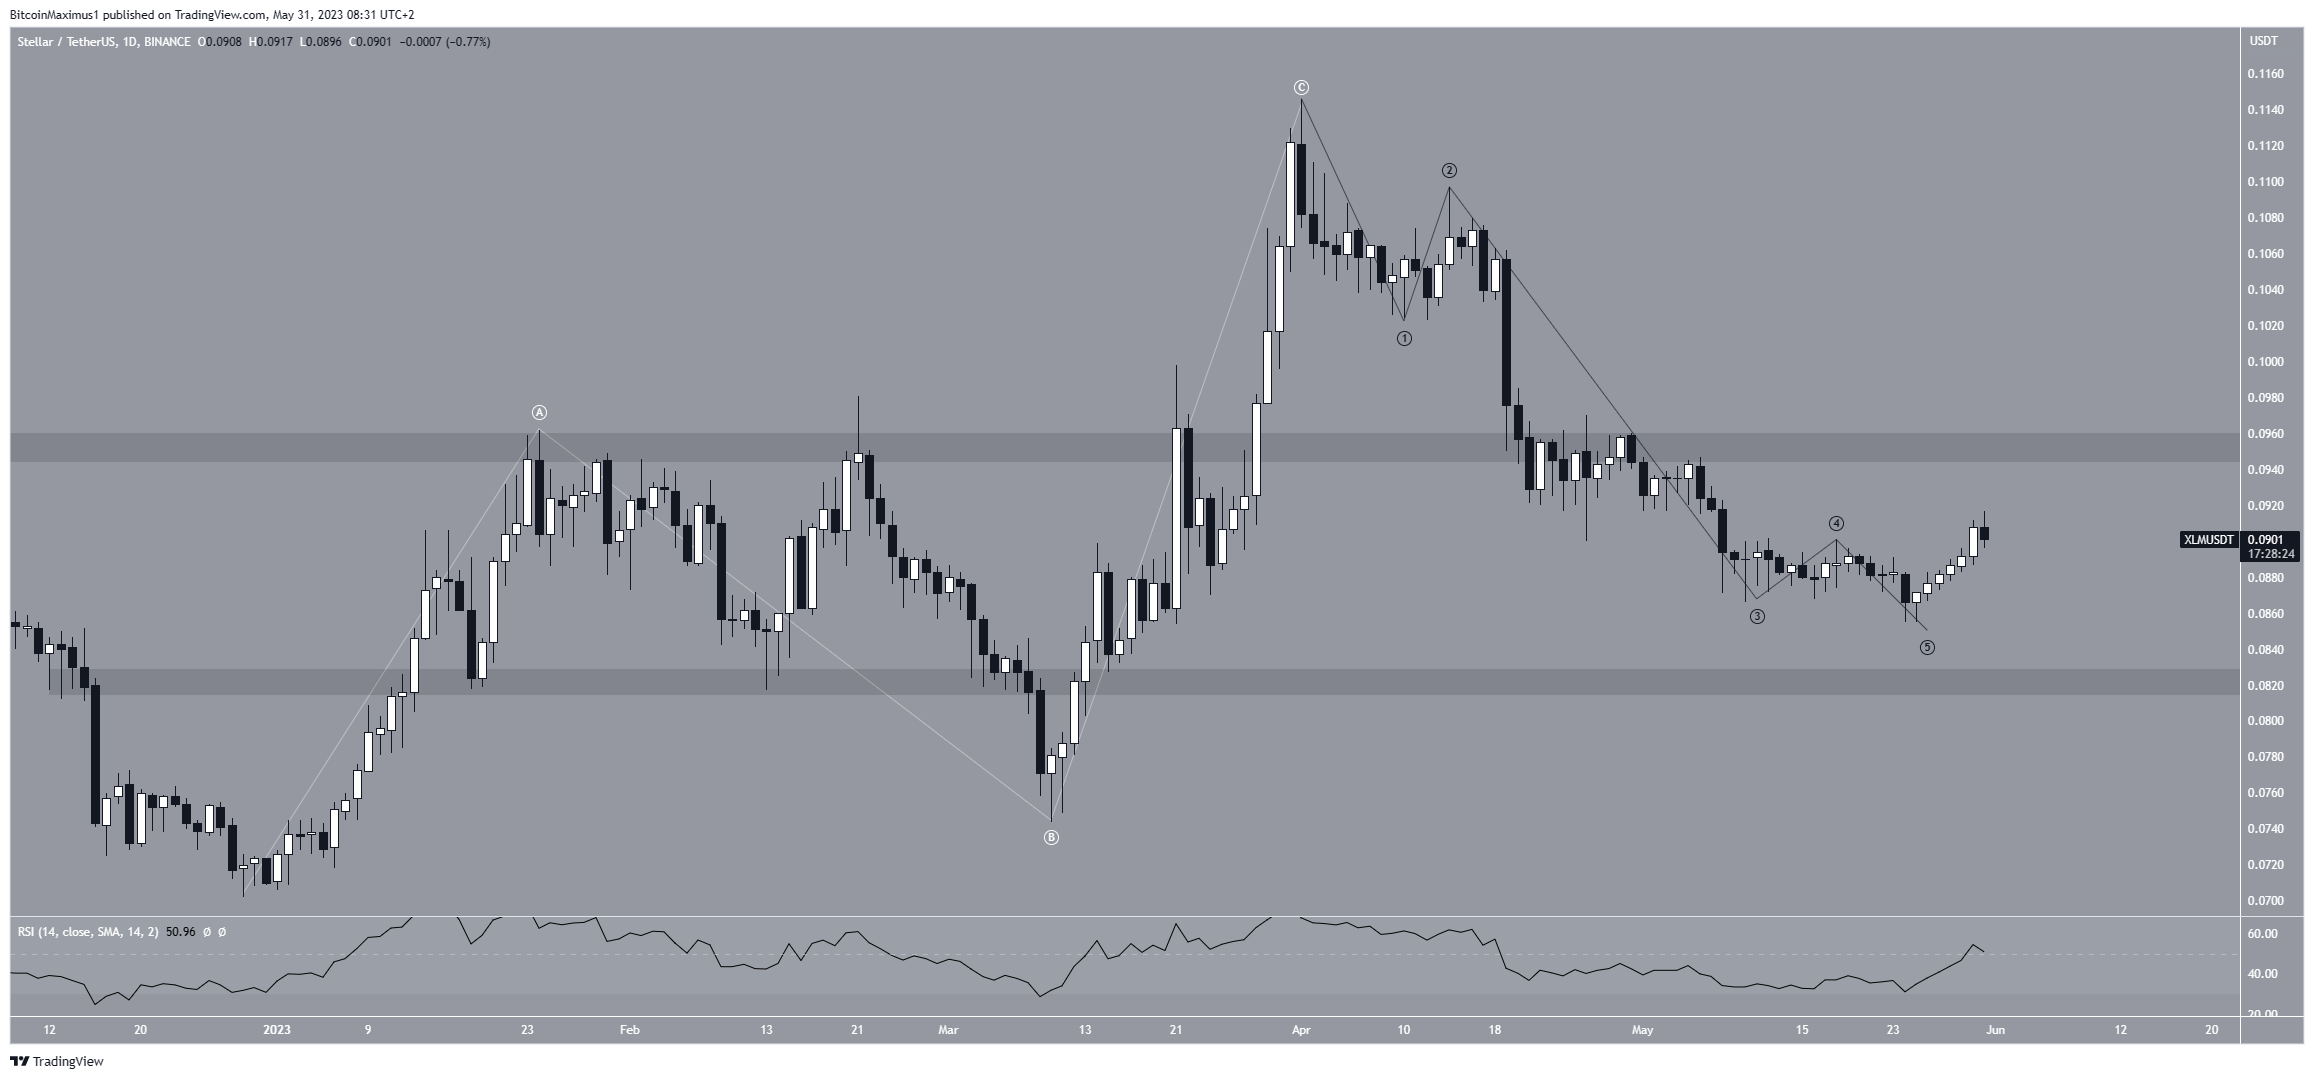
The Relative Strength Index (RSI) reading is undetermined. Market traders use the RSI as a momentum indicator to identify overbought or oversold conditions, and to decide whether to accumulate or sell an asset.
Readings above 50 and an upward trend indicate that bulls still have an advantage, whereas readings below 50 suggest the opposite. While the RSI is increasing, it was just rejected by the 50 line.
So, it does not help in determining the future trend’s direction.
XLM Price Prediction: Will Bounce Transpire?
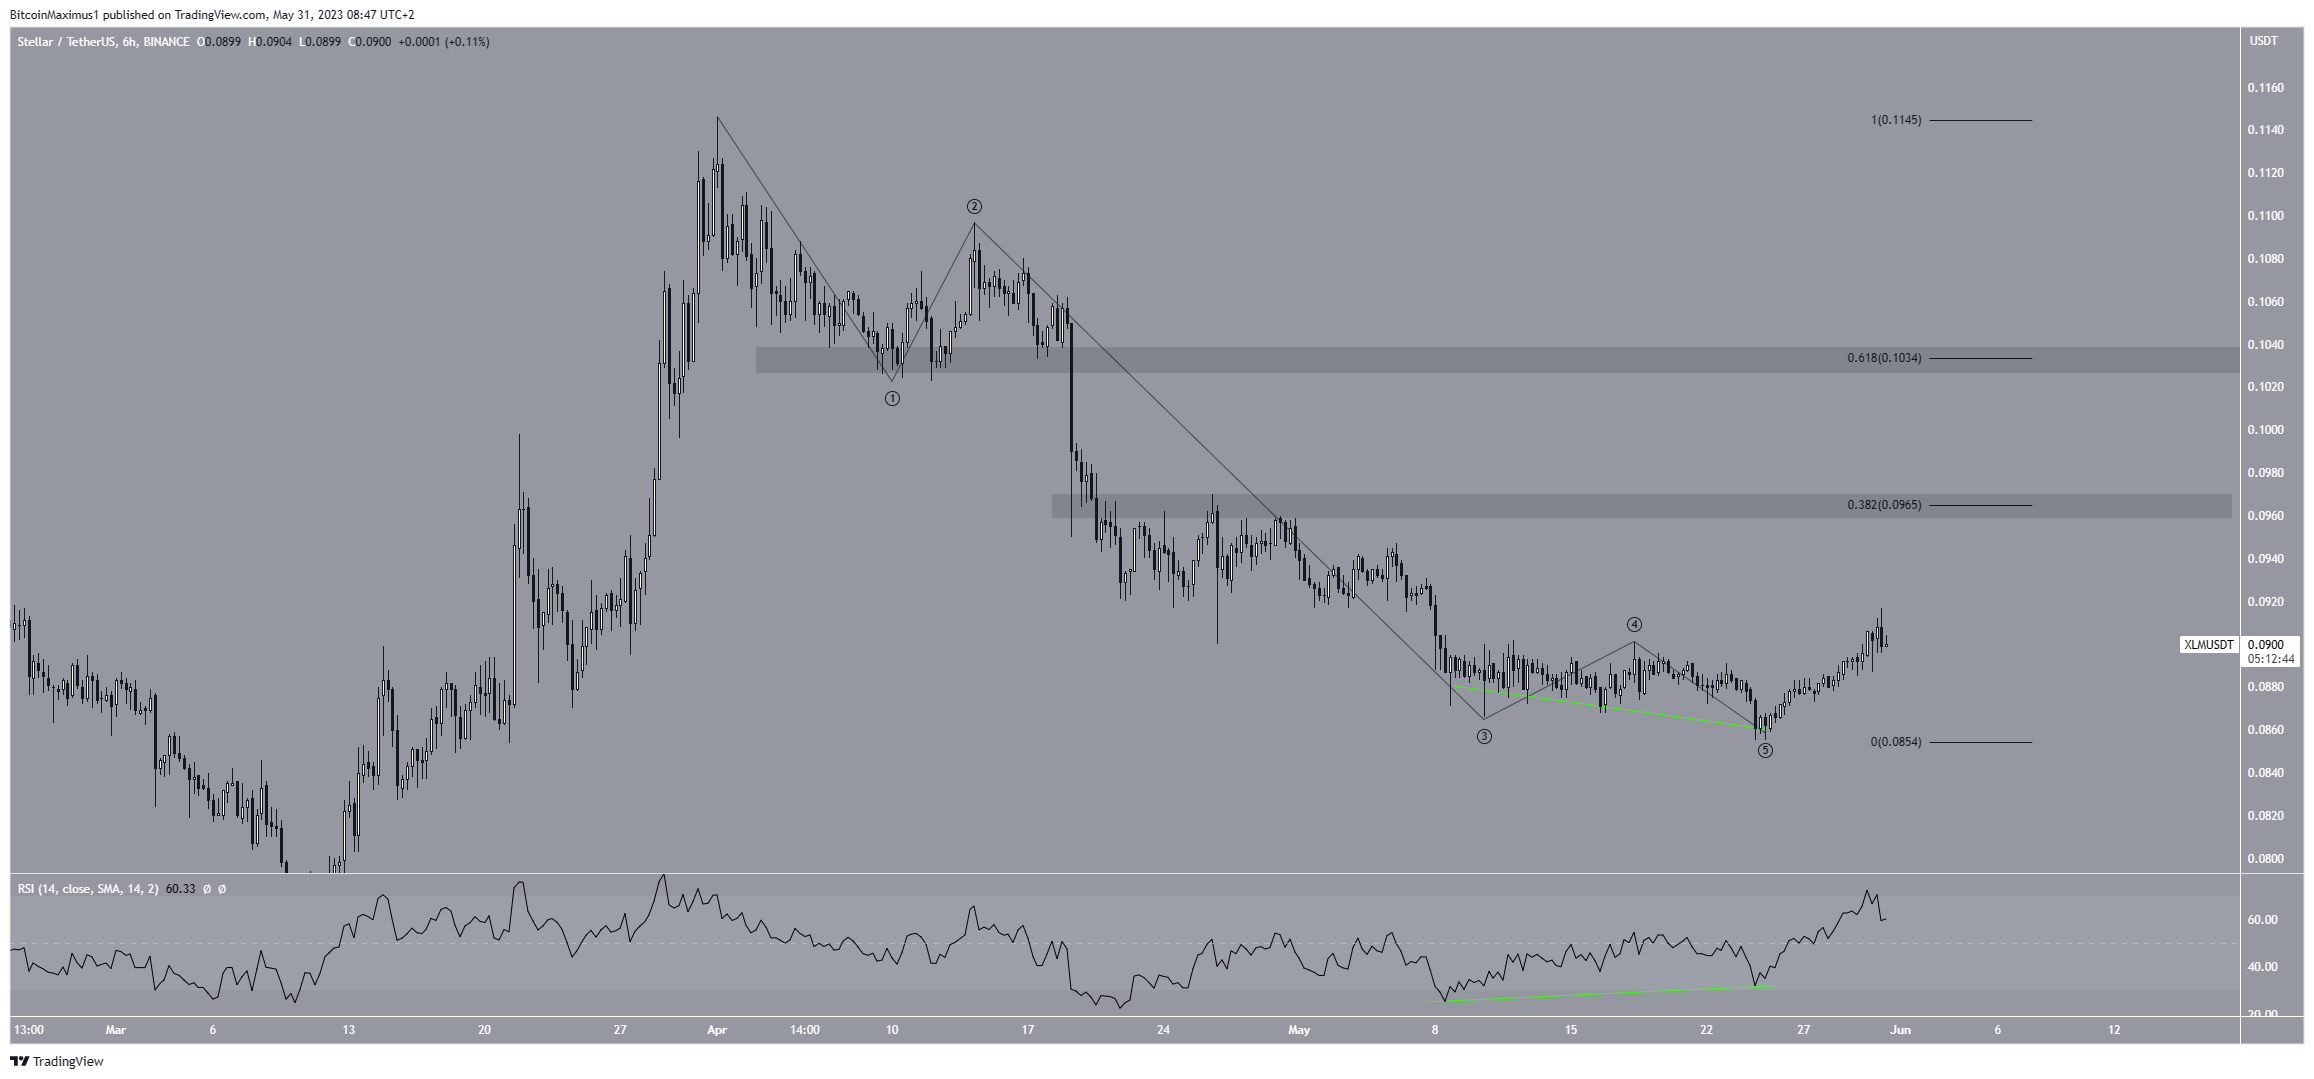
While the daily time frame technical analysis is bearish, the short-term six-hour one supports the initiation of a bounce. This is because the RSI is bullish.
Starting on May 9, the indicator generated a bullish divergence (green line). This occurs when a price decrease is not supported by a momentum decrease. Rather, the RSI creates a higher low, suggesting that the previous fall is invalid and leads to bullish reversals.
Where could Stellar (XLM) price be in the coming years?
Checkout BeInCrypto’s in depth price prediction article below:
If the ongoing increase continues, the closest resistance levels will be at $0.096 and $0.010, created by the 0.382 and 0.618 Fib retracement resistance levels, respectively (black).
The principle behind Fibonacci retracement levels suggests that after a considerable price movement in one direction. The price will retrace or go back partially to a previous price level before continuing in its original direction.
Due to the bearish readings from the daily time frame, the decrease would be expected to continue after the bounce is complete.
Despite this bullish XLM price prediction, a drop below $0.088 will mean that the trend is bearish.
In that case, the XLM price could immediately fall to the $0.080 support area.
For BeInCrypto’s latest crypto market analysis, click here.


