Breaking Worldcoin (WLD) Price Plummets Below $1: Where’s the Bottom?

2 mins
Updated by Ryan Boltman
Join our Trading Community on Telegram

In Brief

  • The Worldcoin (WLD) price bounced on September 5 and began an upward movement. However, it failed to break out and reversed trend on Sept. 7
  • The six-hour RSI and the price action both support the continuation of the decrease. The price fell to a new all-time low on Sept. 11
  • A decrease of 15% could occur before the WLD price finds support at the channel's support line. On the other hand, a reversal can lead to a 20% increase.
  • promo

The Worldcoin (WLD) price has been downward since July 25. The entire decrease has been contained inside a corrective pattern.

While the price bounced on September 5, it failed to break out of the channel’s resistance line and began another downward movement.

Worldcoin (WLD) Price Falls to All-Time Low

The WLD price has fallen since July 24. The decrease has taken the shape of a descending parallel channel. Both the resistance and support lines have been validated numerous times.

More recently, the Worldcoin price reached the channel resistance line on September 7. The price failed to break out (red icon) and began the current downward movement, which is still ongoing.

On Sept. 11, WLD broke down from the channel’s midline and fell below $1, reaching a new Worldcoin price all-time low in the process.

The six-hour RSI is also bearish, supporting the continuation of the decrease. Traders utilize the RSI as a momentum indicator to assess whether a market is overbought or oversold and to determine whether to accumulate or sell an asset.

If the RSI reading is above 50 and the trend is upward, bulls still have an advantage, but if the reading is below 50, the opposite is true. The RSI is below 50 and falling, both signs of a bearish trend.

Furthermore, the indicator broke its ascending support line (green line). This indicates that the previous bounce is complete, and a new downward movement has begun.

Worldcoin (WLD) Price Prediction
WLD/USDT Six-Hour Chart. Source: TradingView

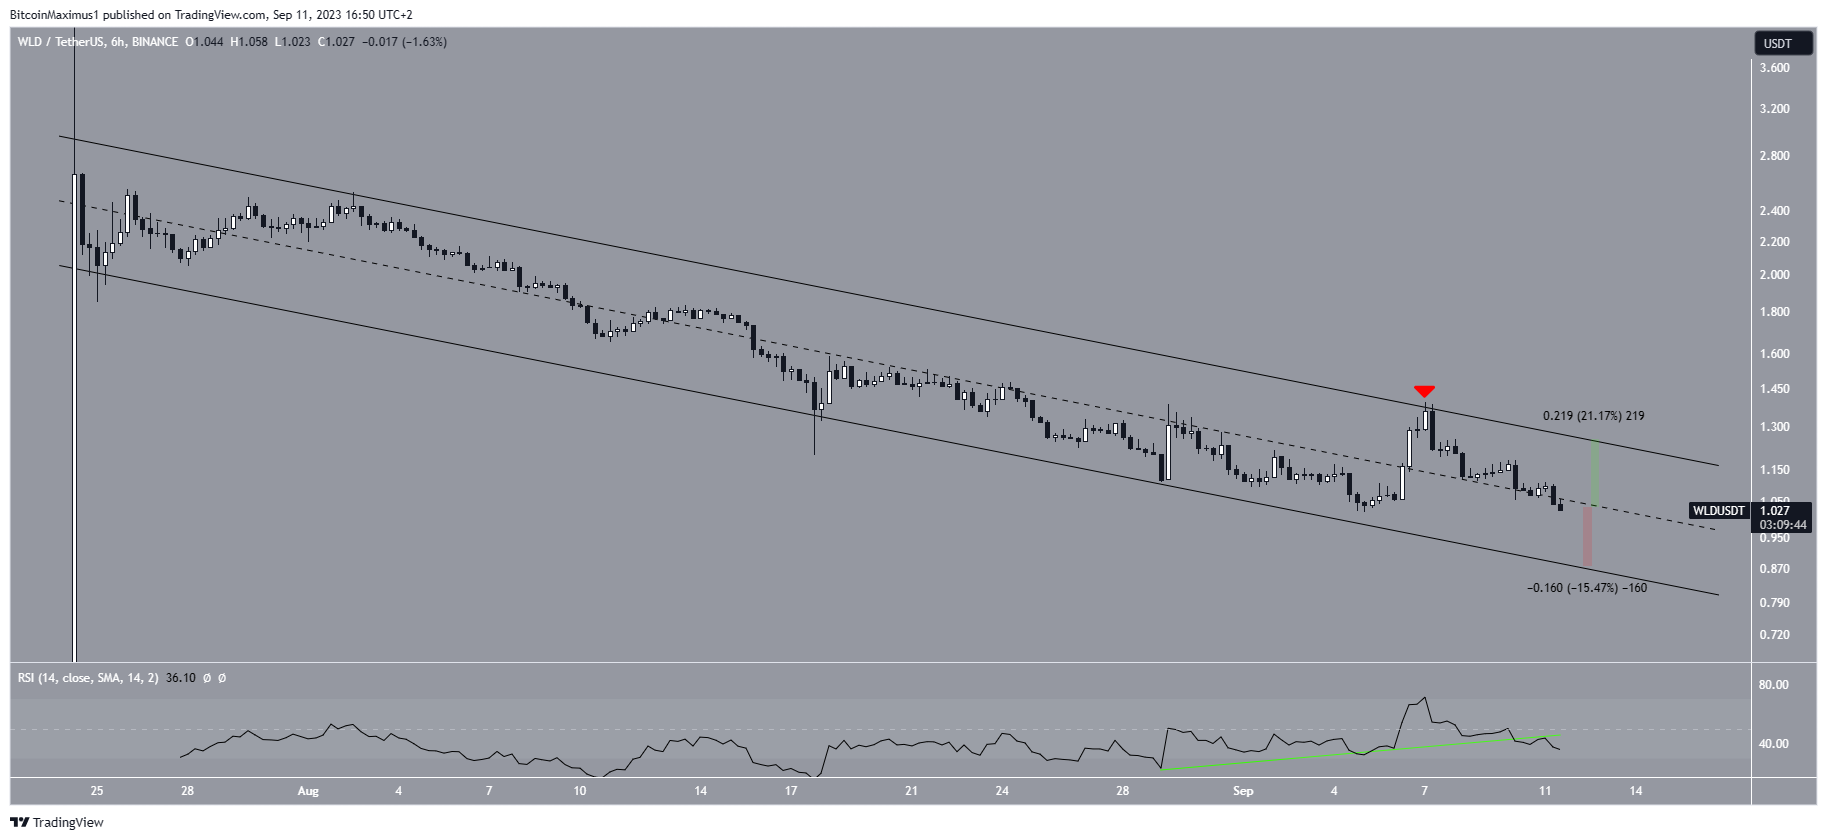
If the downward movement continues, the price can fall by another 15% and reach the channel’s support line at $0.87. However, if WLD regains its footing and reclaims the channel’s midline, it can then increase by 21% and reach its resistance line. Currently, this scenario seems unlikely.

For BeInCrypto’s latest crypto market analysis, click here.

Top crypto projects in the US | July 2024
Harambe AI Harambe AI Explore
Uphold Uphold Explore
Coinbase Coinbase Explore
Chain GPT Chain GPT Explore
Top crypto projects in the US | July 2024
Harambe AI Harambe AI Explore
Uphold Uphold Explore
Coinbase Coinbase Explore
Chain GPT Chain GPT Explore
Top crypto projects in the US | July 2024

Trusted

Disclaimer

In line with the Trust Project guidelines, this price analysis article is for informational purposes only and should not be considered financial or investment advice. BeInCrypto is committed to accurate, unbiased reporting, but market conditions are subject to change without notice. Always conduct your own research and consult with a professional before making any financial decisions. Please note that our Terms and ConditionsPrivacy Policy, and Disclaimers have been updated.

Valdrin-Tahiri.jpg
Valdrin Tahiri
Valdrin discovered cryptocurrencies while he was getting his MSc in Financial Markets from the Barcelona School of Economics. Shortly after graduating, he began writing for several different cryptocurrency related websites as a freelancer before eventually taking on the role of BeInCrypto's Senior Analyst. (I do not have a discord and will not contact you first there. Beware of scammers)
READ FULL BIO
Sponsored
Sponsored