

After several disputes, a number of developers behind Tezos (XTZ) have decided to conduct a hard fork — which will result in the creation of a new cryptocurrency called “Dune.”
The fork is scheduled to occur on September 2019.
Tezos (XTZ) is not yet listed on most major exchanges. Furthermore, the USD/XTZ pair is not available on TradingView. For this reason, we used the XTZ/BTC pair during this price analysis.
In regards to its price, XTZ had a great beginning to 2019 — reaching highs above 26,000 satoshis in Apr 2019.
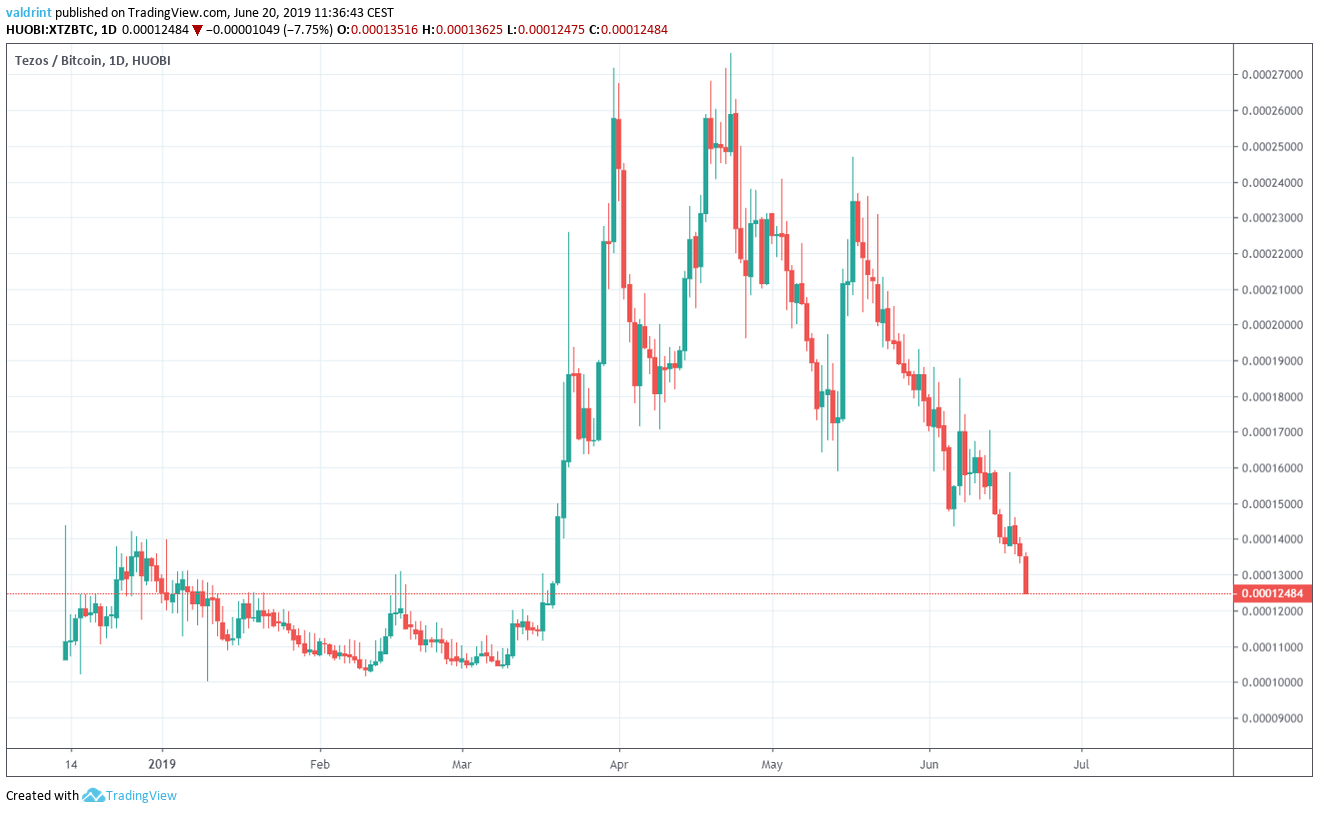 However, it has been decreasing since. The rate of decrease intensified in May/June, a movement which could have been further affected by the news of the fork.
XTZ (Tezos): Trends And Highlights For June 20
- The price reached a high on Apr 23.
- It is approaching the 0.88 fib level of the entire upward move.
- The daily moving averages have made several bearish crosses.
- The price is trading inside a short-term descending channel.
- There is a slight bullish divergence developing in the RSI and the MACD.
Tezos Price: Analysis of The Upward Move
The price of XTZ/BTC on Huobi is analyzed at daily intervals from Dec 2018 to June 2019. The 10-, 20- and 100-period Moving Averages (MA) are added to the second graph.
On Mar 9, 2019, the price made a low of 10,368 satoshis. An upward move ensued and the price reached highs of 27,600 satoshis on Apr 23. The price has been decreasing since.
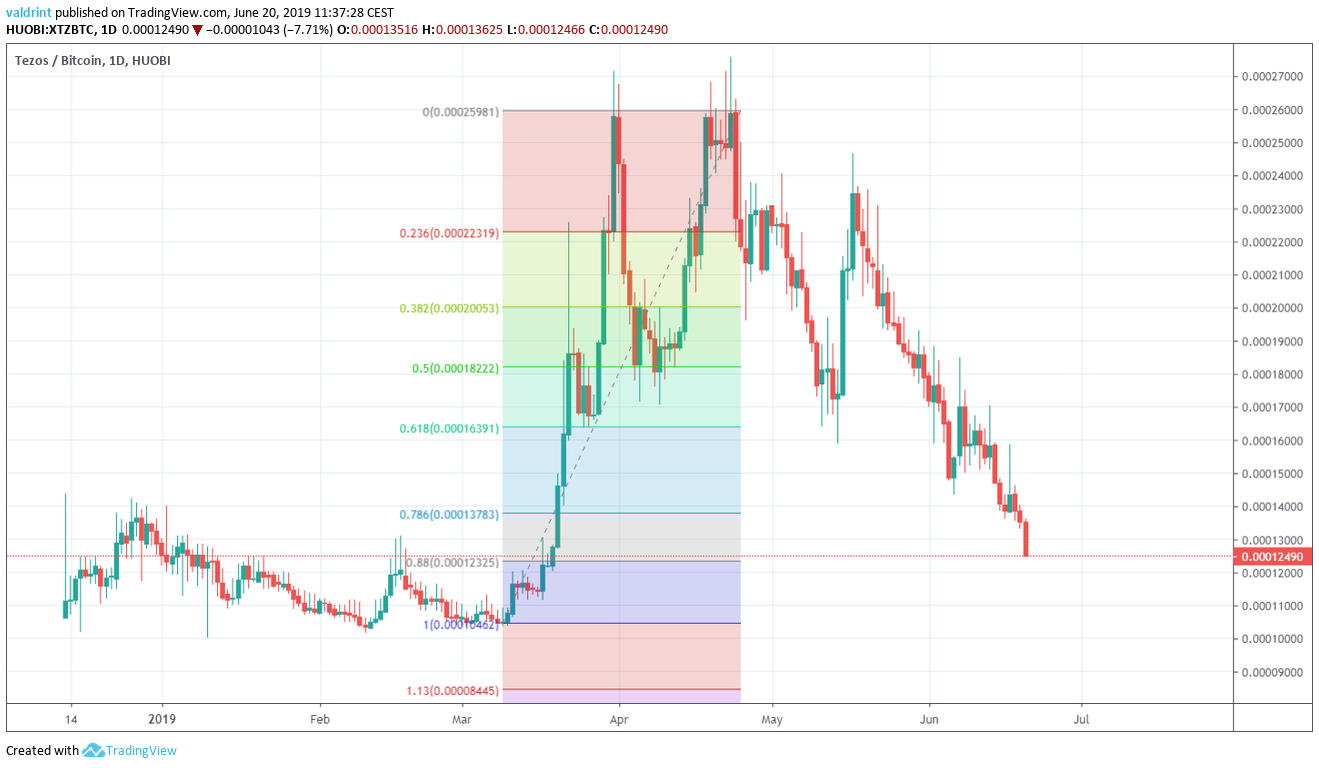 At the time of writing, the price was trading at 12490 satoshis. This coincides with the 0.88 fib level of the entire upward move. Furthermore, it coincides with the tops reached in Jan and Feb, before the beginning of the upward move.
Therefore, this can be considered a support area. However, due to the sharpness of the ongoing decrease, we do not believe it is likely to initiate a reversal. Furthermore, the moving averages give a bearish outlook.
At the time of writing, the price was trading at 12490 satoshis. This coincides with the 0.88 fib level of the entire upward move. Furthermore, it coincides with the tops reached in Jan and Feb, before the beginning of the upward move.
Therefore, this can be considered a support area. However, due to the sharpness of the ongoing decrease, we do not believe it is likely to initiate a reversal. Furthermore, the moving averages give a bearish outlook.
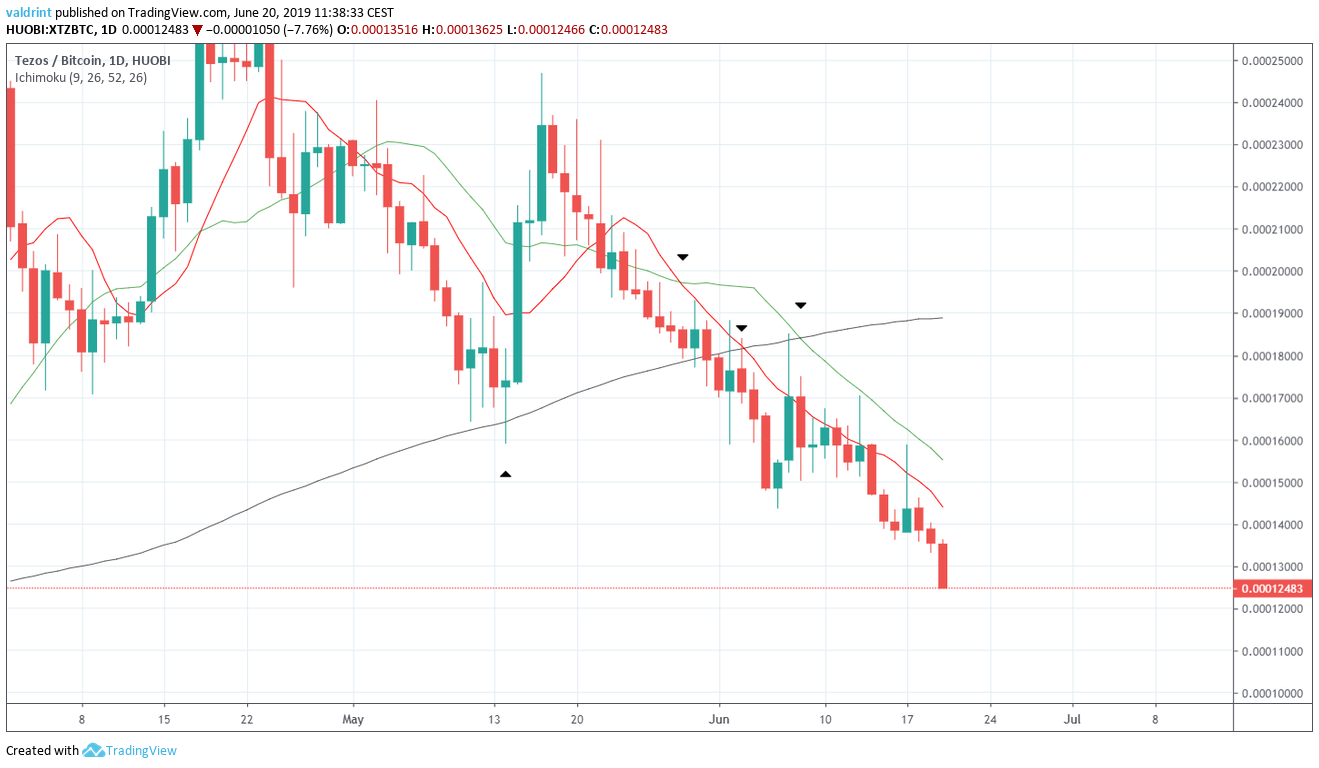 During the decrease, the price found support above the 100-day MA on May 9-13. The price immediately began an upward move, briefly trading above MAs. However, it has been on a gradual downtrend since.
Several bearish crosses have occurred. The 10- and 20-period MAs made a bearish cross on May 26, which was followed by longer-term crosses at the beginning of June. The Tezos price made three unsuccessful attempts at a breakout. However, the price was immediately pushed back, creating a candle with a long upper wick, indicating that there is selling pressure in the market.
The Tezos price is currently facing very close resistance from the 10-period MA, which is dropping sharply.
During the decrease, the price found support above the 100-day MA on May 9-13. The price immediately began an upward move, briefly trading above MAs. However, it has been on a gradual downtrend since.
Several bearish crosses have occurred. The 10- and 20-period MAs made a bearish cross on May 26, which was followed by longer-term crosses at the beginning of June. The Tezos price made three unsuccessful attempts at a breakout. However, the price was immediately pushed back, creating a candle with a long upper wick, indicating that there is selling pressure in the market.
The Tezos price is currently facing very close resistance from the 10-period MA, which is dropping sharply.
XTZ Price: Descending Channel
The price of XTZ is analyzed at 2-hour intervals from May 2019 to June 2019 alongside the RSI and the MACD.
In the previous section, we stated that the Tezos price began an upward move in the middle of May after finding support above the 100-period MA, but has been gradually decreasing since.
The decrease is following the pattern of the descending channel outlined below.
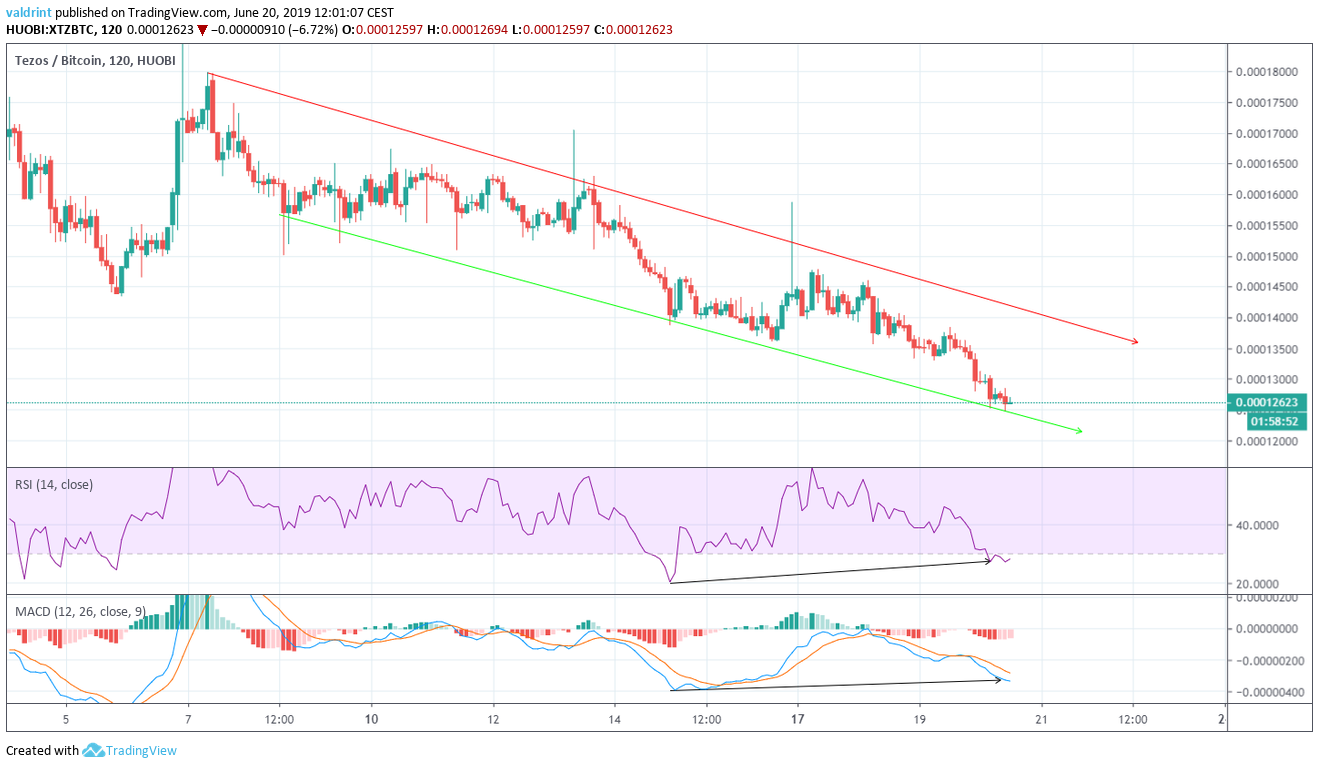 Prices near the resistance line have been characterized by long upper wicks, indicating that the price was immediately pushed back due to heavy selling pressure.
The Tezos price is currently on the support line of the channel, which has been touched five times.
There is a slight bullish divergence developing in both the RSI and the MACD since May 15. While the XTZ price has been decreasing, both indicators have generated higher values. This divergence, however, is only present in short-term time-frames and is not very significant.
Combined with the analysis of the daily moving averages, we can conclude that a short-term upward move can succeed the divergence, but it is not likely to initiate a reversal.
Prices near the resistance line have been characterized by long upper wicks, indicating that the price was immediately pushed back due to heavy selling pressure.
The Tezos price is currently on the support line of the channel, which has been touched five times.
There is a slight bullish divergence developing in both the RSI and the MACD since May 15. While the XTZ price has been decreasing, both indicators have generated higher values. This divergence, however, is only present in short-term time-frames and is not very significant.
Combined with the analysis of the daily moving averages, we can conclude that a short-term upward move can succeed the divergence, but it is not likely to initiate a reversal.
Support Areas
The price began the upward move in January with lows close to 10000 satoshis. It is currently trading at the 0.88 fib level of the entire upward move. A breakdown below it would make the beginning of the move the subsequent support area.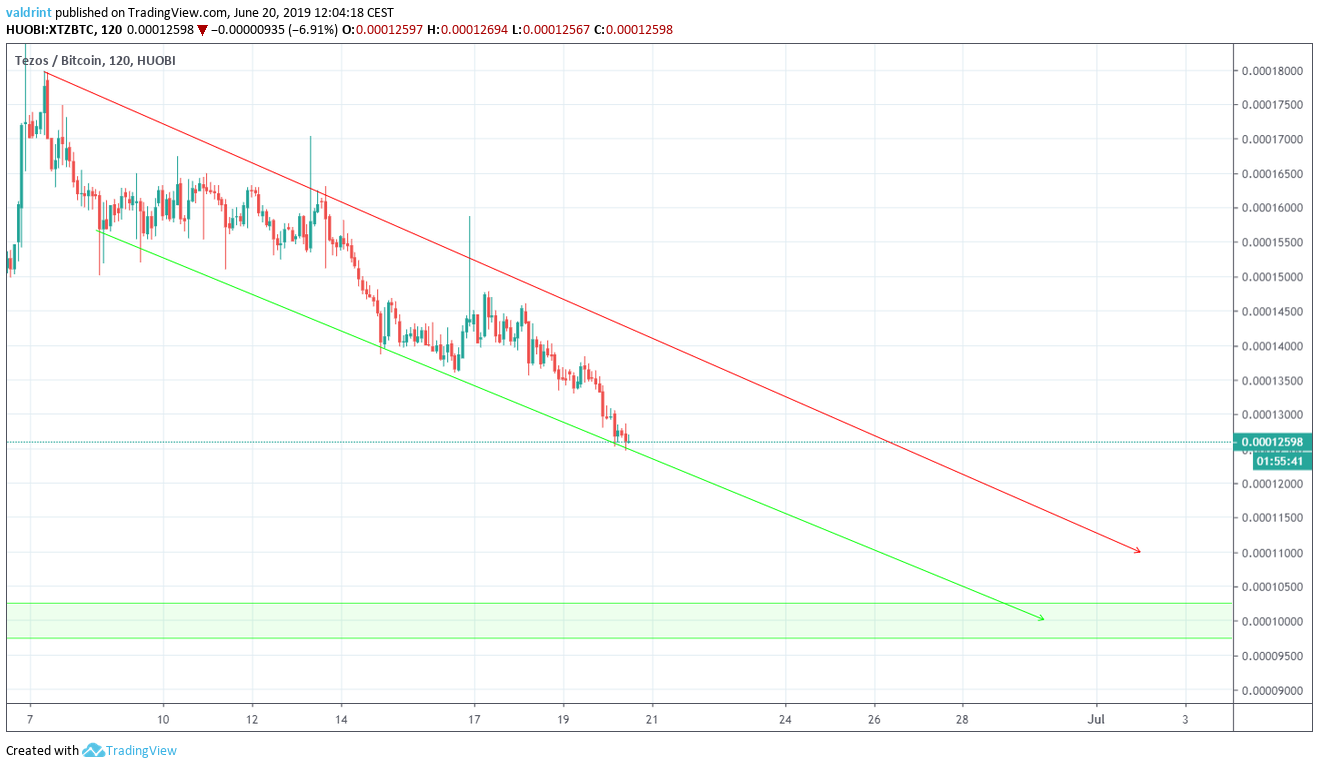 If the Tezos price continues to decrease at the rate predicted by the channel, it is likely to reach this area at the end of June/beginning of July.
What do you think will happen to the price of Tezos? Let us know in the comments below.
If the Tezos price continues to decrease at the rate predicted by the channel, it is likely to reach this area at the end of June/beginning of July.
What do you think will happen to the price of Tezos? Let us know in the comments below.
Disclaimer: This article is not trading advice and should not be construed as such. Always consult a trained financial professional before investing in cryptocurrencies, as the market is particularly volatile. All images are courtesy of TradingView.
Disclaimer
In line with the Trust Project guidelines, this price analysis article is for informational purposes only and should not be considered financial or investment advice. BeInCrypto is committed to accurate, unbiased reporting, but market conditions are subject to change without notice. Always conduct your own research and consult with a professional before making any financial decisions. Please note that our Terms and Conditions, Privacy Policy, and Disclaimers have been updated.

Valdrin Tahiri
Valdrin discovered cryptocurrencies while he was getting his MSc in Financial Markets from the Barcelona School of Economics. Shortly after graduating, he began writing for several different cryptocurrency related websites as a freelancer before eventually taking on the role of BeInCrypto's Senior Analyst.
(I do not have a discord and will not contact you first there. Beware of scammers)
READ FULL BIO
Sponsored
Sponsored