


Yesterday, we compared BTC’s price gains against the movements of Netflix(NFLX) for the year 2019. We found that while both have increased throughout the years, Bitcoin’s gains have been much greater.
In this analysis, we compare BTC against Facebook Inc. (FB) to assess who has been the best performer for the year-to-date.
In addition, we attempt to predict likely possible future price fluctuations for both.
Bitcoin’s Previous Movements
In our May 22 analysis of BTC and TSLA, we noted that BTC broke out above a horizontal resistance line in April. Furthermore, the price is possibly following a steep ascending support line, as shown by the dashed line in the graph below:
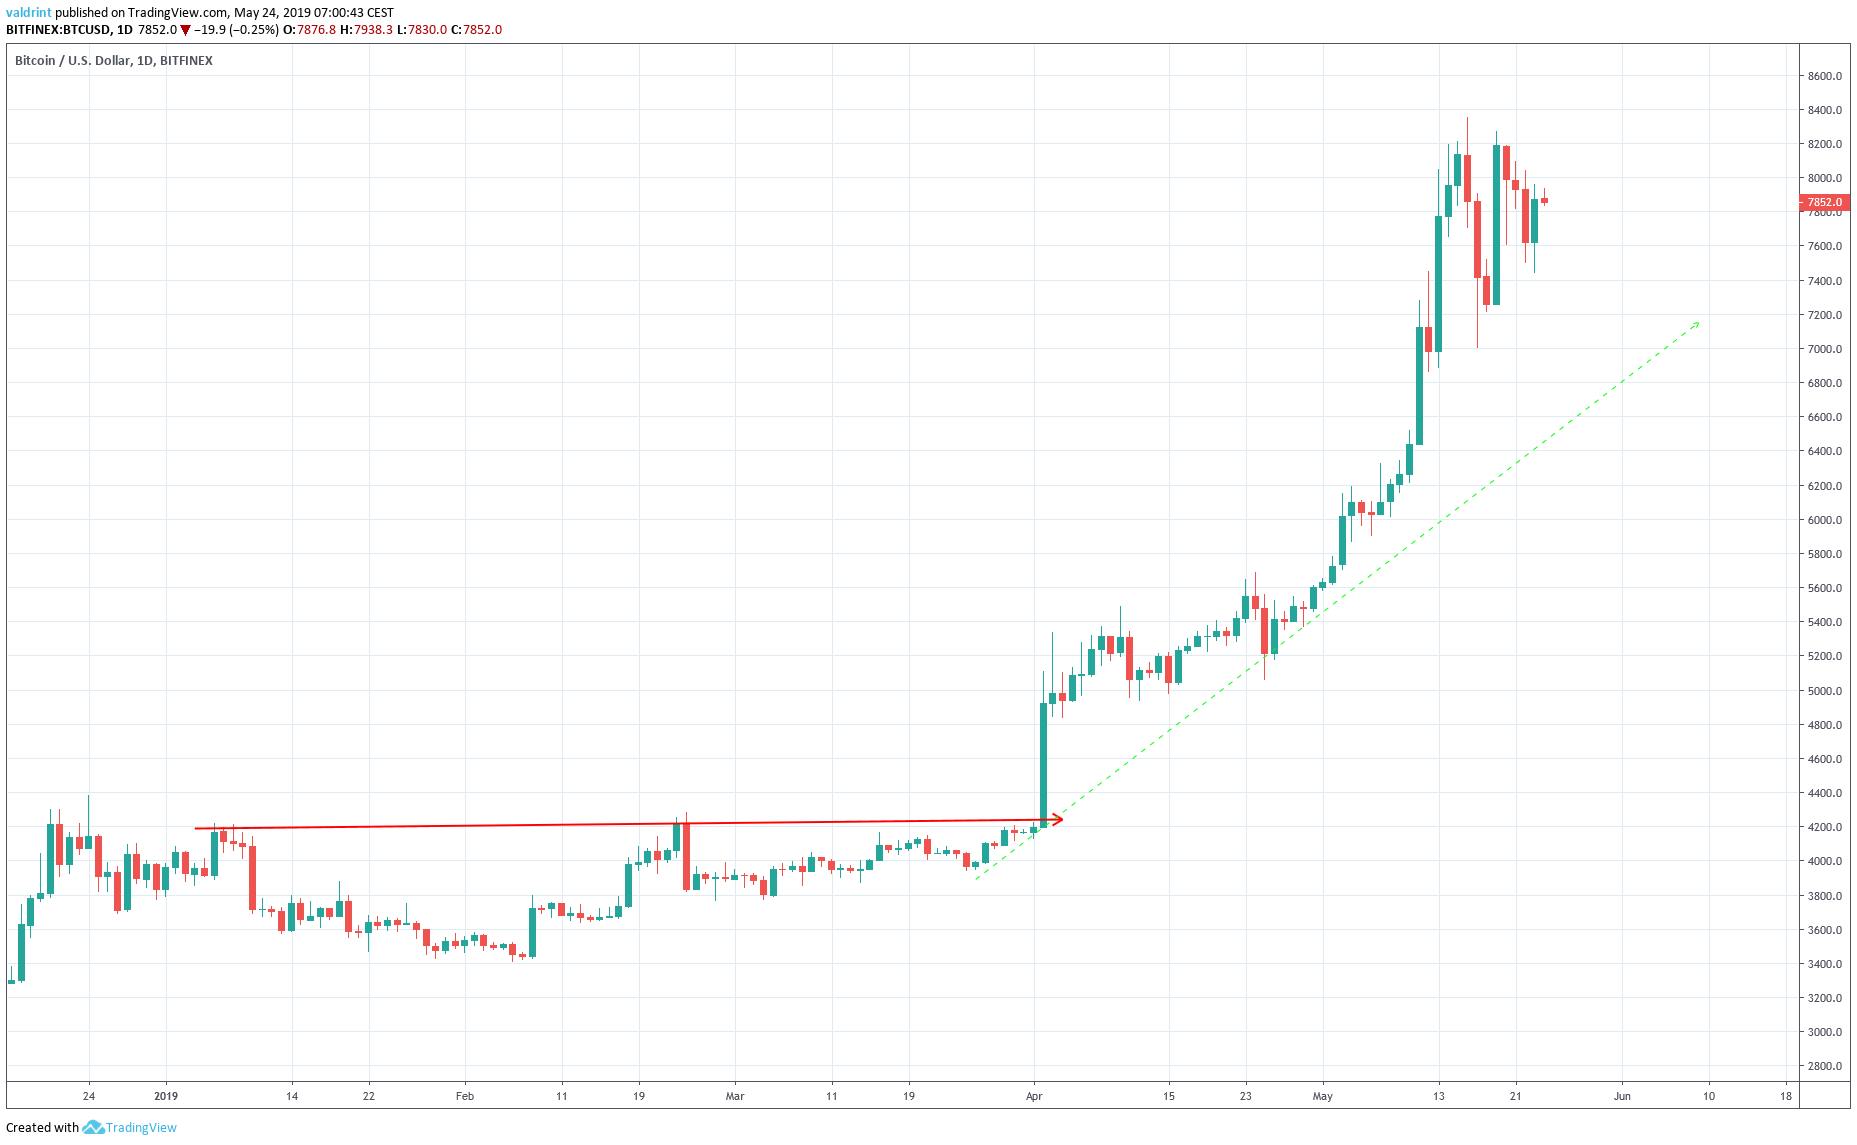
Since the breakout, the price has alternated between gradual and rapid increases. A high of $8352.3 was reached on May 16. After a drop to around $7000, prices rebounded to this level on May 20, effectively creating a double top pattern.
Since then, the price has been falling and is nearing $7800 at the time of writing.
Falling From a Double Top
If Bitcoin has reached a top, then we are currently in the midst of a reversal. In order to try and predict the strength of the former uptrend, a look at technical indicators is required.
To do this, the price of Bitcoin is analyzed alongside the RSI and the 100- and 200-day moving averages (MA):
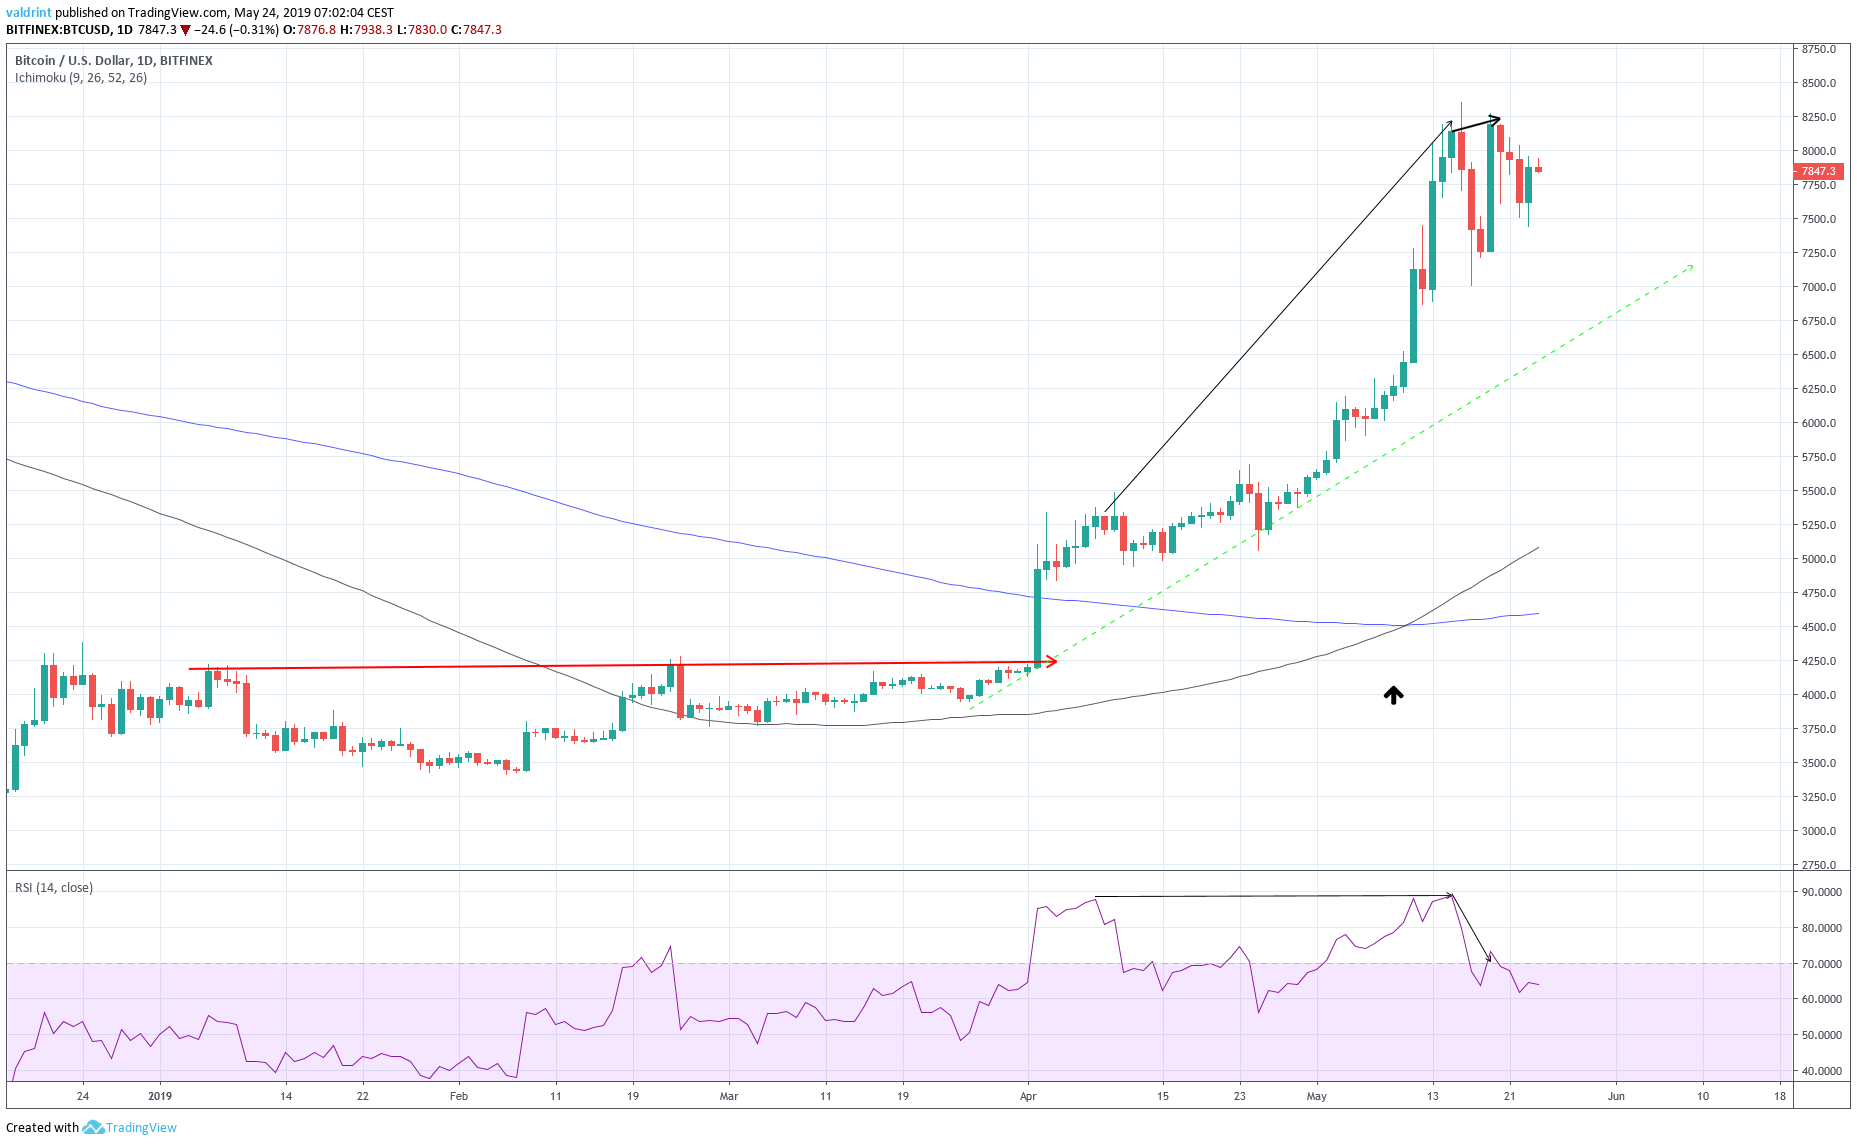
A bullish cross between the aforementioned moving averages occurred on May 10. It is worth mentioning that the last time this happened was Jul 27, 2015, initiating an uptrend that lasted for almost three years.
Price gains accelerated on May 11. However, they reached an apparent double top pattern between May 16 and 19. During this period, bearish divergence also developed in the RSI.
As a result, the price has been dropping over the last few days. Since the RSI continues to fall, we believe that the bearish trend is likely to continue for at least the short term.
Additionally, bearish divergence is also observed in the highs since the beginning of April. However, it is not present in longer-term timeframes such as the 3-day or the weekly.
In our latest price analysis of BTC, we predicted continued price drops before a rebound. Subsequently, a more significant drop is liable to bring BTC to around $6000, slightly above the moving averages.
However, prices may then move upward toward a $10,000 resistance area.
Facebook Inc.
Facebook Inc. (FB) opened on Jan 2, 2019, at $128.99. Immediately, it began an upward move. A high of $171.68 was reached at the end of the month.
The price has been gradually increasing since, trading inside the ascending channel outlined below:
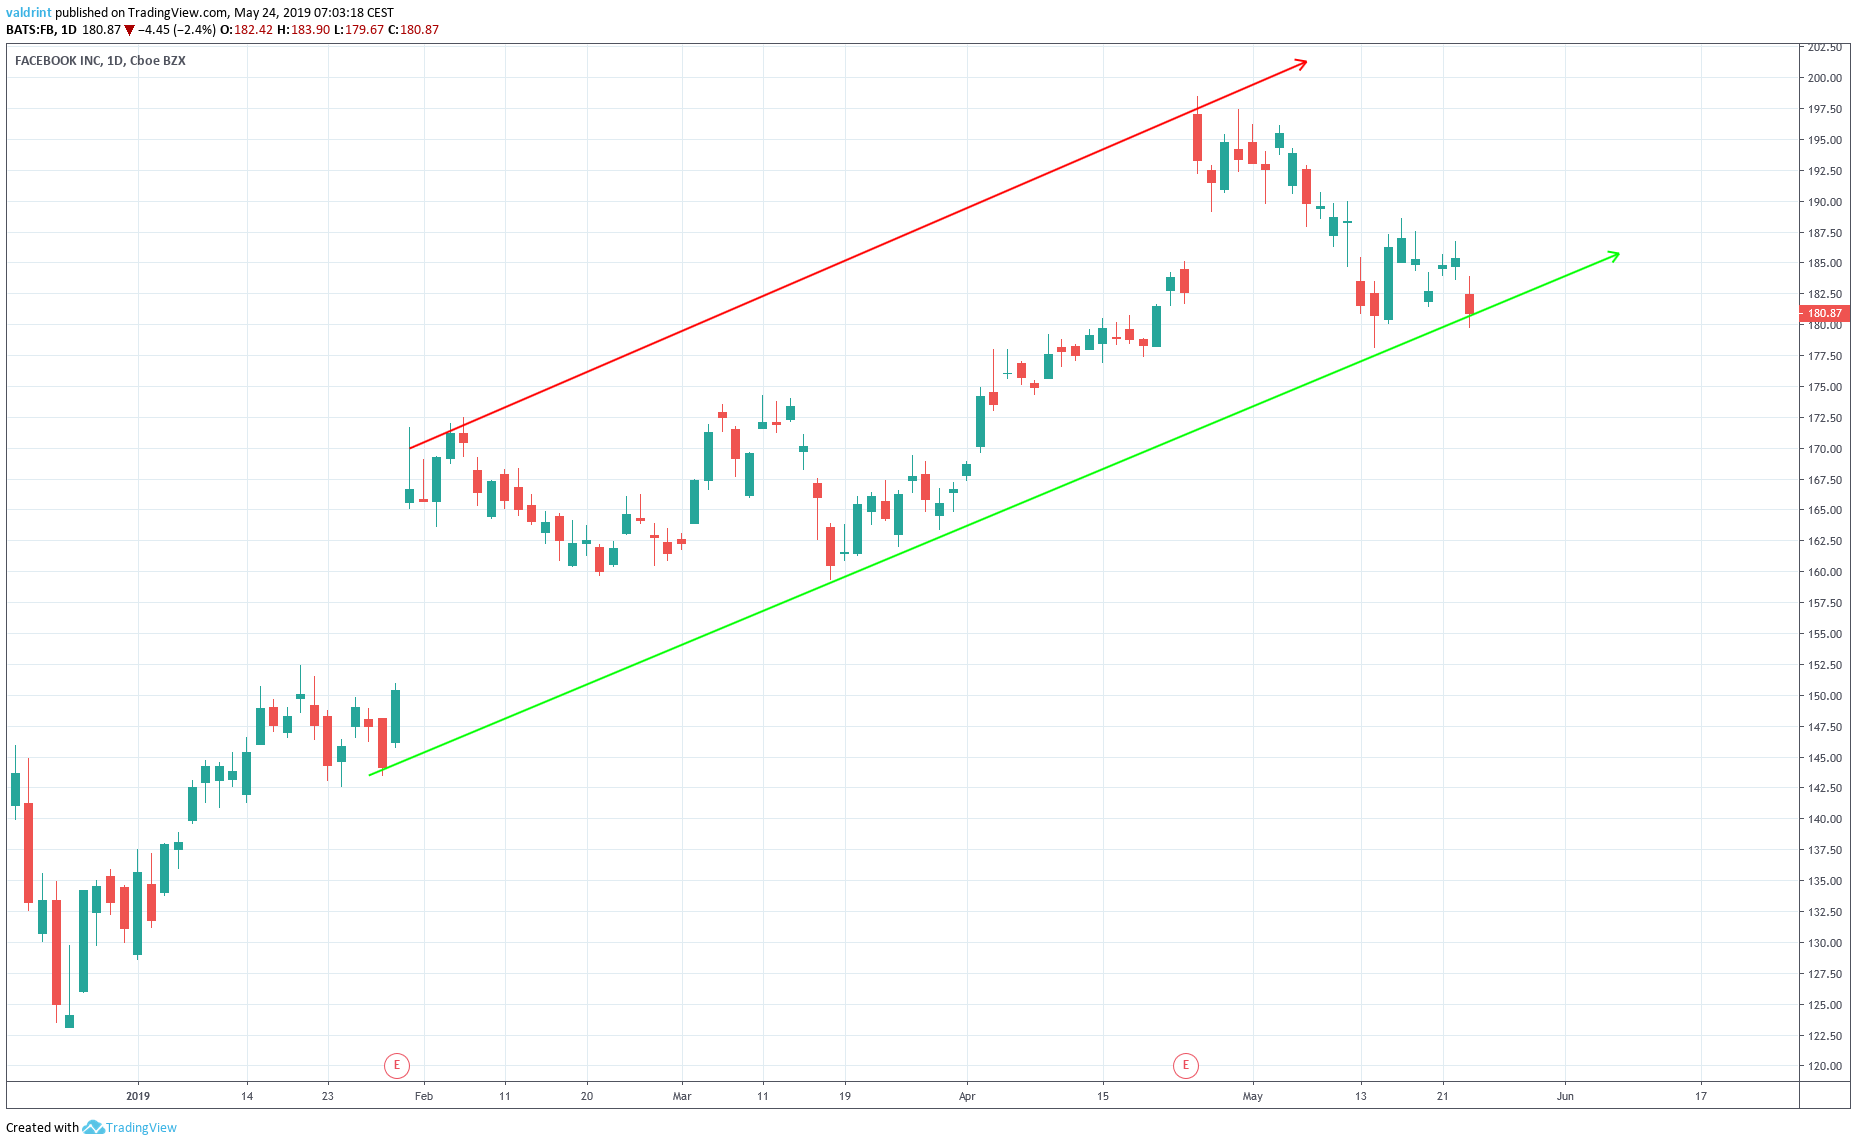
The resistance line of the channel has only been touched twice. Therefore, it is possible that a different resistane line will emerge.
In order to determine whether the price will continue to increase at the rate predicted by the channel, the price of FB is analyzed alongside the 100- and 200-period MAs below:
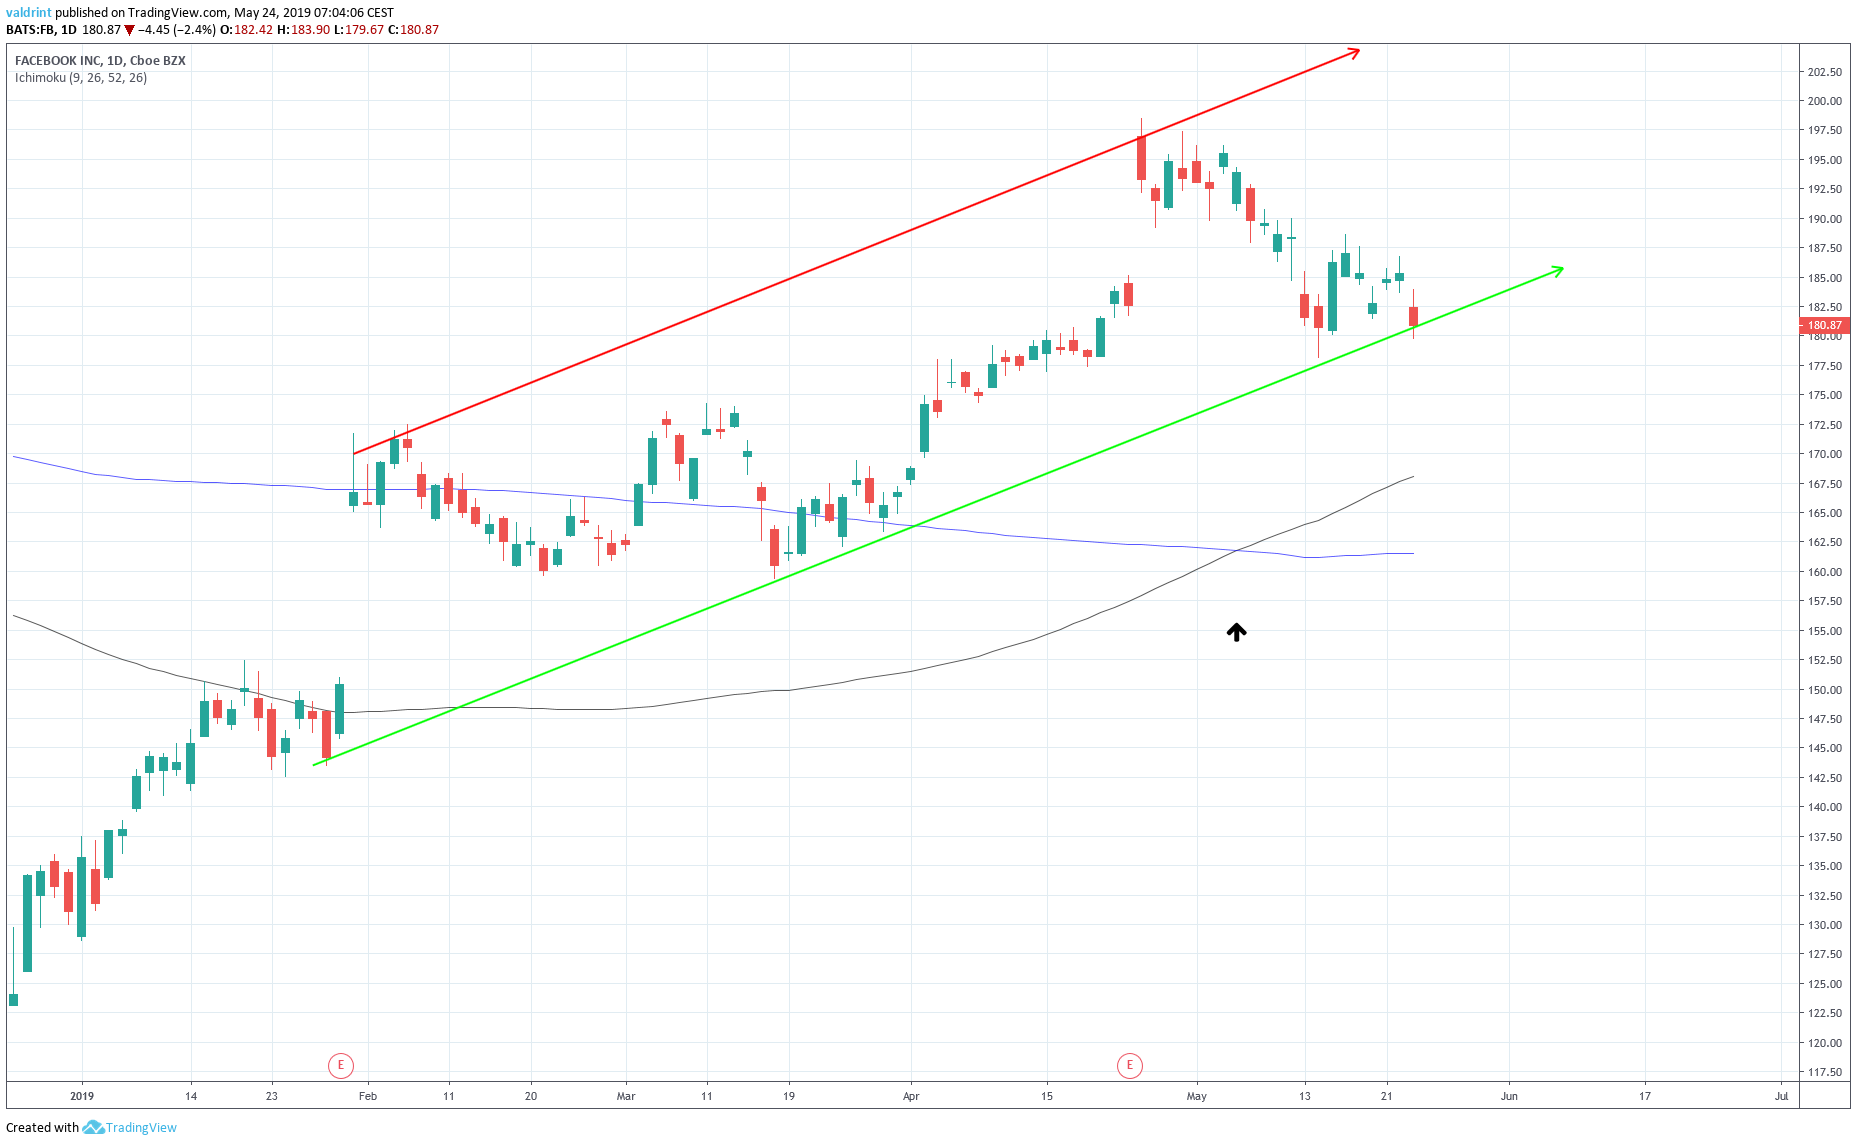
On May 6, a bullish cross between the 100-period MA and the 200-period one occurred. Unlike the case of BTC, the price did not immediately begin to rise. To the contrary, it decreased towards the support line. However, the 100-period MA is slowly increasing and will possibly offer support to the price.
So it appears as if FB has begun an uptrend. Price increases within the confines of the channel are likely to continue. A breakout is possible.
In order to determine possible levels of reversal, two resistance areas are shown in the graph below:
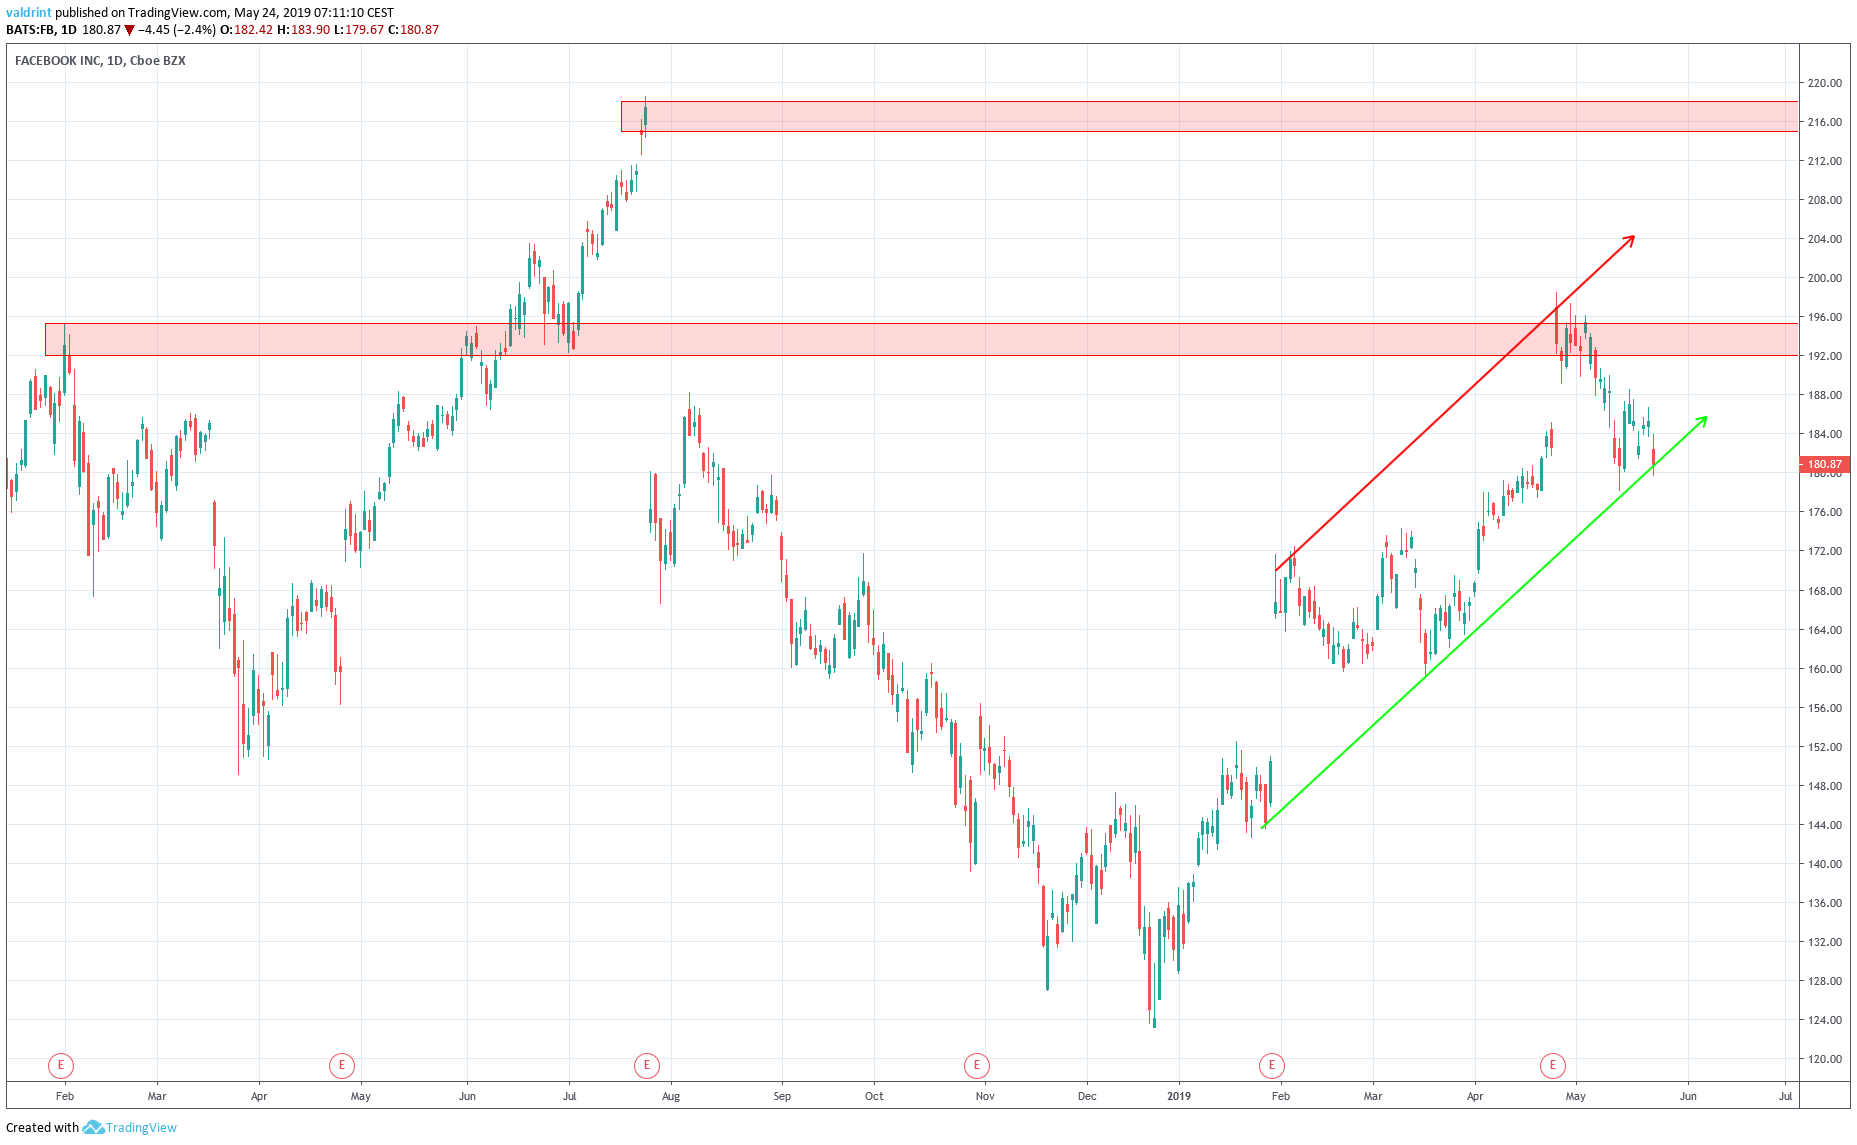
The resistance areas are found at $194 and $215 respectively. The first one provided resistance to the price during the end of Apr and beginning of May, before a reversal brought the price towards the support line. We believe that this area will be tested again in the near future.
Comparison and Summary
Now that we have analyzed both BTC and FB for the year to date, it is time to compare and summarize our findings.
In the graph below, the price fluctuations of Bitcoin and Facebook are shown for the period January 1 to May 24, 2019. Percentile gains and losses are shown on the right-hand scale.
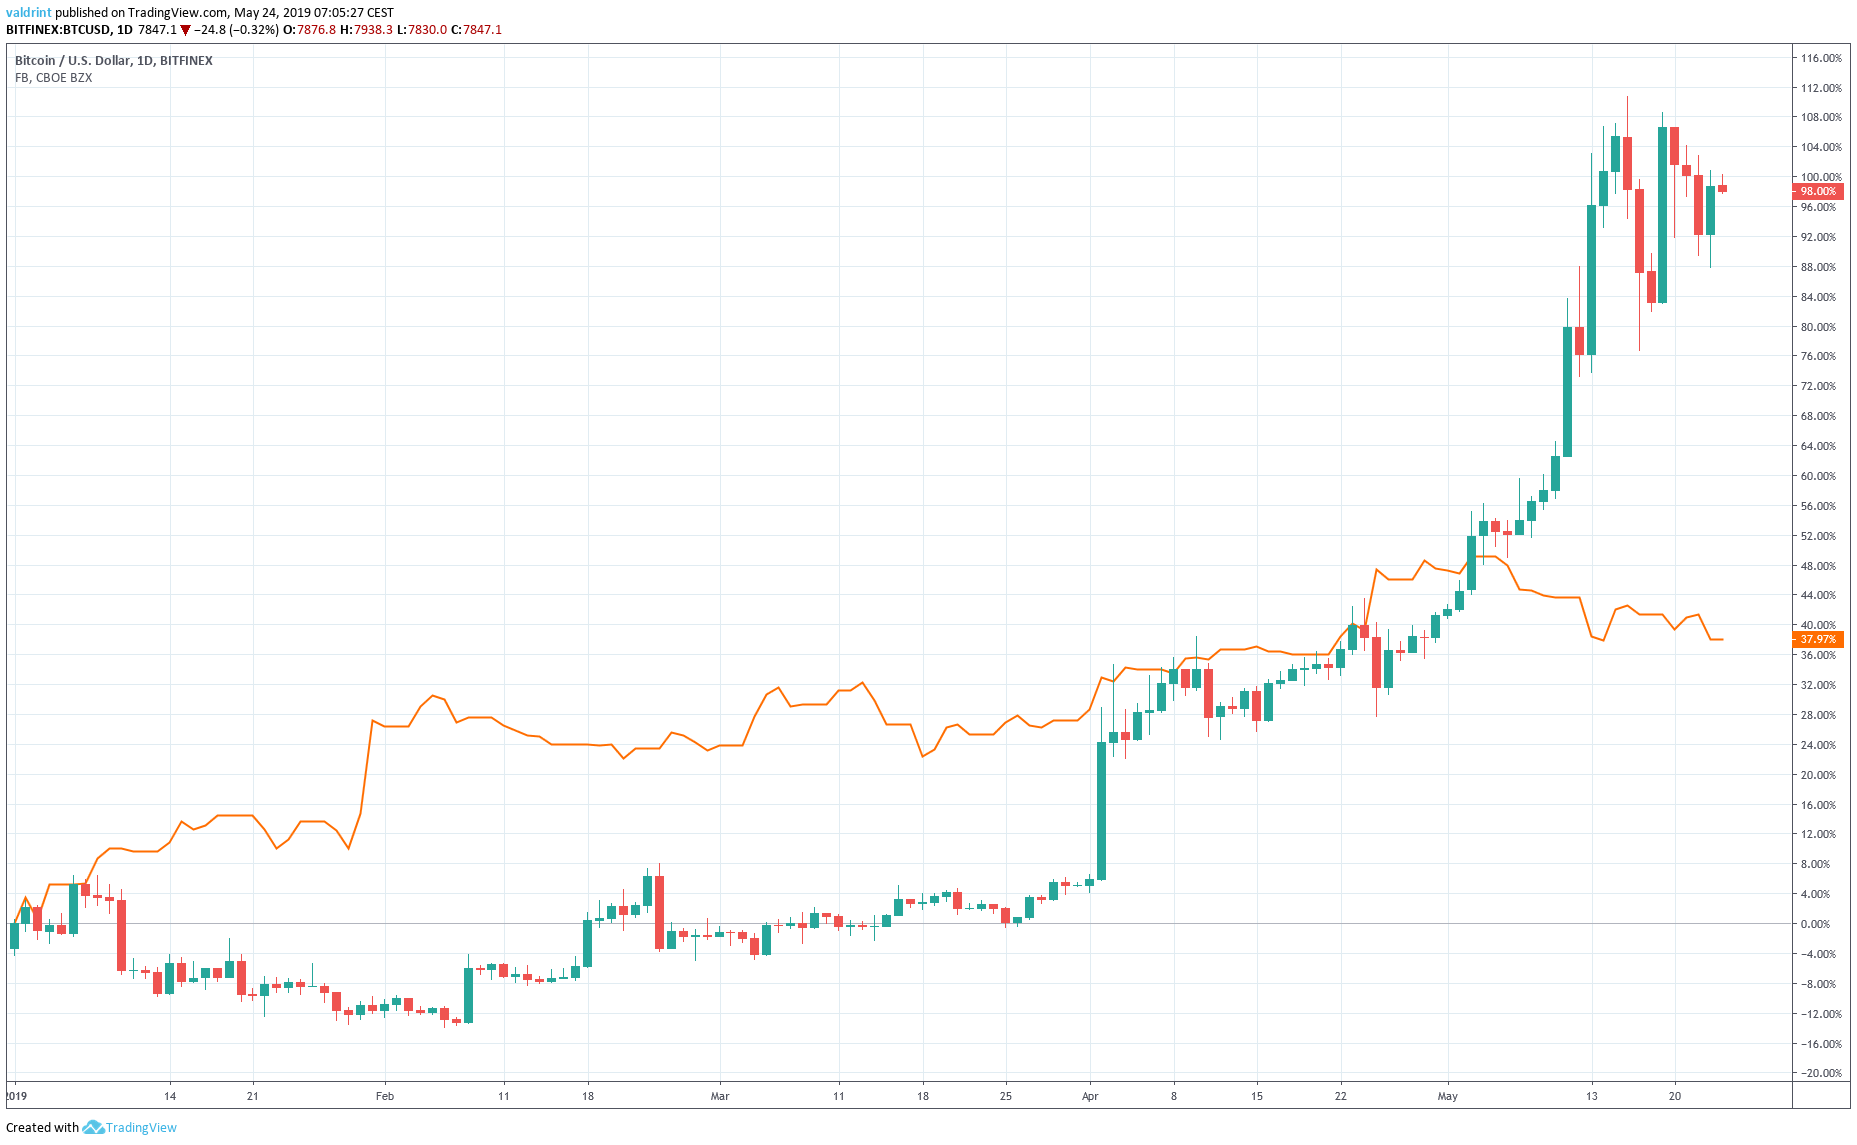
The price of FB began the year with a gradual increase. At the end of Jan, it had increased by almost 30%. However, a period of stagnation followed. This lasted until May when another upward move brought the total year-to-date growth to around 50%. Another drop followed.
At the time of writing FB had increased by nearly 38% since Jan 2.
On the contrary, the price of BTC began the year slowly. After a period of gradual decrease, 10% of its yearly opening value was lost by February 10th. However, a period of rapid increase followed throughout February. Despite a drop toward the end of the month, BTC continued to increase in March.
After gradual growth in March, prices rapidly spiked at the beginning of April. After a period of slight consolidation, the same occurred in the beginning of May. At the time of writing on May 24, BTC had increased by 98.0% since the beginning of the year.
Our analysis of technical indicators supports price increases for both BTC and FB throughout the year. However, decreases are expected for Bitcoin in the near future.
Do you think that Facebook will reach the resistance at $215 before the end of 2019? Can we expect new highs for BTC before year’s end? Let us know your thoughts in the comments below!
Disclaimer: This article is not trading advice and should not be construed as such. Always consult a trained financial professional before investing in cryptocurrencies, as the market is particularly volatile.


