


2019 has been a good year for Bitcoin. It has more than doubled in price and appears poised for greater gains. Shares of Tesla stock (TSLA) may drop to as low as $10 according to recent predictions from Morgan Stanley.
In this technical analysis, we examine the price of Bitcoin (BTC) against that of Tesla (TSLA) since the beginning of 2019. Furthermore, we examine several technical indicators to better predict where prices may head during the rest of the year.
Is Morgan Stanley right? Will TSLA crash to $10?
What Has Bitcoin Been Up To?
The price of Bitcoin opened on Jan 1 at $3832.6. It traded between $3250 and $4250 until April when a rapid upward move began. This caused the price of BTC to breakout from its resistance line.
Since that time, Bitcoin has been steadily increasing. Price movements are shown in the graph below:
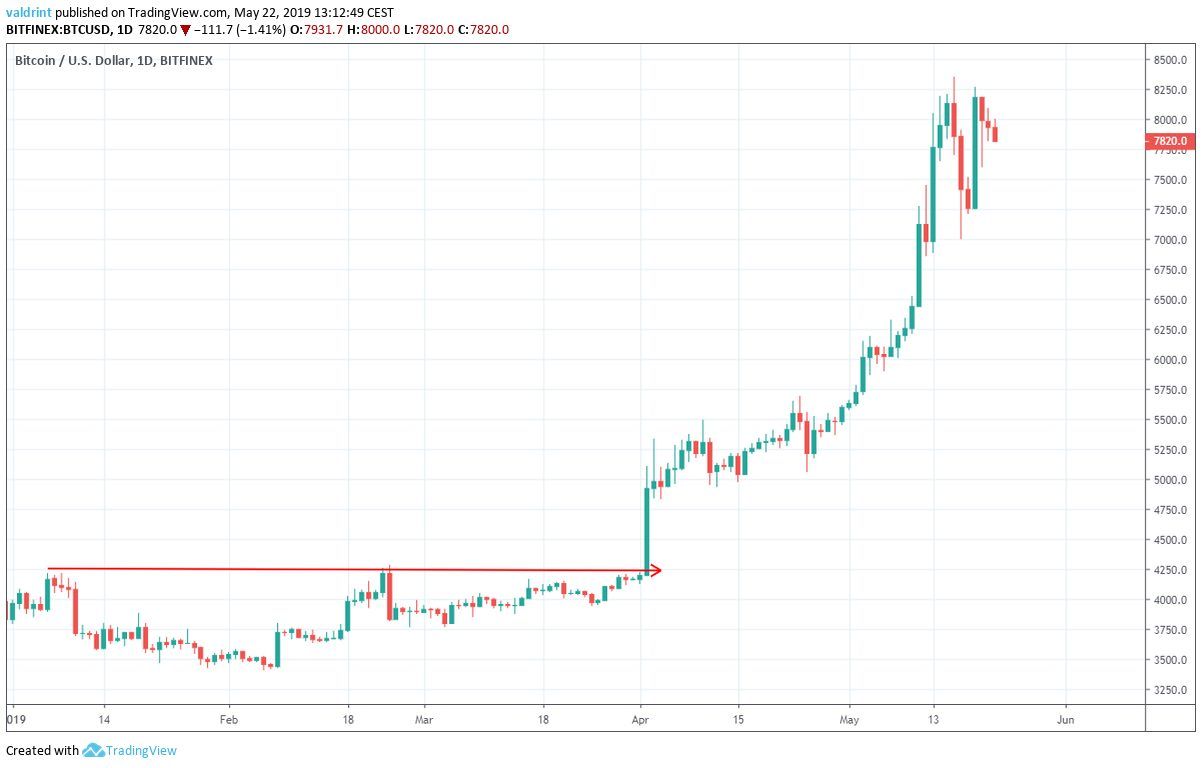
Since breaking out above the resistance line, BTC has been on a tear, increasing at a parabolic rate. It made a high of $8352.3 on May 16.
Bitcoin’s Double Top
These gains, however, will not last forever. To try and predict the strength of this uptrend, a look at technical indicators is required.
The price of Bitcoin is analyzed alongside the RSI and the 100- and 200-day moving averages (MA). In addition, we have noted a possible double top pattern which has recently emerged.
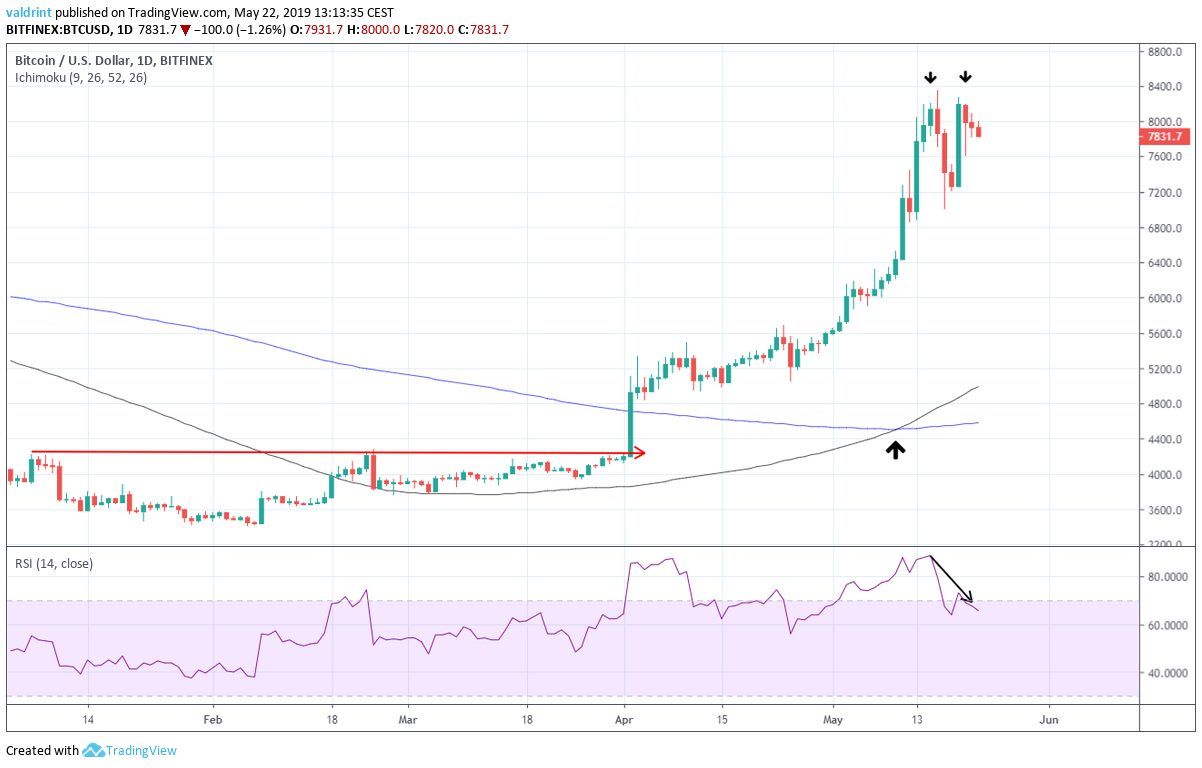
On May 10, the 100-day MA crossed above the 200-day one generating a bullish cross. Shortly thereafter, the current uptrend intensified. This was to be expected.
However, the bullish cross emerged 12 days ago and the gains may be over. This is indicated by the double top pattern which emerged between May 16 and 19.
After peaking on May 16, the price of BTC dropped. It rebounded soon thereafter and reached similar levels on May 19.

Because this is a bearish reversal pattern, a drop appears likely. Furthermore, there is bearish divergence in the RSI which increases the change of near-term price losses.
These indicators do not, however, tell us how far Bitcoin may drop. It may reach lower levels soon, but these may be short-term. A reversal could initiate a rebound that brings Bitcoin to higher levels after a bottom is reached.
Thus, despite the possibility of losses, new highs may still be had for Bitcoin before the end of the year.
Time for Tesla
The markets were closed on Jan 1, which means that Tesla (TSLA) opened on Jan 2. The price of TSLA when the markets opened in 2019 was $306.10.
A high of $351.50 was reached on Jan 17. At that time, a descending resistance line formed. Before the end of the month, a descending support line formed as well. Together, they generated a descending channel:
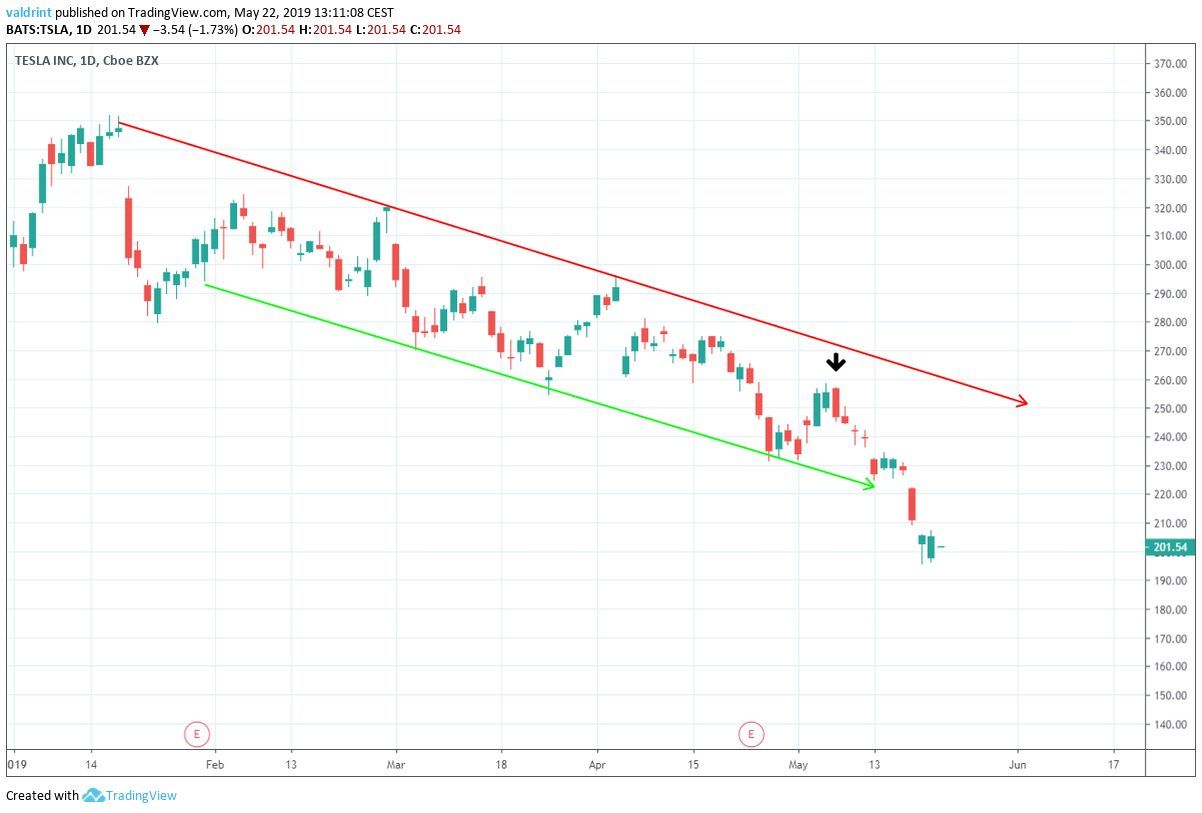
Initially, the price traded inside the confines of the channel, bouncing from resistance to support. However, after reaching the support line on May 1, TSLA was unable to bounce back to the resistance line.
After a slight recovery, the price fell and broke down from the support line. While this may have been a false breakdown, it might also indicate that a new downtrend has begun.
In order to determine future movement, the price of TSLA is analyzed alongside the RSI and the 100- and 200-period MAs below:
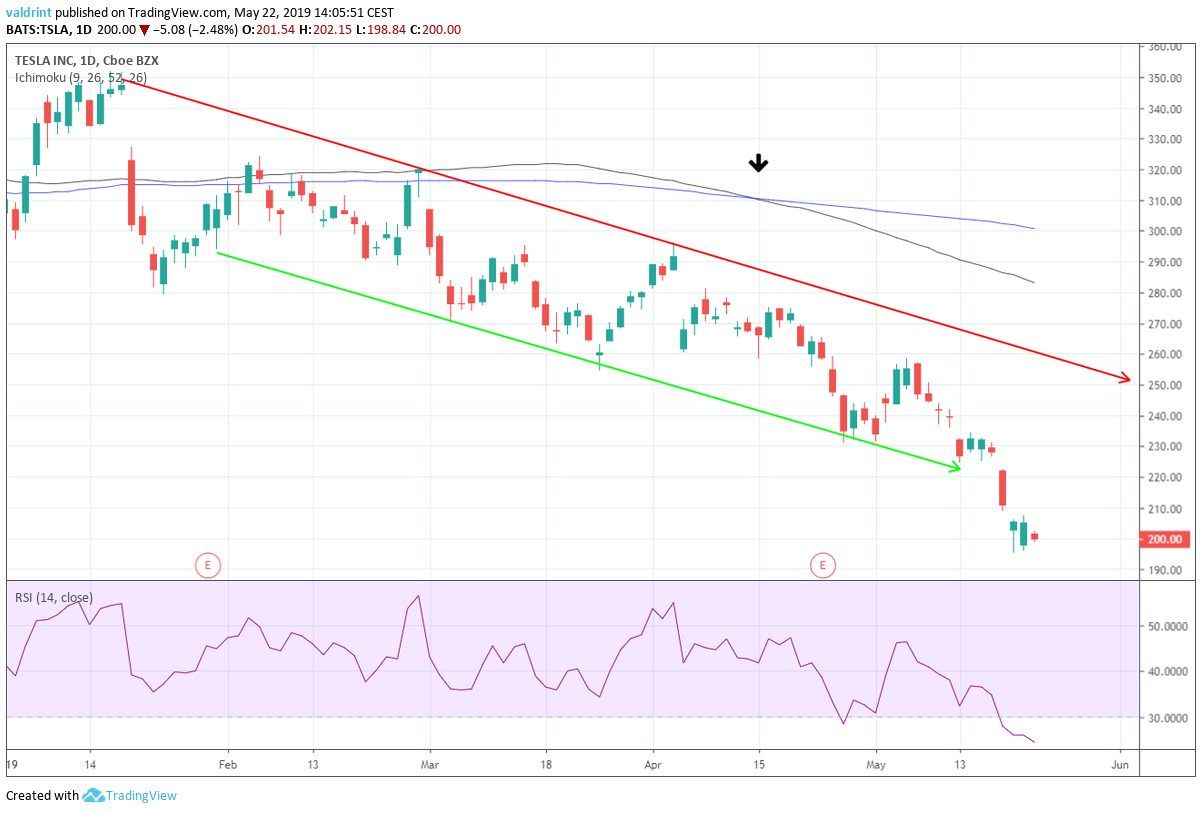
On Apr 15, the 100-day MA crossed below the 200-day one generating a bearish cross. Subsequently, the price fell as expected and reached the support line on May 1.
Previously, these moving averages have offered resistance to the price throughout February. At the time of writing, the price was trading significantly below both moving averages.
Additionally, the RSI is deep into oversold territory, but no bullish divergence has yet developed.
Therefore, it appears as if TSLA has already begun a downtrend. Furthermore, the technical indicators do not show any signs of a possible reversal. Price drops are likely to continue; however, it is unclear if they will reach Morgan Stanley’s worst-case prediction of $10.
Comparison and Summary
The price of Bitcoin and Tesla are compared from January 1 to May 22, 2019 in the graph below. The right hand scale represents the increase/decrease in percentage terms.
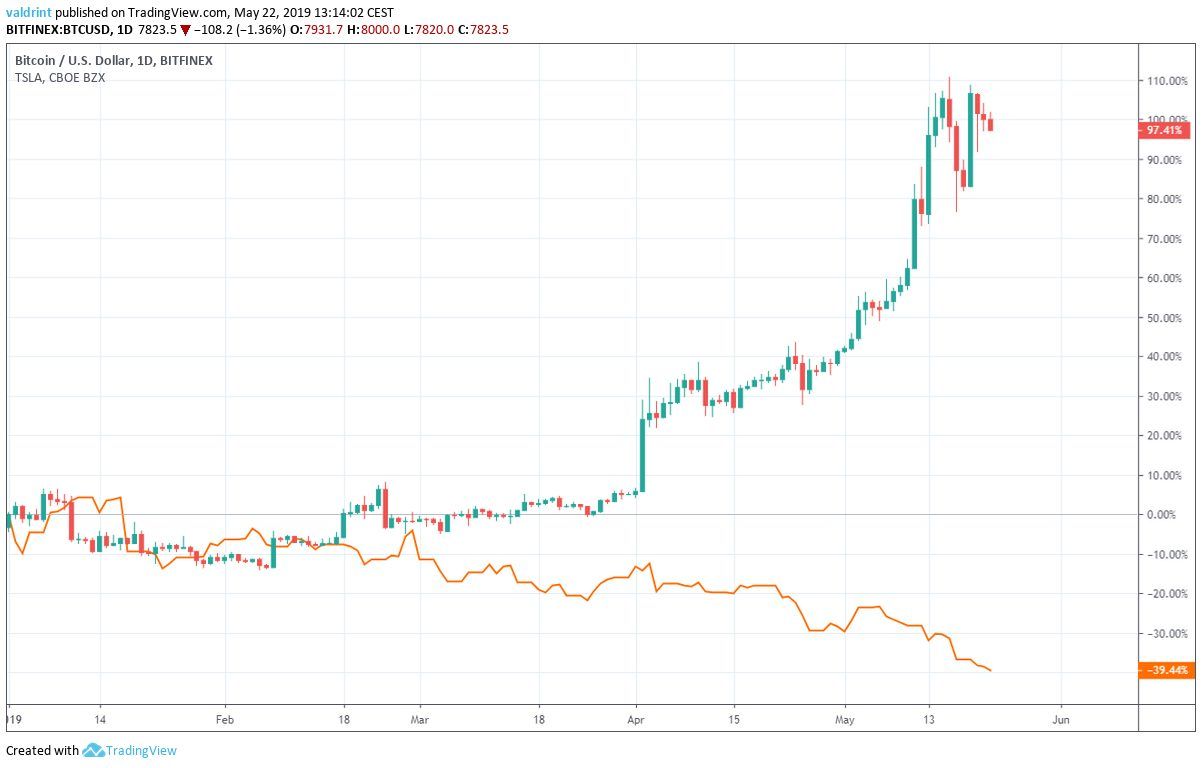
The prices of BTC and TSLA had similar rates of increase/decrease until the middle of February. Since then, BTC has been on a steady uptrend while TSLA has seen prices plummet.
In the case of Bitcoin, there are periods of gradual increases and rapid upward moves. The most significant ones occurred on Apr 2, May 13 and May 15. By May 16, BTC had increased by 110% relative to its Jan 1 price.
A slight decrease ensued. At the time of writing on May 22, BTC had increased by 97.41% since the beginning of the year.

TSLA, on the other hand, has been the subject of a slow, gradual decrease. While it has had some periods of consolidation and small upward bounces, they ultimately proved futile. At the time of writing, TSLA is at its lowest point yet, having decreased by 39.44%.
Do you think that TSLA will reach $10 before the end of 2019? Can we expect new highs for BTC before year’s end? Let us know your thoughts in the comments below!
Disclaimer: This article is not trading advice and should not be construed as such. Always consult a trained financial professional before investing in cryptocurrencies, as the market is particularly volatile.


