


The price of Bitcoin (BTC) has been increasing throughout the month of May. The price reached a high of $8325.3 and €7449.1 on May 16. After a rapid decrease, similar highs were reached on May 20.
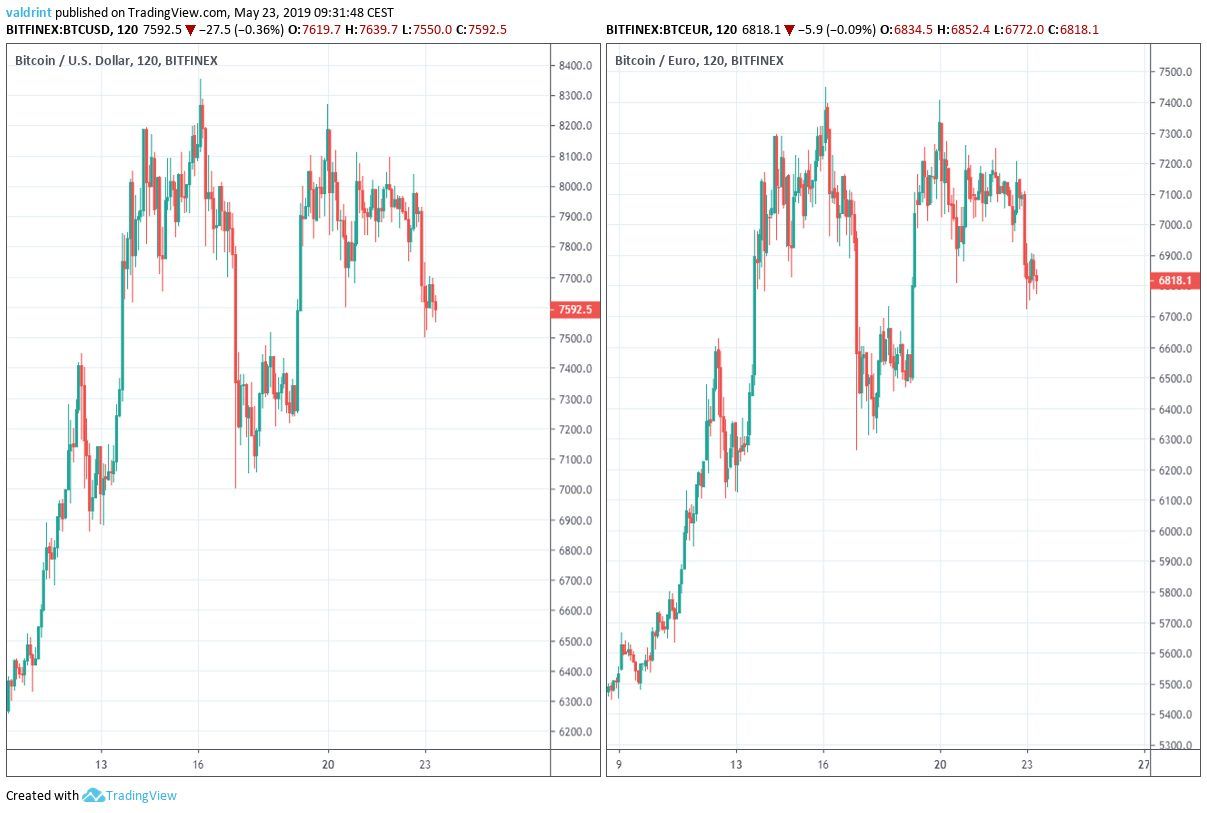
The price has been decreasing since. At the time of writing, it was trading close to $7600 and €6800.
Let’s find out.
BTC: Trends And Highlights For May 22, 2019
- The price reached a high of $8325.3 and €7449.1 on May 16.
- It is trading inside a symmetrical triangle
- It has possibly made a double top
- Bearish divergence is developing in the RSI and the MACD.
- There is resistance near $10000 and €8400.
- There is support near $6000 and €5300.
Tracing the Current Trading Pattern
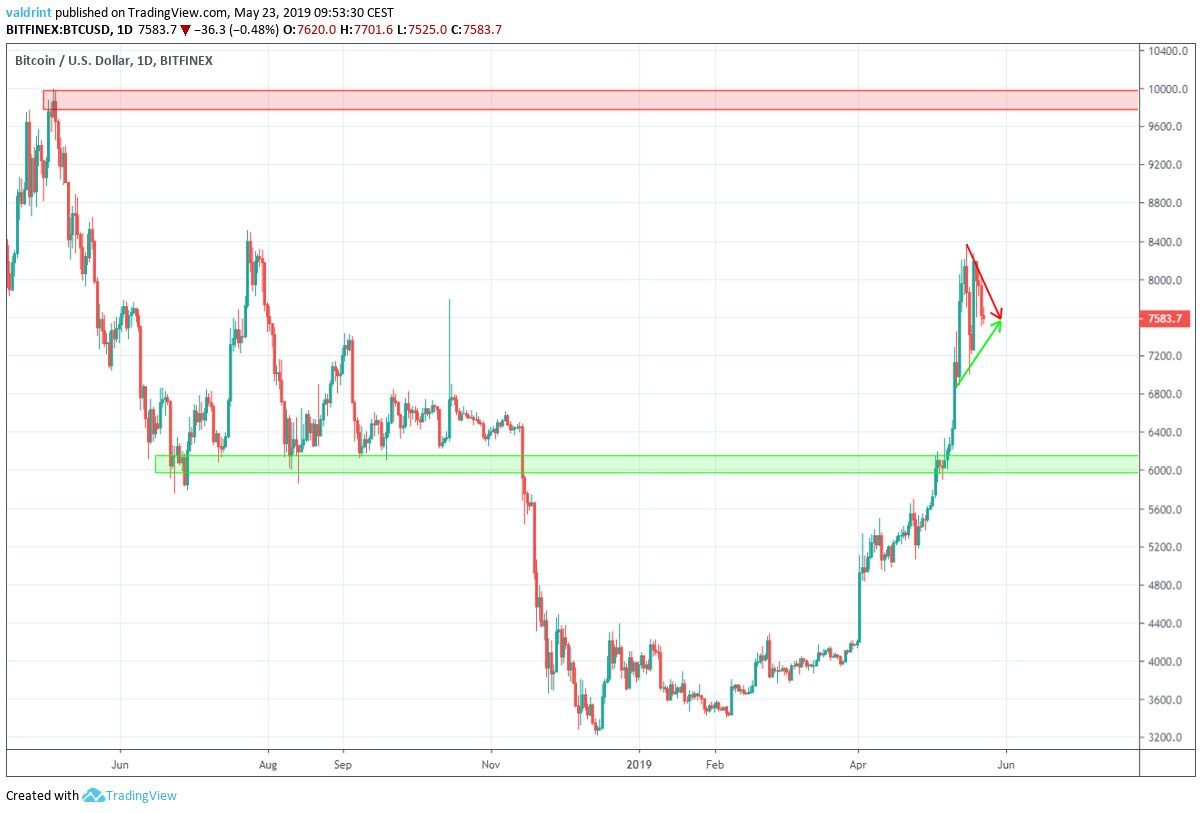
On May 12, the price made a low of $6858.0. A gradual increase took it to a high of $8325.3 on May 16. Since then, the price has been decreasing inside a symmetrical triangle:
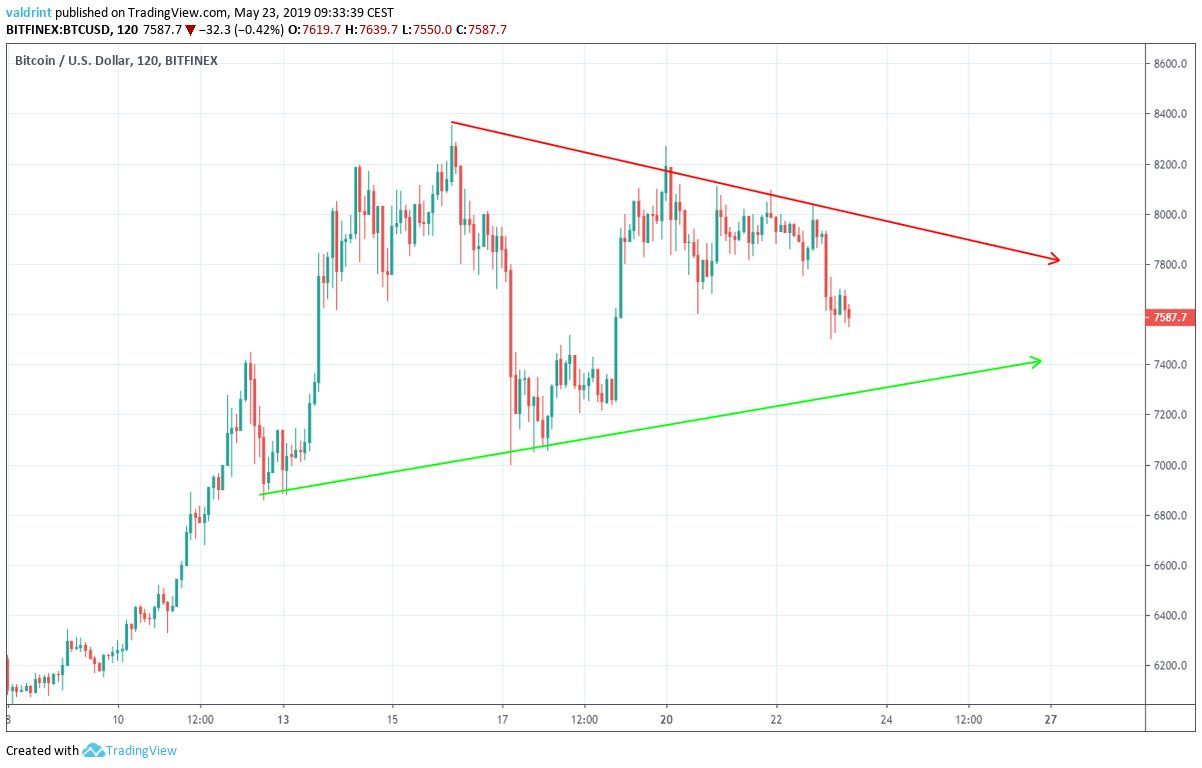
The resistance and support lines have been touched five and four times respectively. After last touching the resistance line on May 22, the price began dropping. At the time of writing, BTC was trading in the middle of the triangle.
Based on the pattern and the direction of the current move, it appears that BTC may soon reach the support line. At that time, a rebound to the resistance may also be likely.
Bearish Divergence?
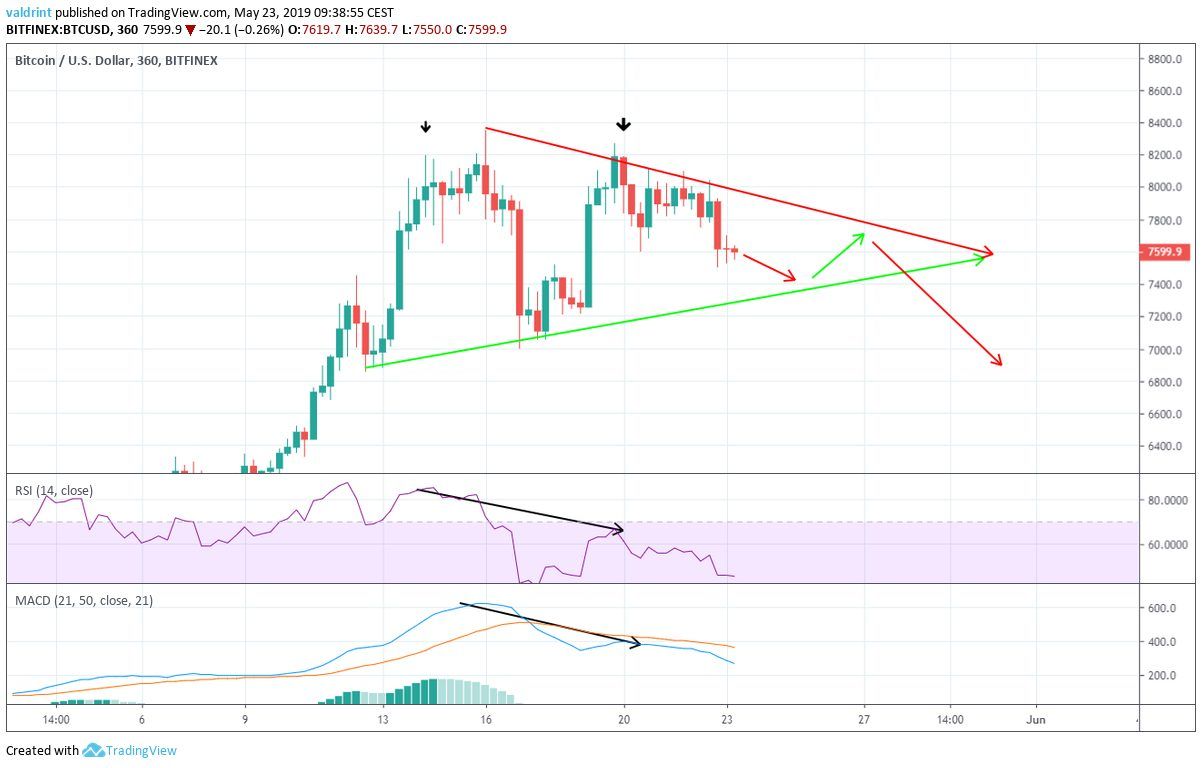
Bearish divergencce is observed for both the RSI and MACD during mid May. Since the divergence developed, the price of BTC has roughly followed both the MACD and RSI.
This is especially evident between May 16 and 19. During this period, the price reached the support line while the MACD and RSI also fell. The drop was most significant in the RSI.
Furthermore, the price seems to have made a double top pattern on May 14-20. This is a bearish reversal pattern.
Together, these indicators suggest that price will drop to the support line before rebounding to the resistance. At that time, another drop could cause the price of BTC to breakdown from the trading pattern.
Future Movement
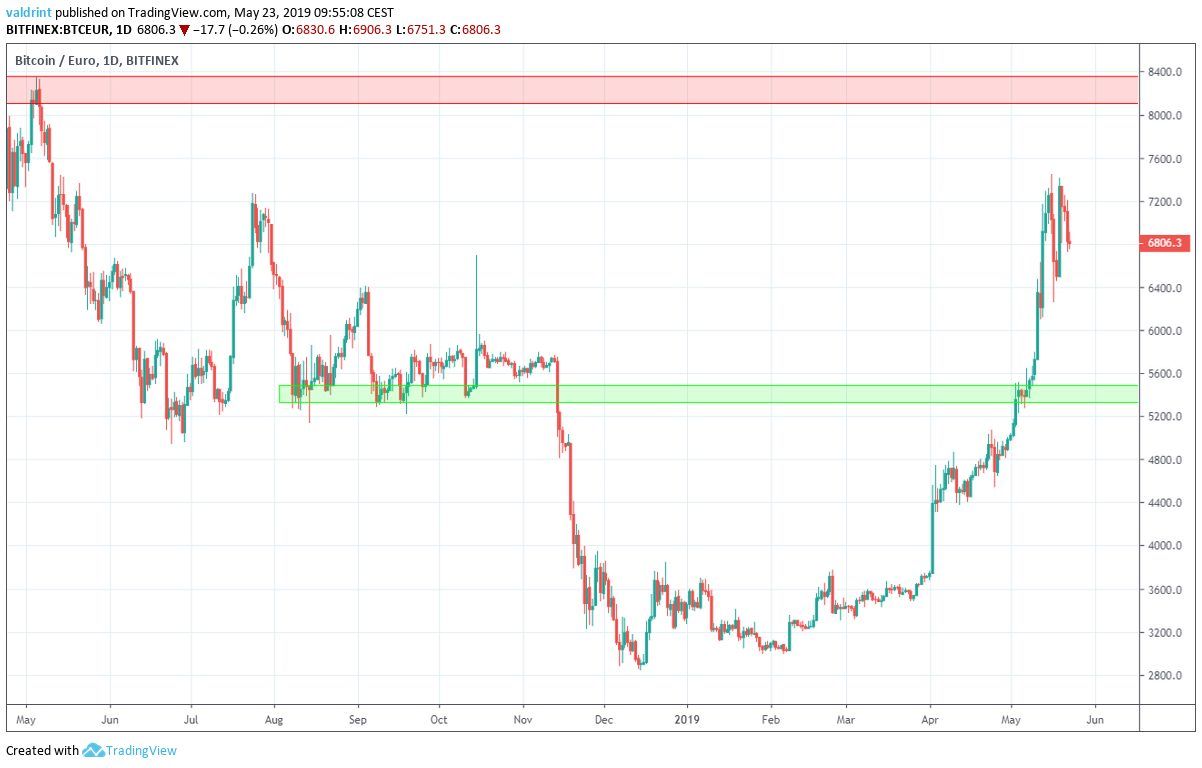
The closest support area is found near $6000 and €5400. A breakdown from the current pattern is required for the price to reach this area. As stated above, we believe a breakdown is likely but not in the immediate future. Price should drop and rise before falling to this support if our earlier predictions are true.
The closest resistance area is found near $10000 and €8300. A breakout from the current pattern is required for the price to reach this area. We do not believe that this is likely in the short-term. However, these levels may be if the price makes a successful reversal after its breakdown.
Do you think the price of BTC will begin a reversal? Let us know your thoughts in the comments below!
Disclaimer: This article is not trading advice and should not be construed as such. Always consult a trained financial professional before investing in cryptocurrencies, as the market is particularly volatile.


