


Axie Infinity (AXS) has broken down from its corrective pattern, but it is attempting to create its first higher low on the heels of the first AxieCon conference.
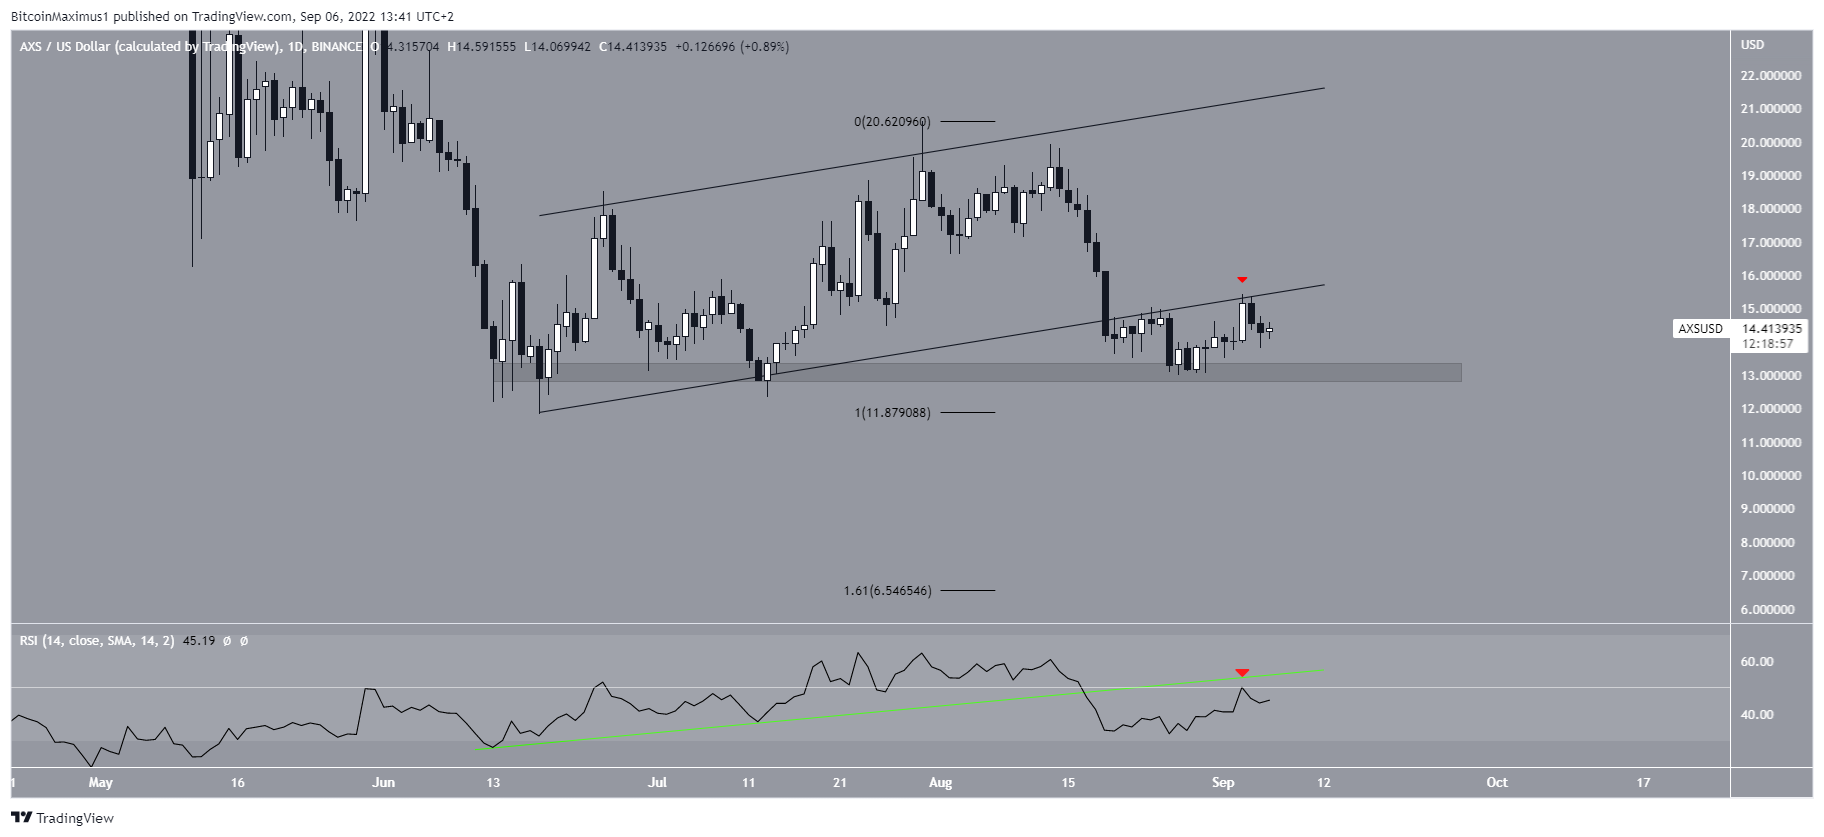
AXS had been increasing inside an ascending parallel channel since June 18. While doing so, it reached a high of $20.60 on July 30. The price has been falling since and broke down from the channel on Aug 19.
However, it bounced at the $13.15 support area afterward. It is now in the process of creating its first higher low.
Despite the show of strength, AXS was rejected by the support line of the previous channel. The line is now expected to act as resistance.

AxieCon starts tomorrow
Axie infinity content creator @AxieLima tweeted a picture with the Axie co-founder @Jihoz_Axie, showing its anticipation for the AxieCon event which is held in Barcelona between Sept 7 and 10.
This is the first such event for Axie, in which community members around the world will gather in order to meet and greet each other.
While no significant developments are expected to be announced during this time, there will be several events that are exclusive to holders, showing a positive side of being an Axie holder throughout this time.
Moreover, there is some speculation for potential surprise announcements, since the roadmap projects new developments to occur in the fourth quarter of this year.
Furthermore, AxieCon is coming in the heels of a new marketplace update, which is the first step in turning the marketplace into a hub for the Axie community and its ecosystem.
Future AXS movement
The readings from the daily RSI support the continuation of the downward movement. The indicator has broken down from an ascending support line (green) and decreased below 50 afterward. Currently, it is in the process of validating the 50 line as resistance (red icon).
So, if the price breaks down from the $13.15 horizontal support area, it could drop all the way down to $6.55. This is the 1.61 external Fib retracement level when measuring the most recent bounce.
For Be[in]Crypto’s latest Bitcoin (BTC) analysis, click here
