
The Fantom (FTM) price has possibly completed a short-term correction and begun the final portion of a significant upward movement.
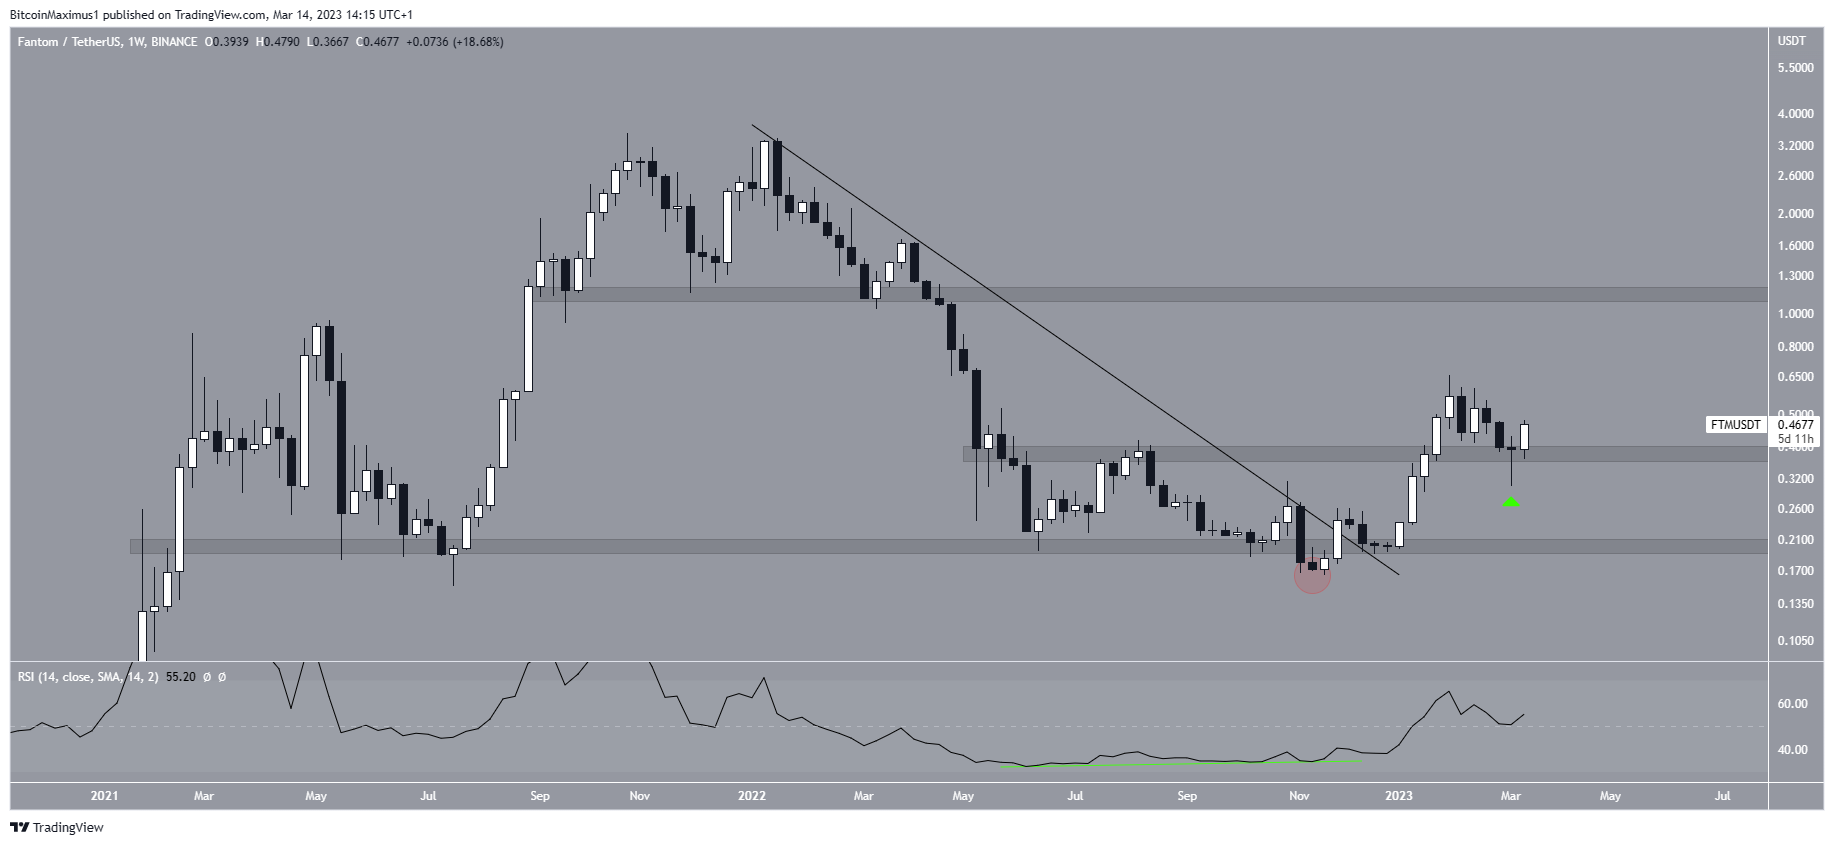
The FTM price had fallen under a descending resistance line since reaching an all-time high in January 2022. The decrease led to a low of $0.164 in November 2022, causing a breakdown from the $0.20 support area. However, that turned out to be a deviation (red circle), and the Fantom price has increased since.
The upward movement was preceded by a bullish divergence in the RSI (green line). Moreover, the indicator is now above 50, another sign of a bullish trend. The upward movement led to a high of $0.655 in January. While the price decreased afterward, it bounced at the $0.39 horizontal area, creating a long lower wick and validating it as support.
If the increase continues, the next closest resistance would be at $1.15. On the other hand, a close below $0.39 could lead to a fall toward $0.20.
Can Fantom (FTM) Price Move to $1.15?
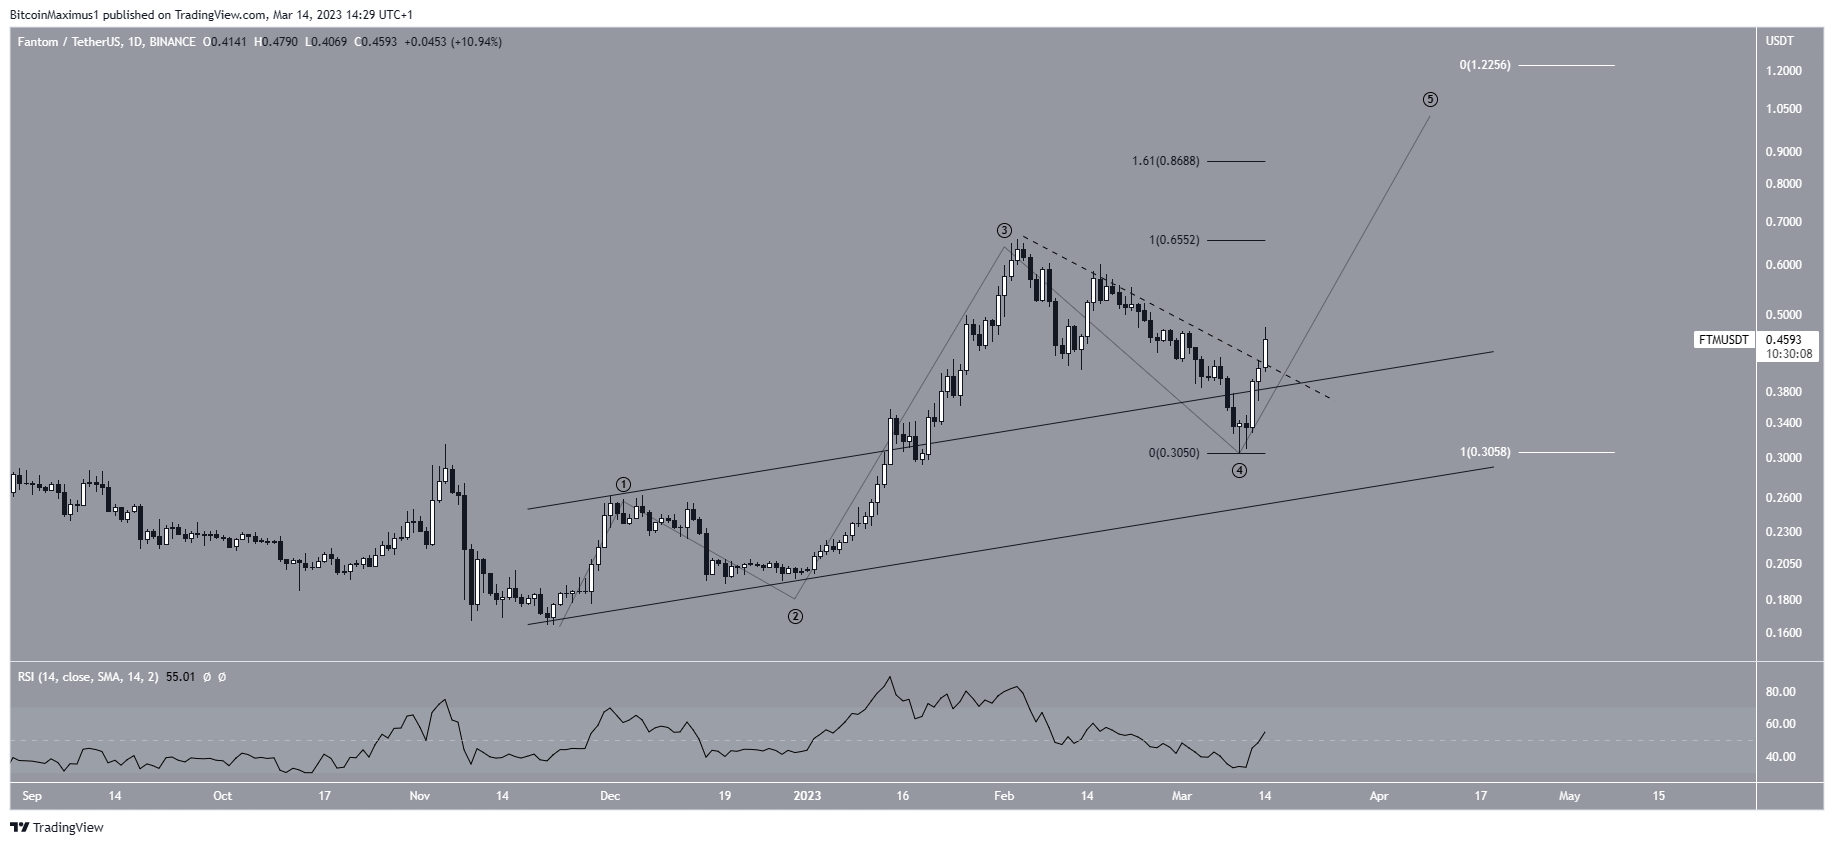
The daily time frame aligns with the readings from the weekly one, supporting the continuation of the upward movement. There are several reasons for this.
Firstly, the price seems to have completed a fourth-wave pullback after bouncing at the resistance line of the previous ascending channel.
Secondly, the daily RSI has moved above 50. Lastly, the FTM token price is in the process of breaking out from a short-term descending resistance line (dashed). The breakout can be confirmed in the next 24 hours.
If the price is indeed in the fifth wave, the first potential target for the top would be at $0.87, created by the 1.61 external Fib retracement of the most recent drop. However, if wave five extends and has the entire length of waves one and three combined, it could move all the way to $1.22 (white). Since this also has confluence with the $1.15 horizontal resistance area, it would make more sense if it acts as the top.
On the other hand, a fall below the wave four low at $0.30 would invalidate this bullish forecast. In that case, the FTM price could fall toward $0.20 once more.
To conclude, the most likely FTM price forecast is an increase toward at least $0.87 and possibly $1.15-$1.22. This would be invalidated by a fall below $0.30. In that case, the FTM price could fall to $0.20.
