


The Bitcoin Dominance Rate (BTCD) has broken down below a support level that has been in place since June 2019.
Unless it is successful in reclaiming it, the BTCD is expected to continue moving downwards.
Breakdown From Long-Term Support
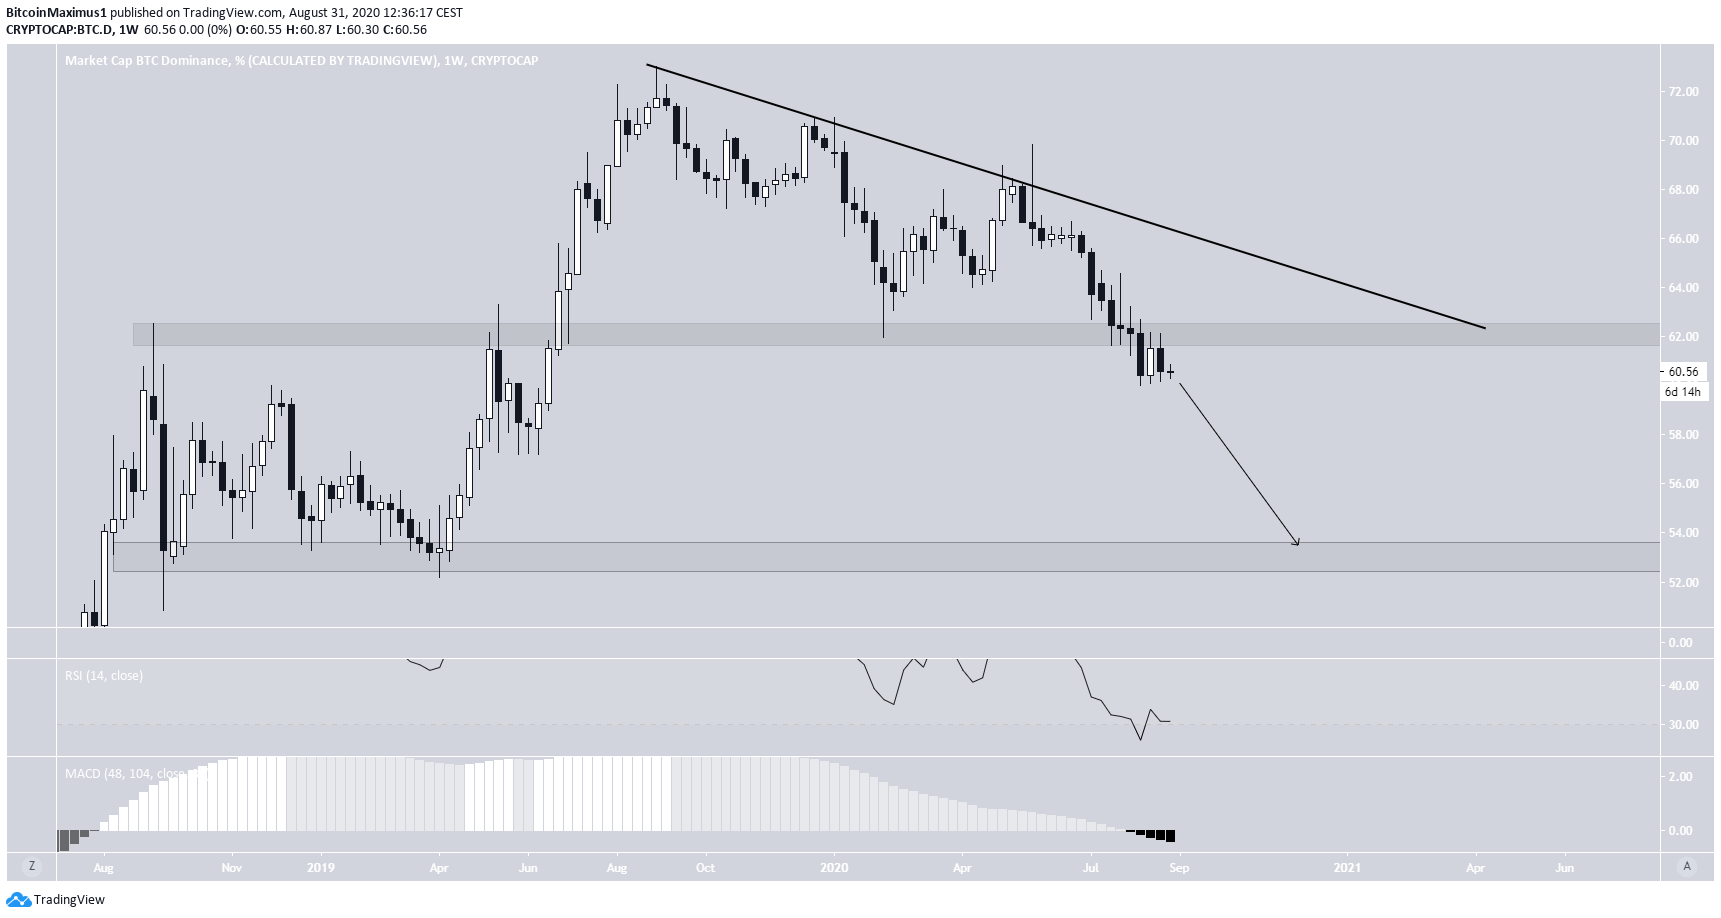
The Bitcoin dominance rate has been decreasing since Sept 5, 2019, when it reached a high of 73.09%.
Since then, the rate has been following a descending resistance line and has validated it multiple times up to this point, most recently in May 2020. Since then, the BTCD has been decreasing at an accelerated rate.
At the beginning of August, the BTCD fell below the 62.30% support area, something which it had not done since June 2019.
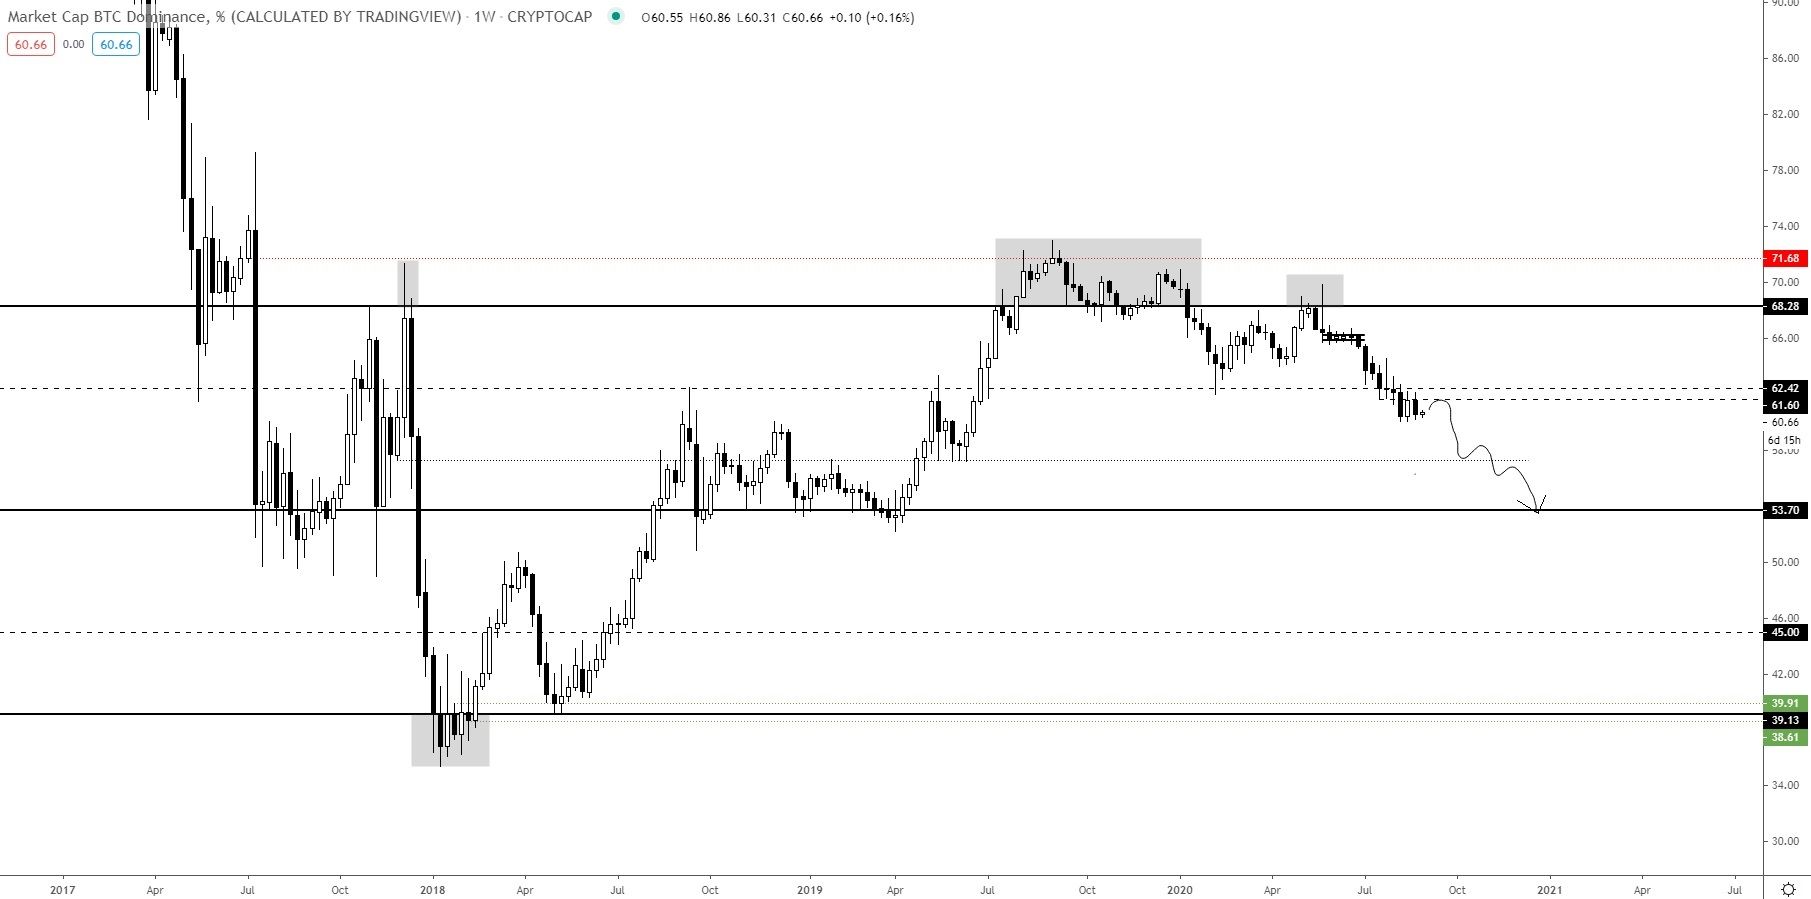
Unless it is successful in reclaiming this level, the BTCD would be expected to decrease all the way to the next support level at 53.80%. If it is able to reclaim it, the closest resistance would be found near 66%, the aforementioned descending resistance line.
This increase would fit with the possible wave count that BeInCrypto discussed in our previous BTCD analysis.
Technical indicators suggest a decrease is likely. The MACD is decreasing and has fallen into negative territory, and while the RSI is oversold, it has not generated any type of bullish divergence.
Cryptocurrency trader @TheEurosniper outlined a Bitcoin dominance chart, stating that the rate is likely to decrease towards 53%, allowing altcoins to increase considerably. This fits with both our range and technical indicator analyses.
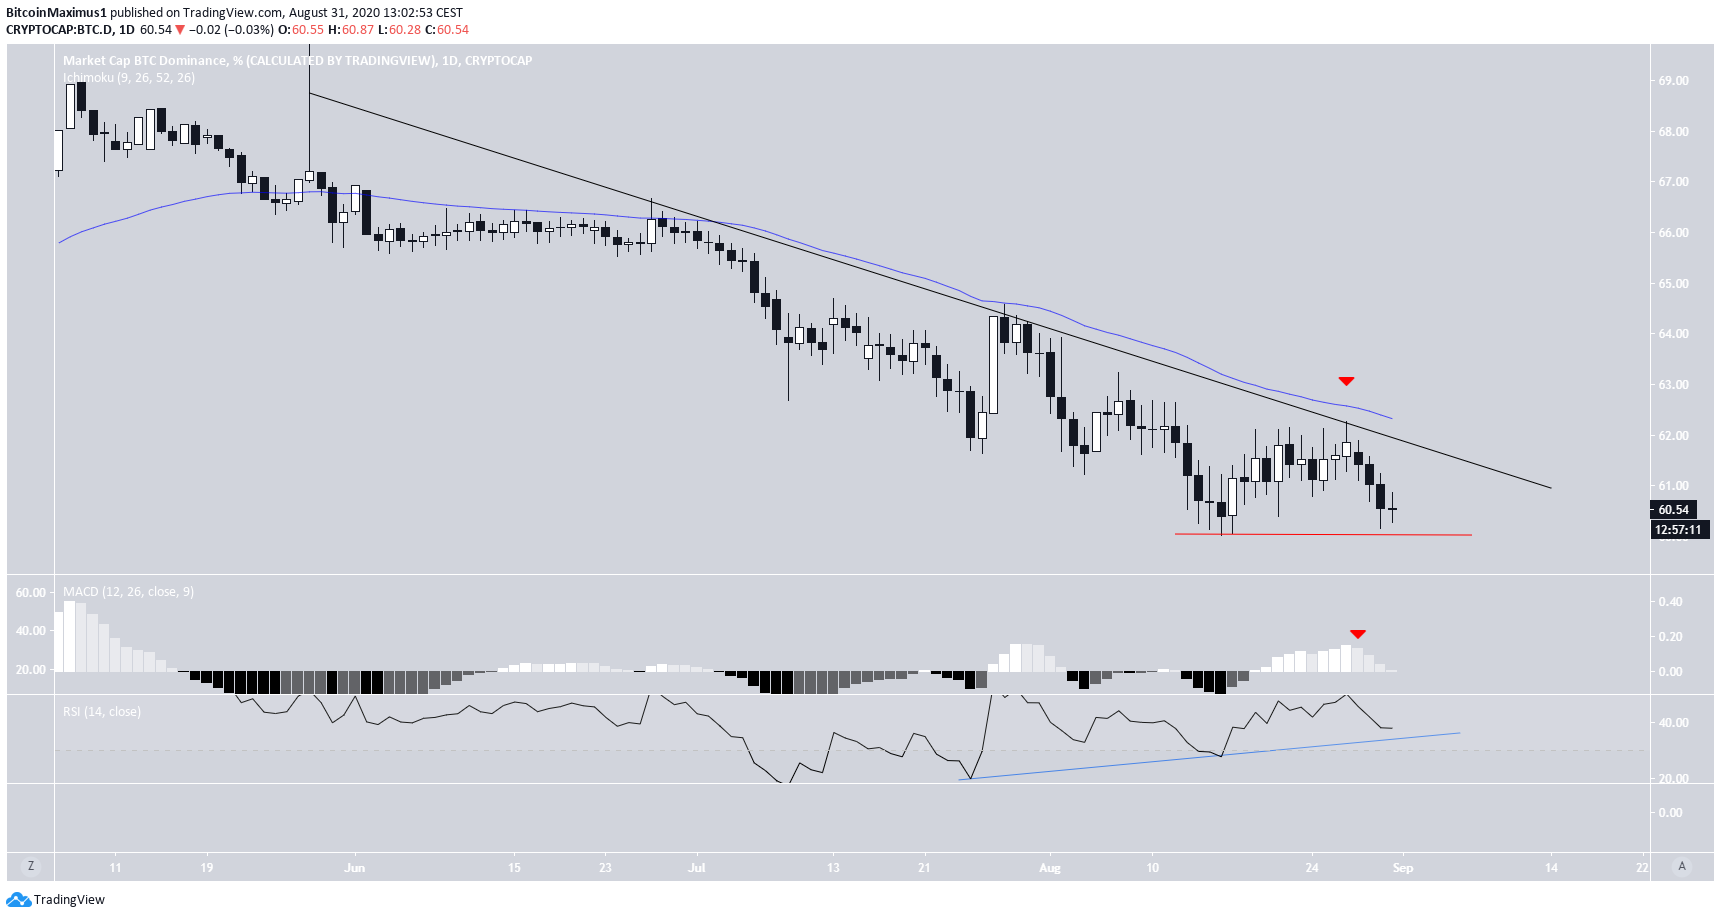
Short-Term Resistance
The daily chart shows that the rate is also following a descending resistance line, which is just above the current rate and is strengthened by the 50-day moving average.
In addition, the MACD has begun to decrease, getting ready to cross into negative territory.
However, there is a growing bullish divergence developing in the RSI. The divergence could initiate a bounce, especially if the rate manages to create a double-bottom pattern near 60%. On the other hand, if it decreases below 60%, it would drastically reduce the chances of a bounce.
To conclude, unless the BTCD manages to break out above the short-term descending resistance line and reclaim the long-term support level, it is expected to continue decreasing towards 53.8%.


