


The Bitcoin Dominance Rate (BTCD) has fallen below an important support level and validated it as resistance after.
Other technical indicators suggest a reversal is near, which would likely be confirmed if it is able to reclaim the support.
BTCD Gunning to Recapture Support
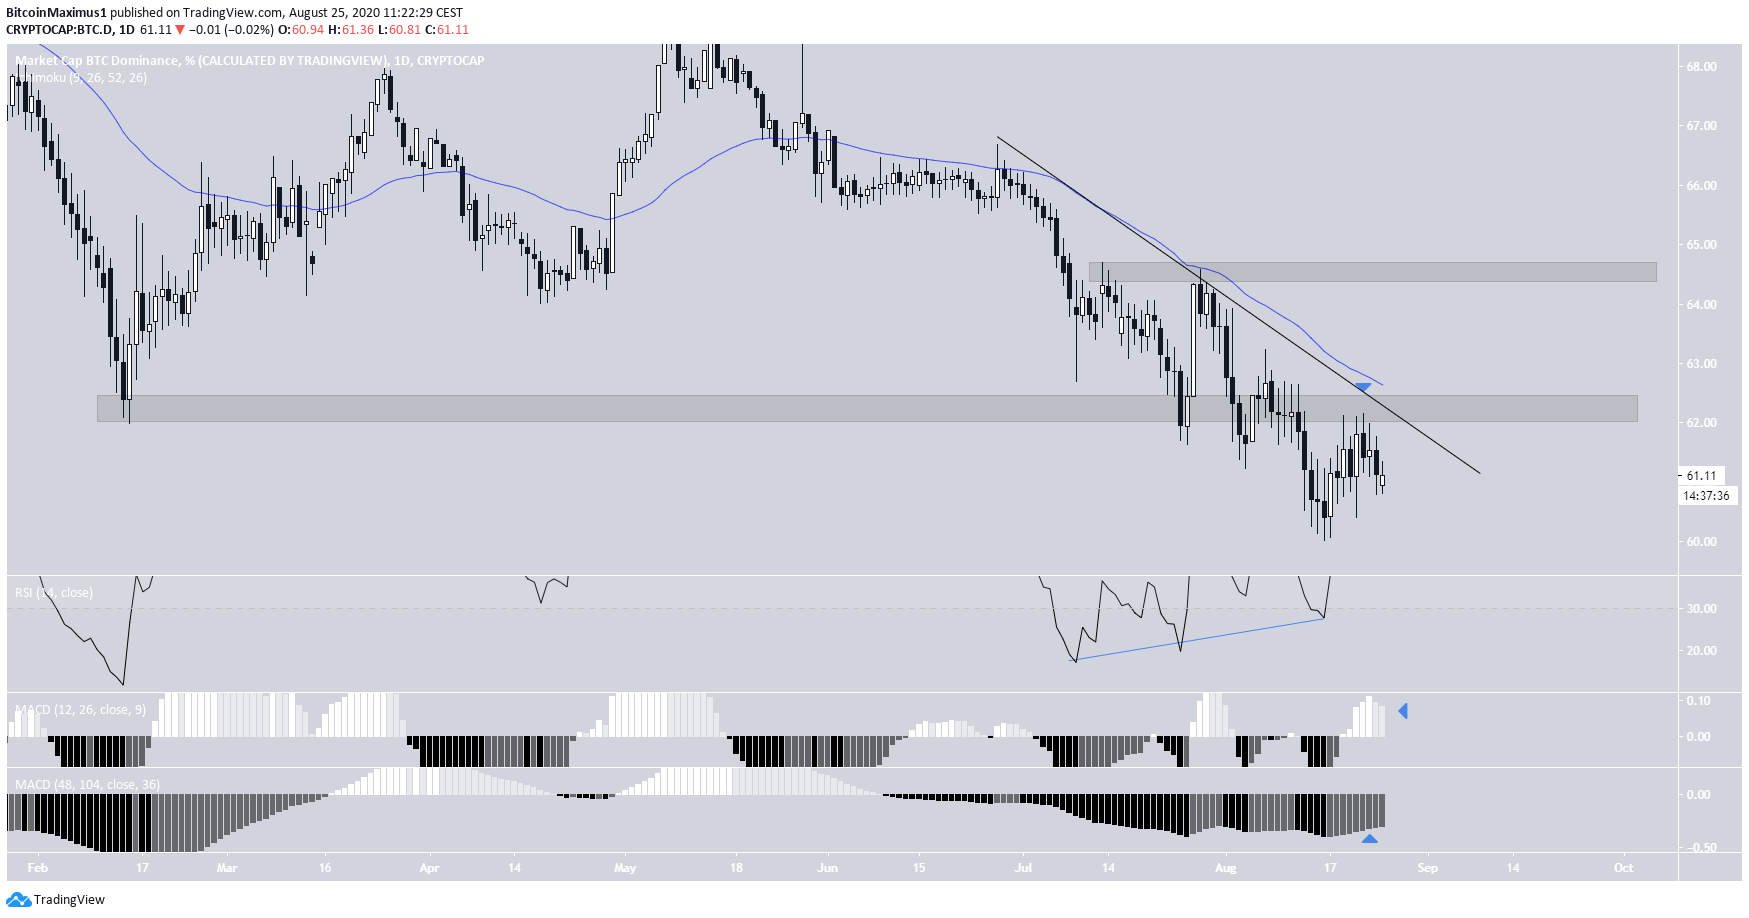
The Bitcoin dominance rate has been decreasing since reaching a local top on May 8.
Since June 22, the rate has been following a descending resistance line which has been validated on multiple occasions up to this point. The line is also strengthened by the 50-day moving average (MA).
At the beginning of August, the rate fell below 62.30%, which had been acting as support since February. It followed this up by validated the line as resistance after.
While this is normally considered a bearish signal, other technical indicators suggest a bullish reversal is near.
There is a triple bullish divergence that has developed in the RSI, the short-term MACD has crossed into positive territory, and the long-term MACD is giving a bullish reversal signal.
If BTCD can reclaim the 62.30% area and break out from the descending resistance line, it would almost certainly confirm a reversal, and would likely send the BTCD back to 64%.
Wave Count
Cryptocurrency trader @Glowto1994 stated that:
$BTC.D My target has been hit as i posted last month. I am looking to see if we can get another push down if we can reject the lower range resistance
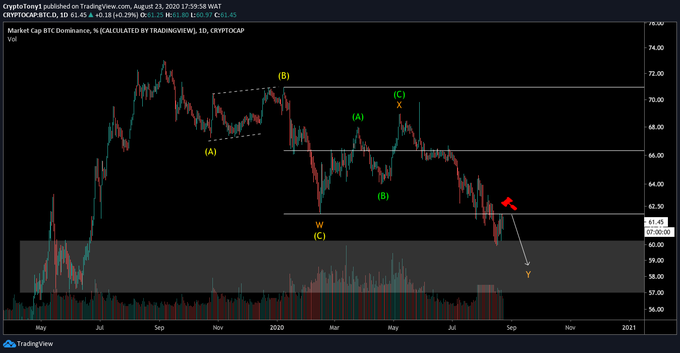
While we agree that the rate has been decreasing alongside a W-X-Y correction since August 2019 and that the target for the end of the correction is near 58%, an upward move before that seems likely both due to the wave count and the other reasons outlined in the first section.
It seems that the BTCD completed the A wave (black in the chart below) on Aug 16, and is now increasing as a part of the B wave. A likely level for the wave to end would be at 64.5%, both a previous support-area-turned-resistance and the 0.5 Fib level of the entire downward move.
Afterward, a decrease below 60% is still likely.
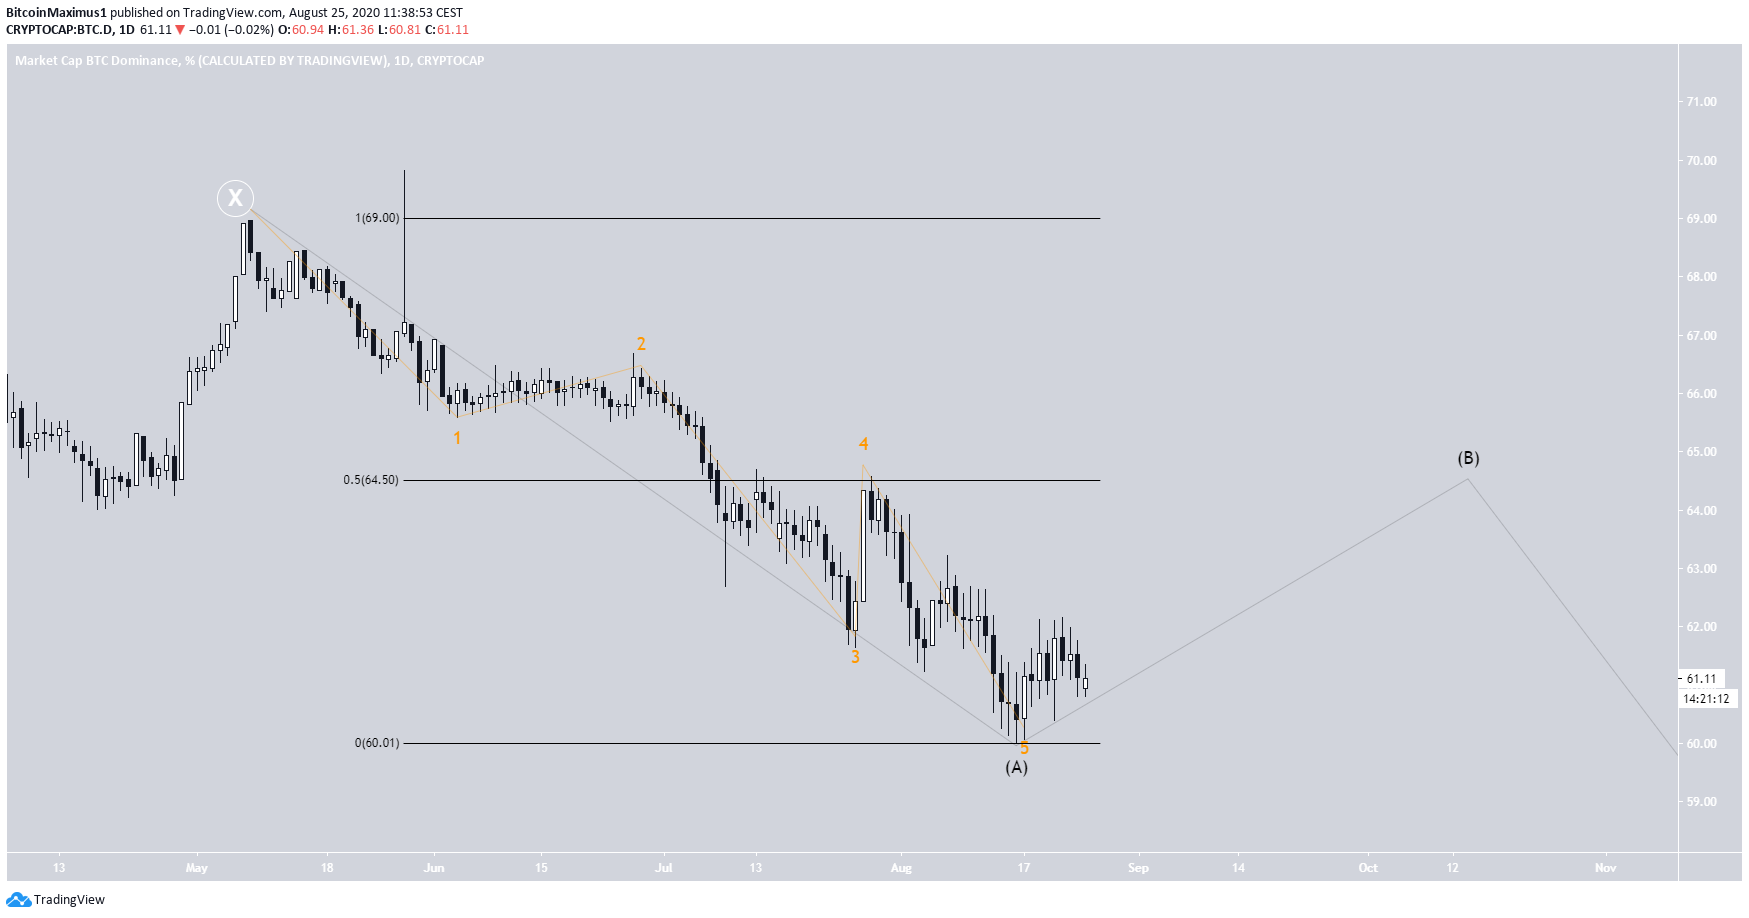
To conclude, BTCD is expected to increase gradually towards 64.5% before a sharp fall takes it below 60%.
For BeInCrypto’s latest Bitcoin (BTC) price analysis, click here!


