


VeChain (VET) has been one of the best performing cryptocurrencies since hitting an all-time low in March. The VET/USD pair increased by 1,500% in the three months that followed.
However, failure to reach a close above an important long-term resistance level has lead to the possibility that the upward move has ended and the price has begun a corrective period.
VET Battles Major Resistance
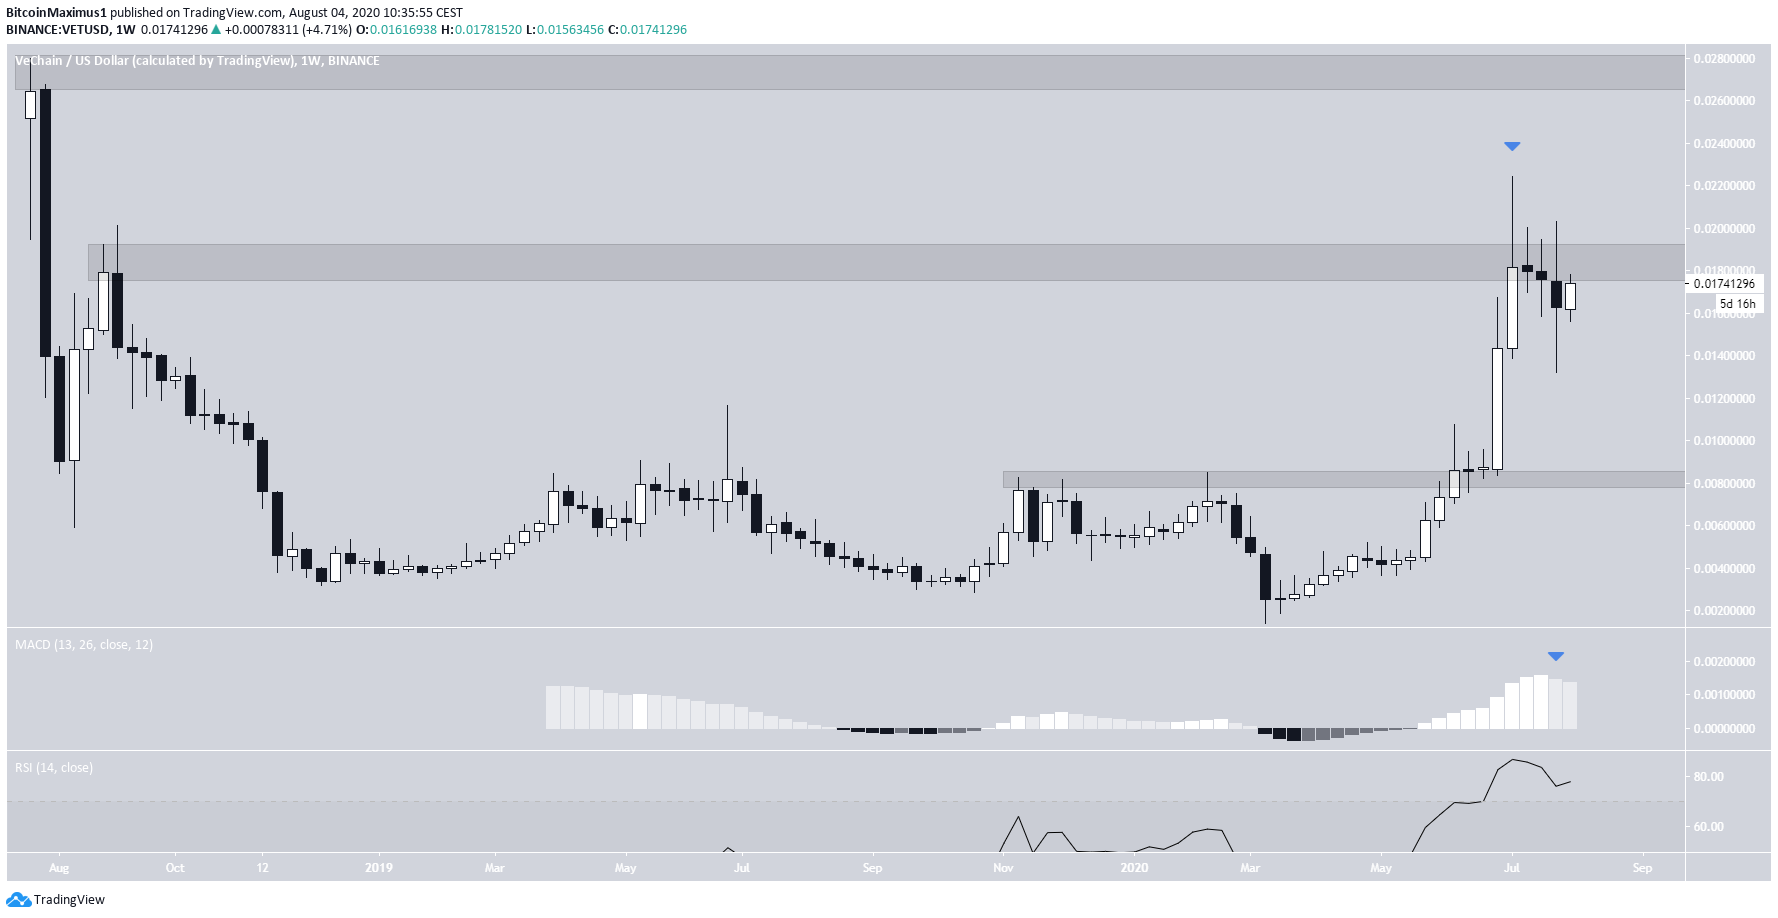
The VET price has been increasing since March when the price reached a low of $0.0013. The upward move has been extremely potent. The July high of $0.022 made for a %1,500 increase from the aforementioned lows.
However, the rally looks to have stalled out in mid-July. The price has failed to reach a close above $0.02, something it has not done since September 2018. It instead created a long upper-wick and has been on a downward trajectory since.
Long-term technical indicators are neutral but have begun to turn bearish. The MACD is decreasing and has already created a smaller momentum bar. While the RSI is overbought, it has not generated any bearish divergence.
If the price were to break out, the next resistance area would be found at $0.0275, while the closest support level is found near $0.0082.
Cryptocurrency trader @TeddyCleps outlined a VET chart that shows a descending parallel channel. A similar channel that was created in the latter half of June caused the upward move that led to the current high. In order to determine if the same things will happen this time around, we need to take a closer look at the shorter-term price movement.

Breakout Or Breakdown
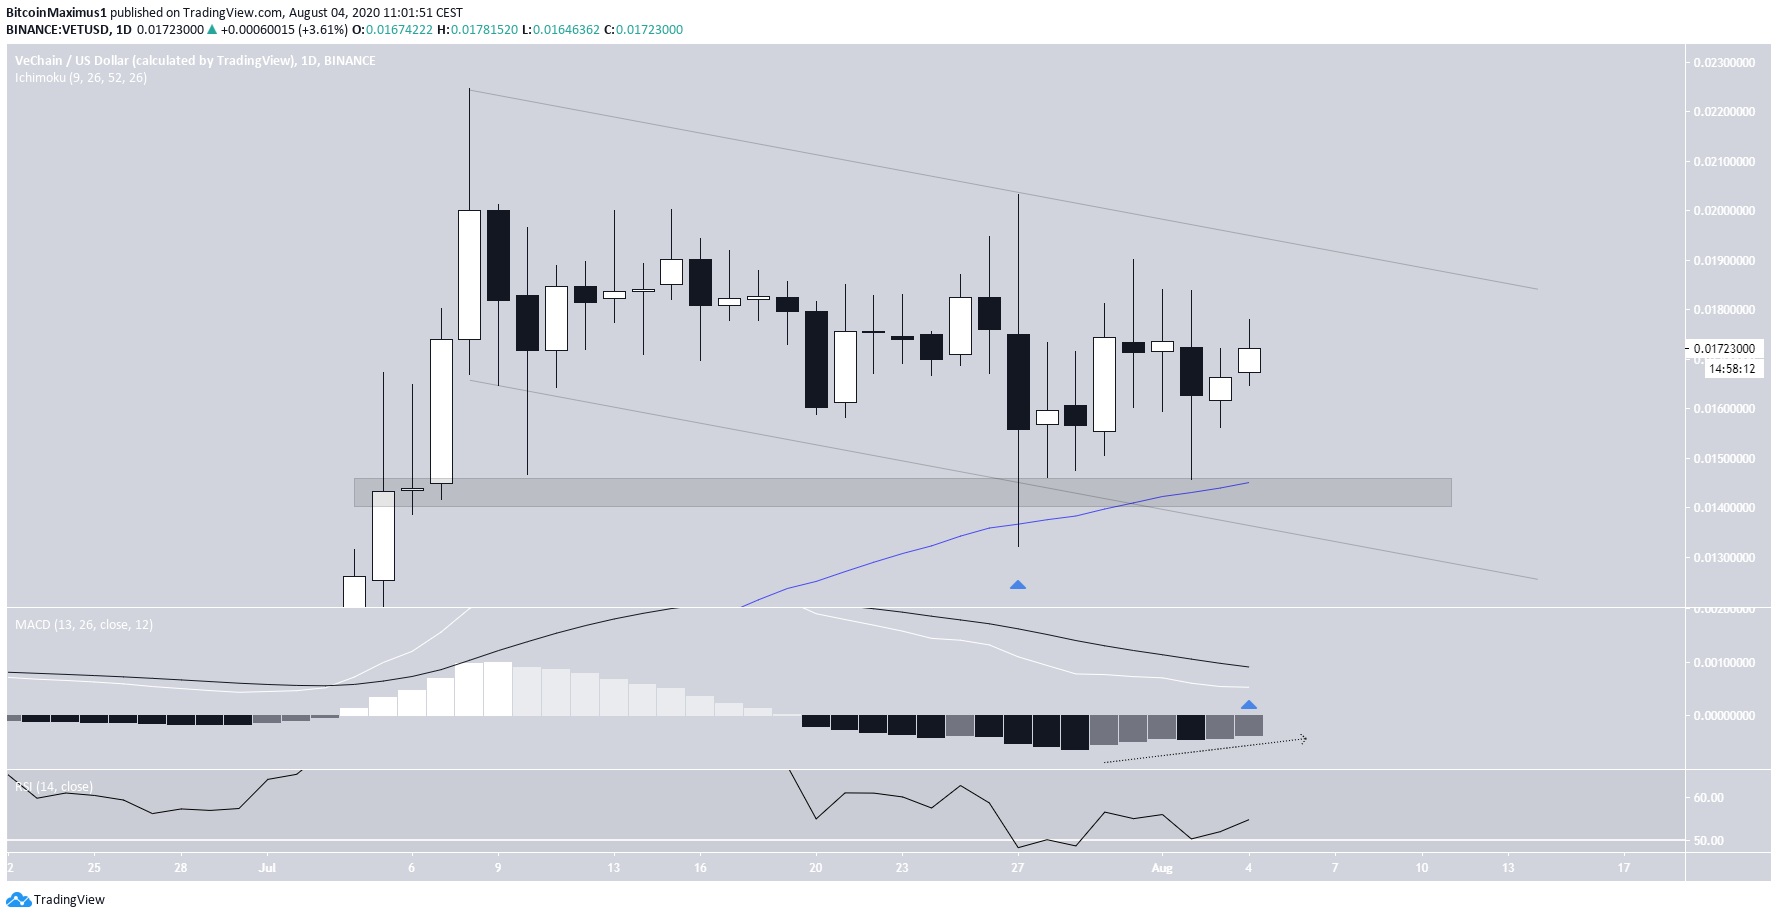
The daily chart shows that the price is possibly trading inside a descending channel. However, the presence of numerous wicks makes it difficult to determine the correct slopes of the lines.
The price has found support above $0.0154, coinciding with the 50-day moving average (MA). In addition, the MACD is increasing, possibly setting itself up for a bullish cross, and the daily RSI has held above 50.
This could indicate that the price will continue to increase towards the resistance line of the channel in the short term.
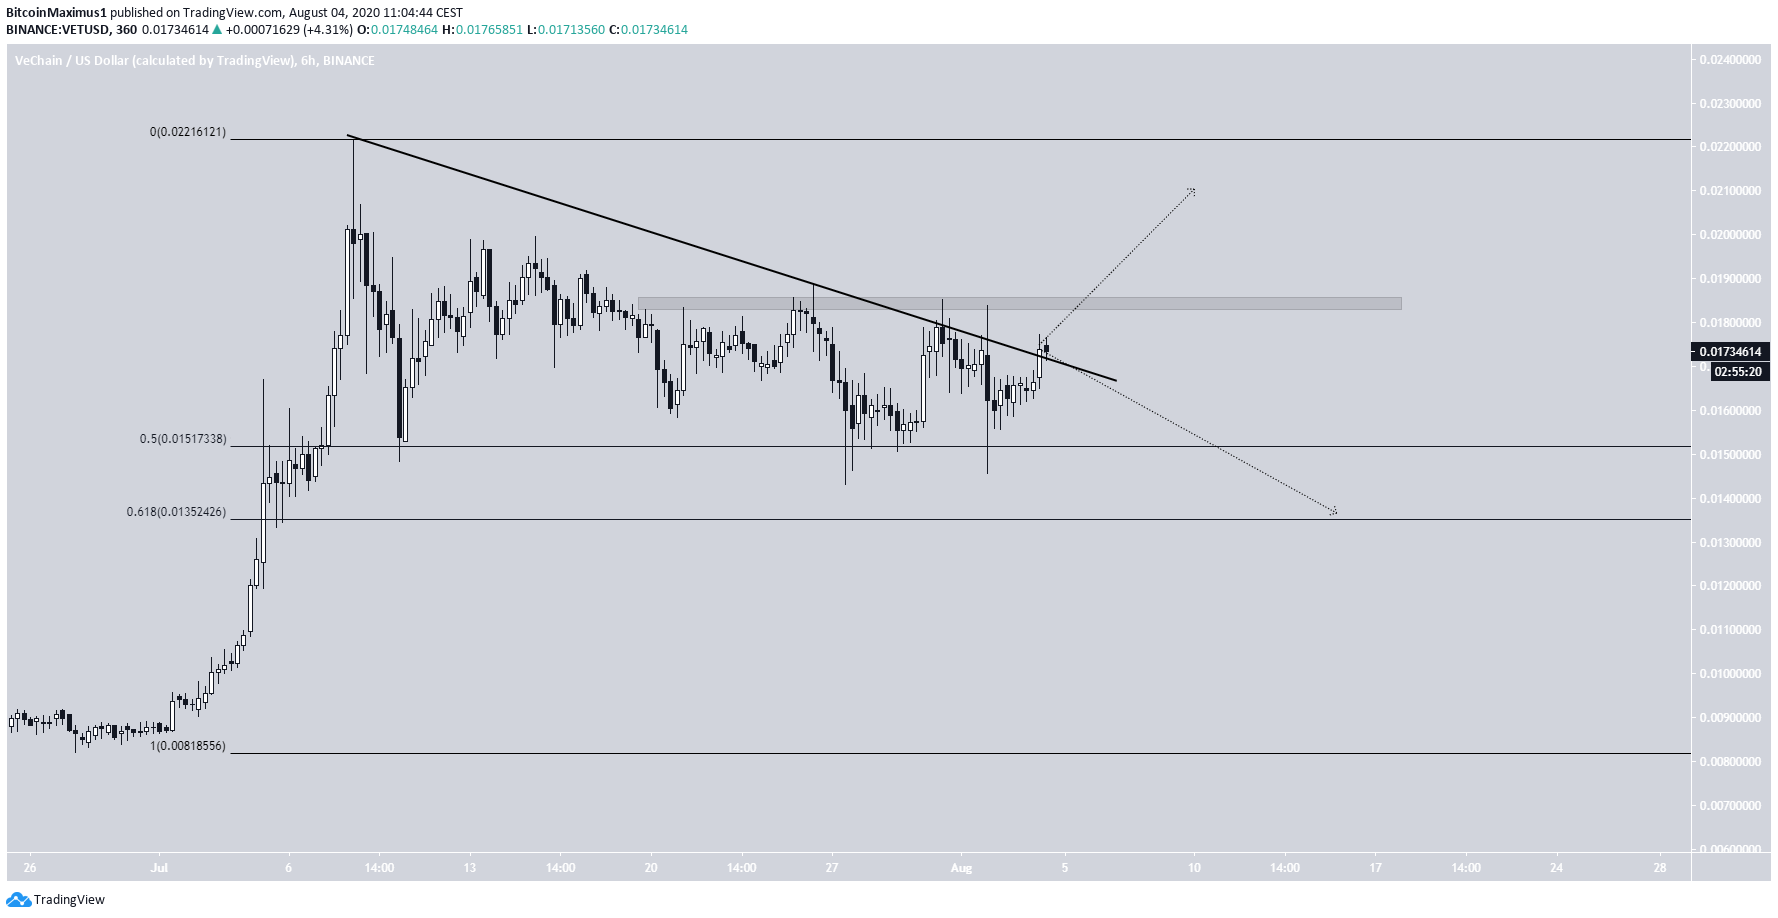
The 6-hour chart shows a slightly differently sloped descending resistance line, which highlights the difficulty of drawing trend-lines when there are so many wicks present.
The two likeliest possibilities for the future price movement are as follows:
A close above the $0.0183 area would likely mean an upward move towards the July highs. On the other hand, a rejection from the line would likely take the price towards $0.0136, the 0.618 Fib level of the pattern.
Wave Count
As for the wave count, it seems likely that the price has begun and possibly completed a five-wave Elliott formation since the March lows.
If this is correct, the most likely retracement level would be found at the 0.5-0.618 Fib levels between $0.009-$0.0117.
Otherwise, it is possible that the price is still inside its fifth wave, which has become extended. This scenario could take the price near the $0.0285 resistance area discussed in the first section.
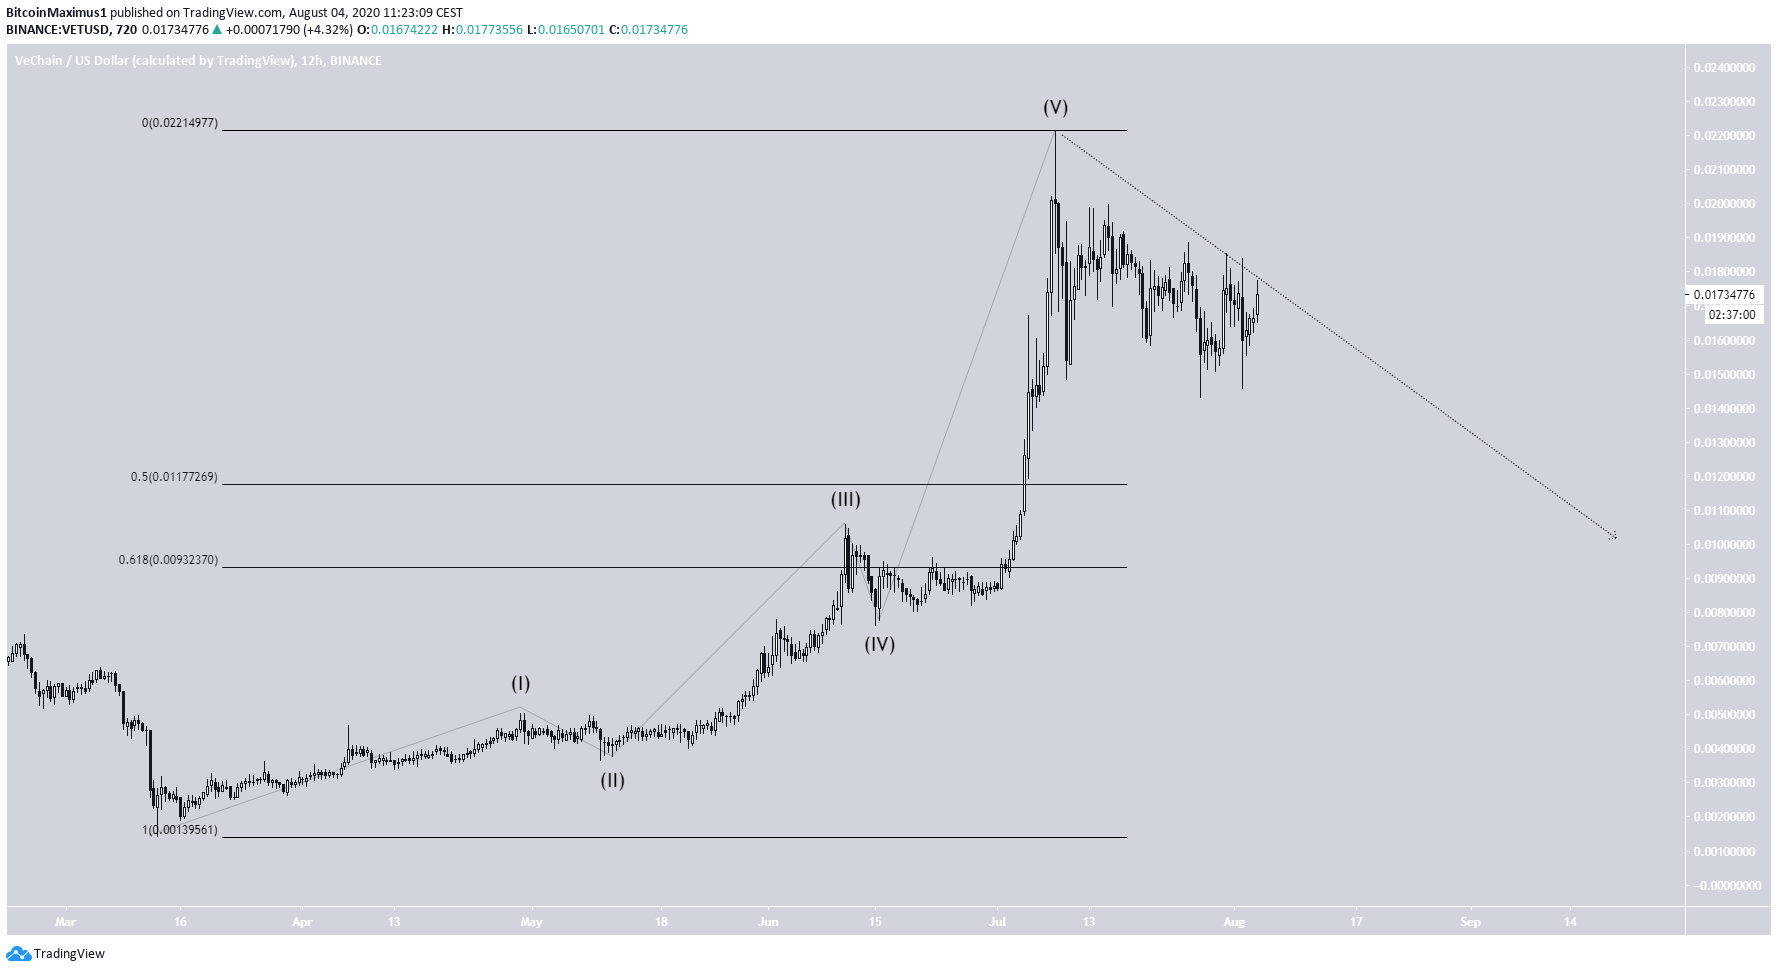
However, the sub-wave (white) count makes it more likely that the five-wave formation (black) is completed and that the price has now begun its correction, already completing its A wave (black).
Therefore, the B wave could take the price back to the July highs before the final downward move settles between the aforementioned 0.5-0.618 Fib levels.
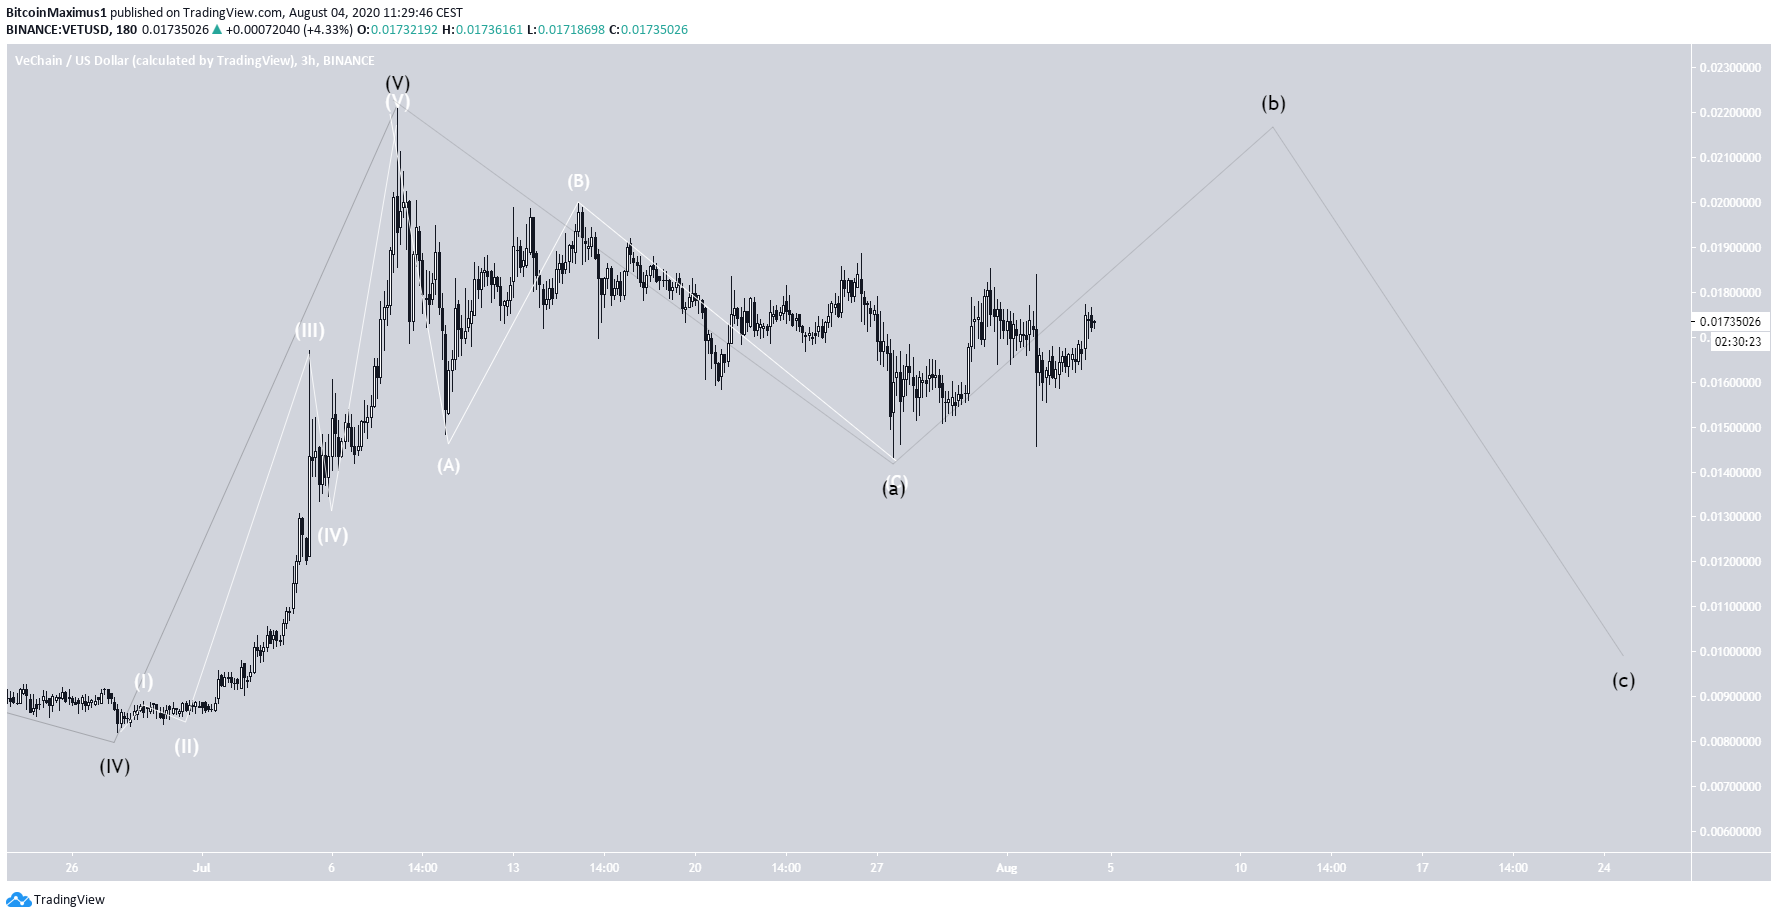
To conclude, it is possible that VET has already completed its upward move and is now in the process of correcting. However, even in this case, an upward move would be expected before the final drop that completes the correction.


