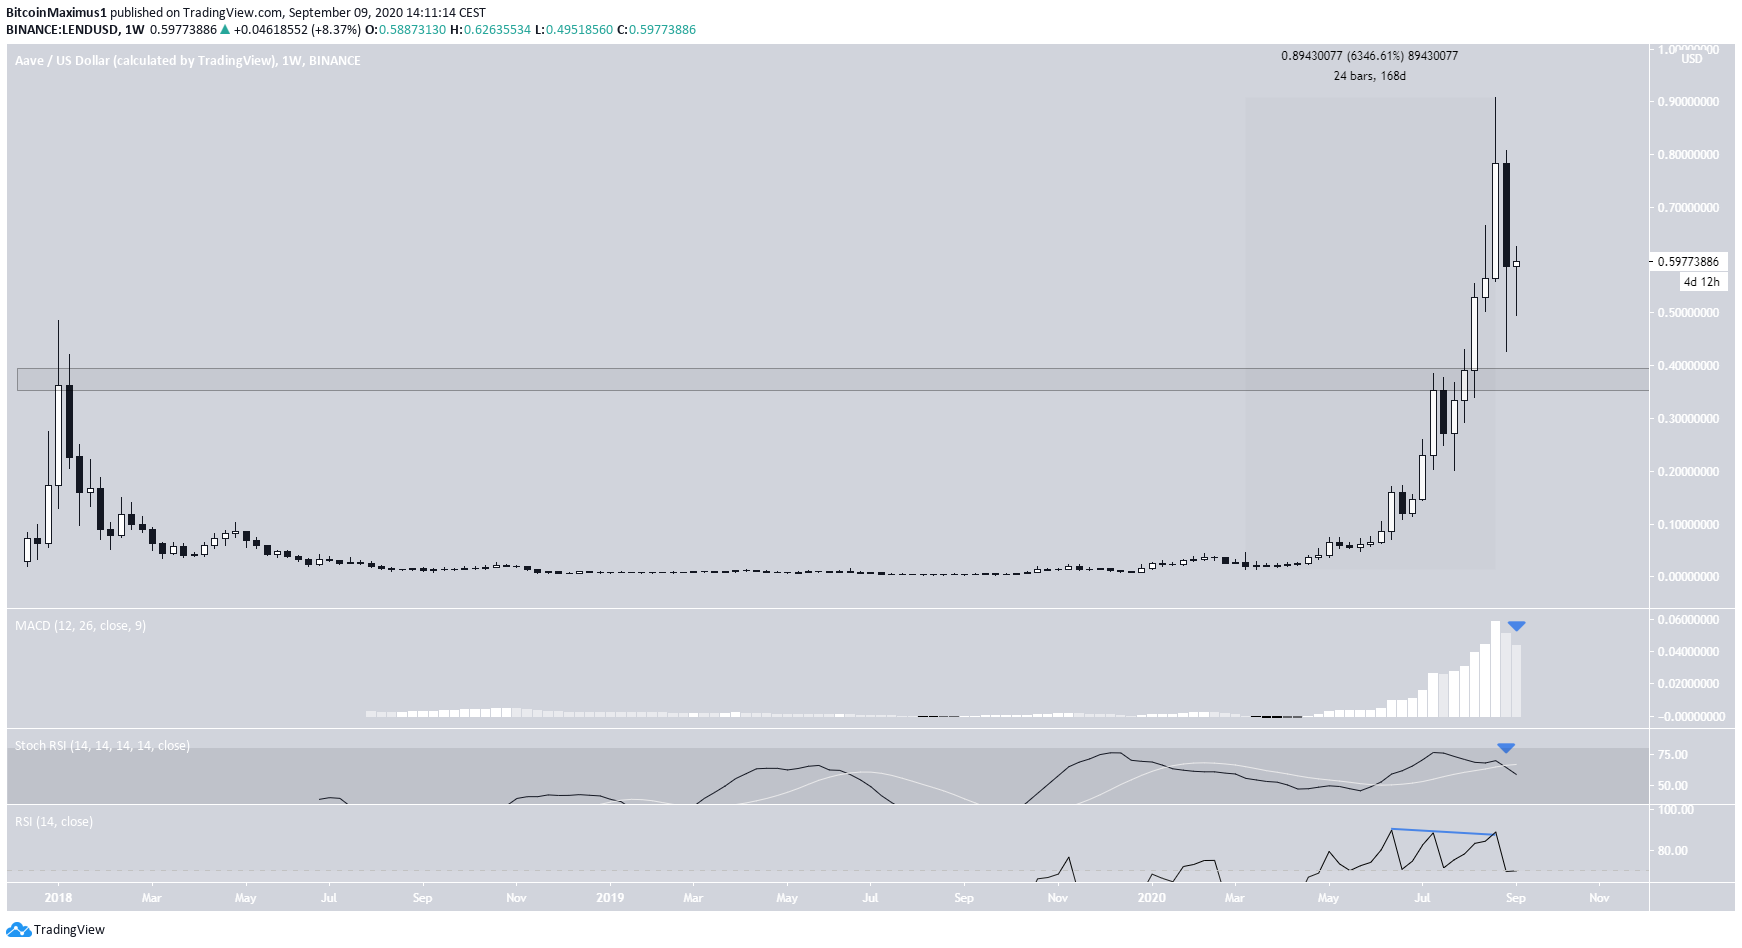
After increasing by more than 6000% in less than six months, Aave (LEND) may have begun a lengthy correction.
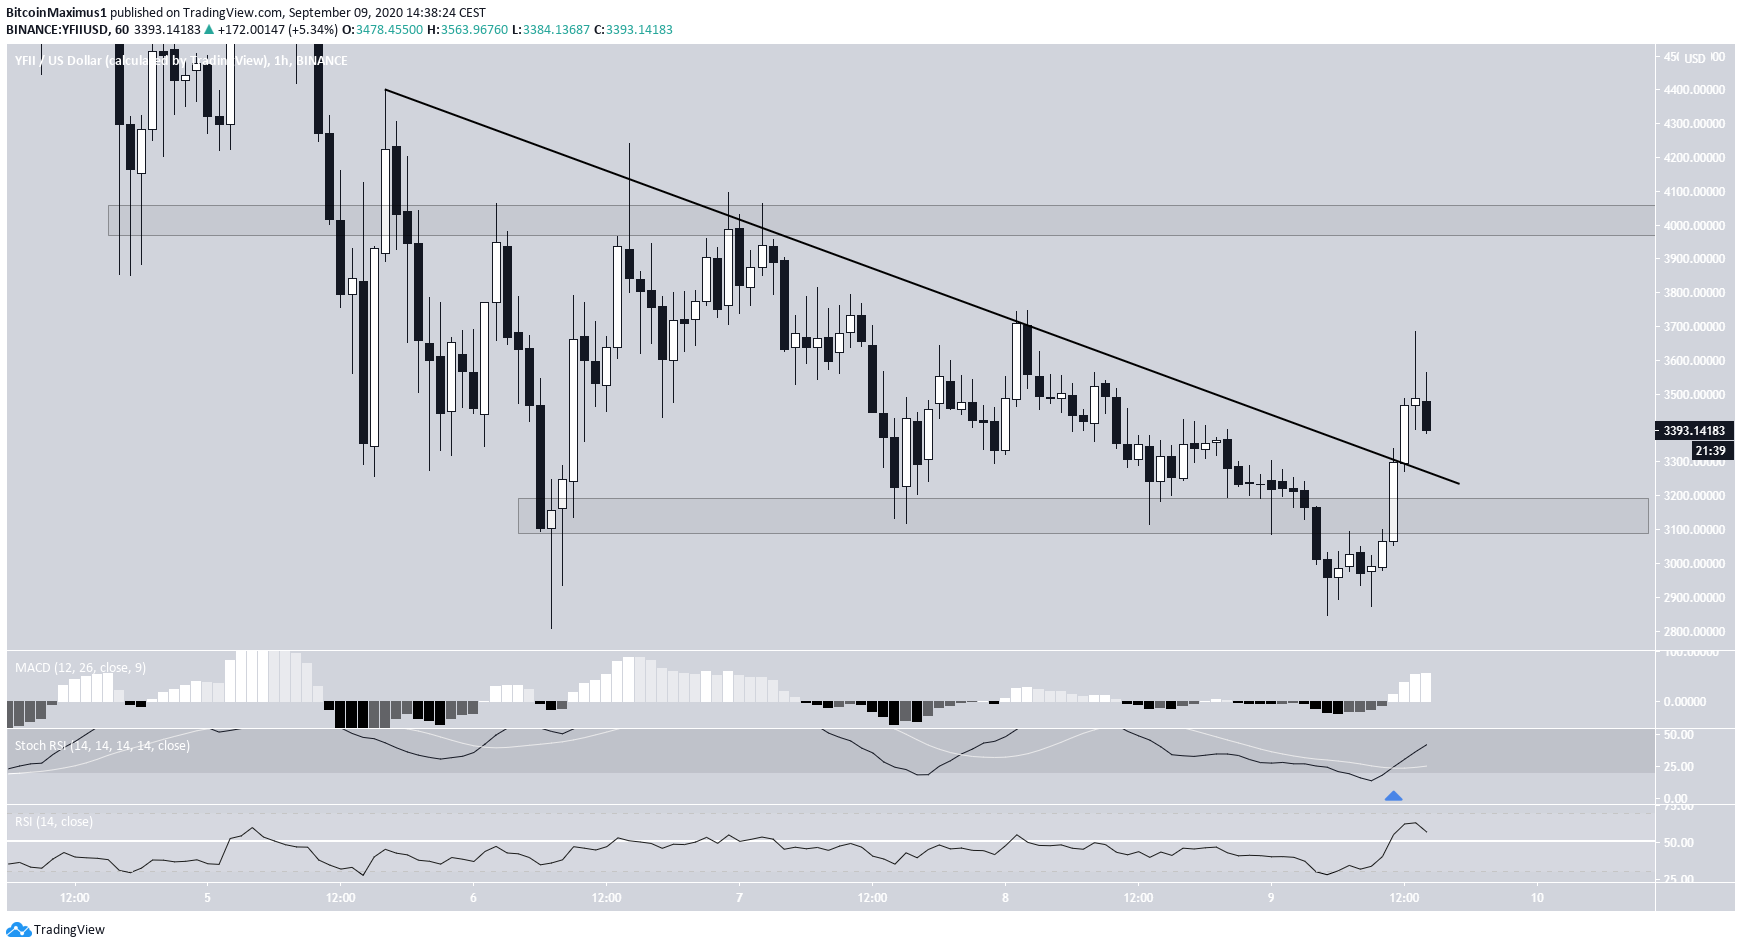
After a sharp drop, DFI.Money (YFI) has broken out from a descending resistance line and is moving towards the closest short-term resistance.
Aave (LEND)
Since the beginning of March, the LEND price was subject to a near parabolic increase that took the price to an all-time high of $0.90 on August 26. The entire rise spanned 168 days and measured a 6361% gain.
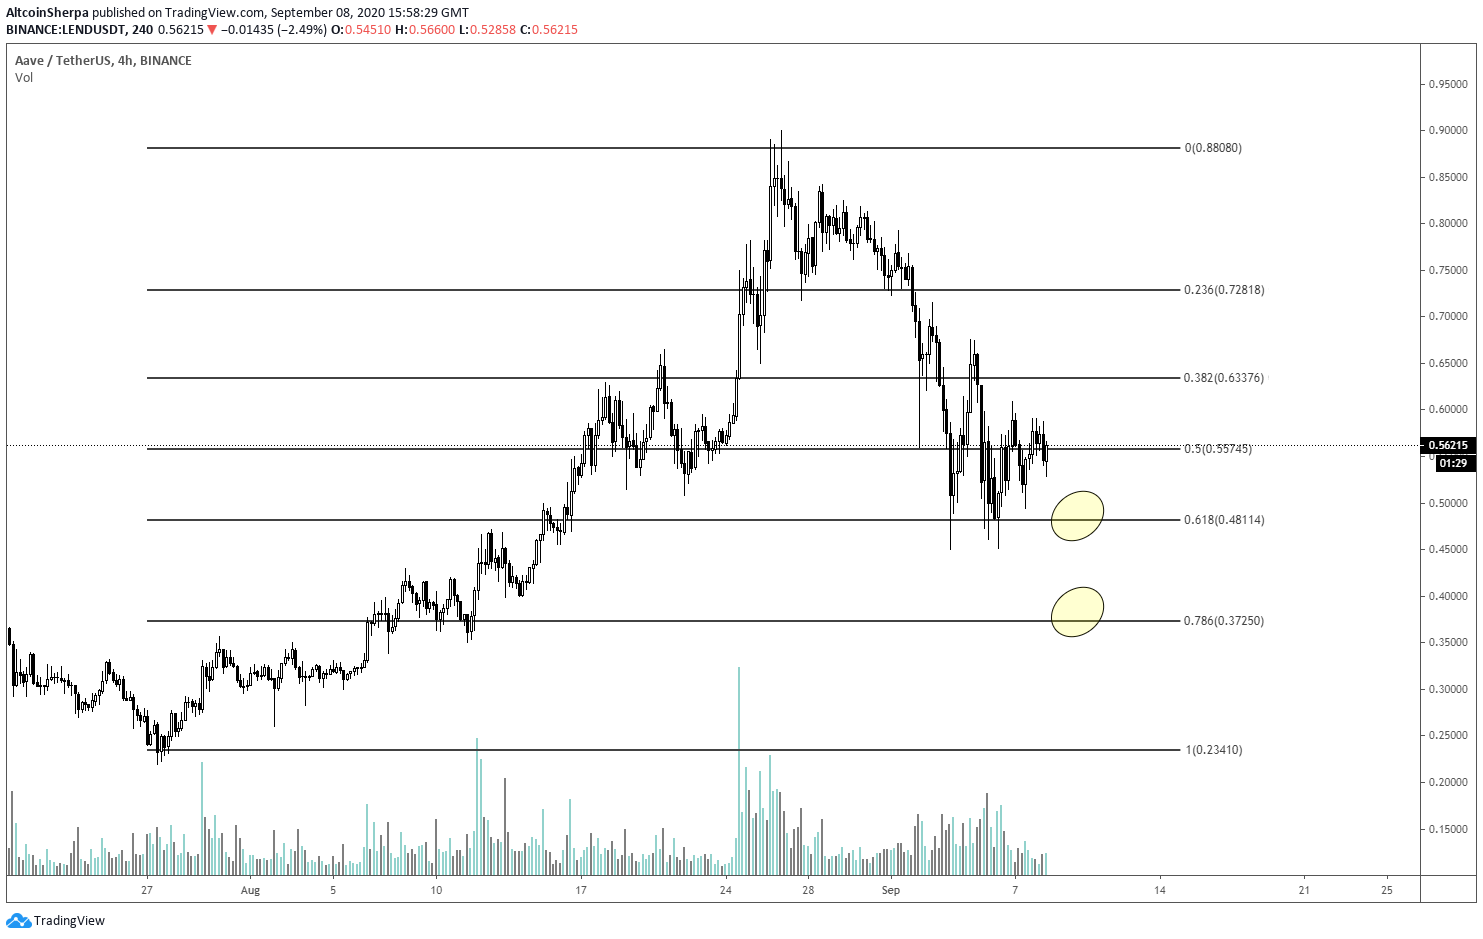
Cryptocurrency trader @altcoinsherpa stated that the LEND price is still correcting, but could soon resume its upward movement, after a drop towards $0.035.
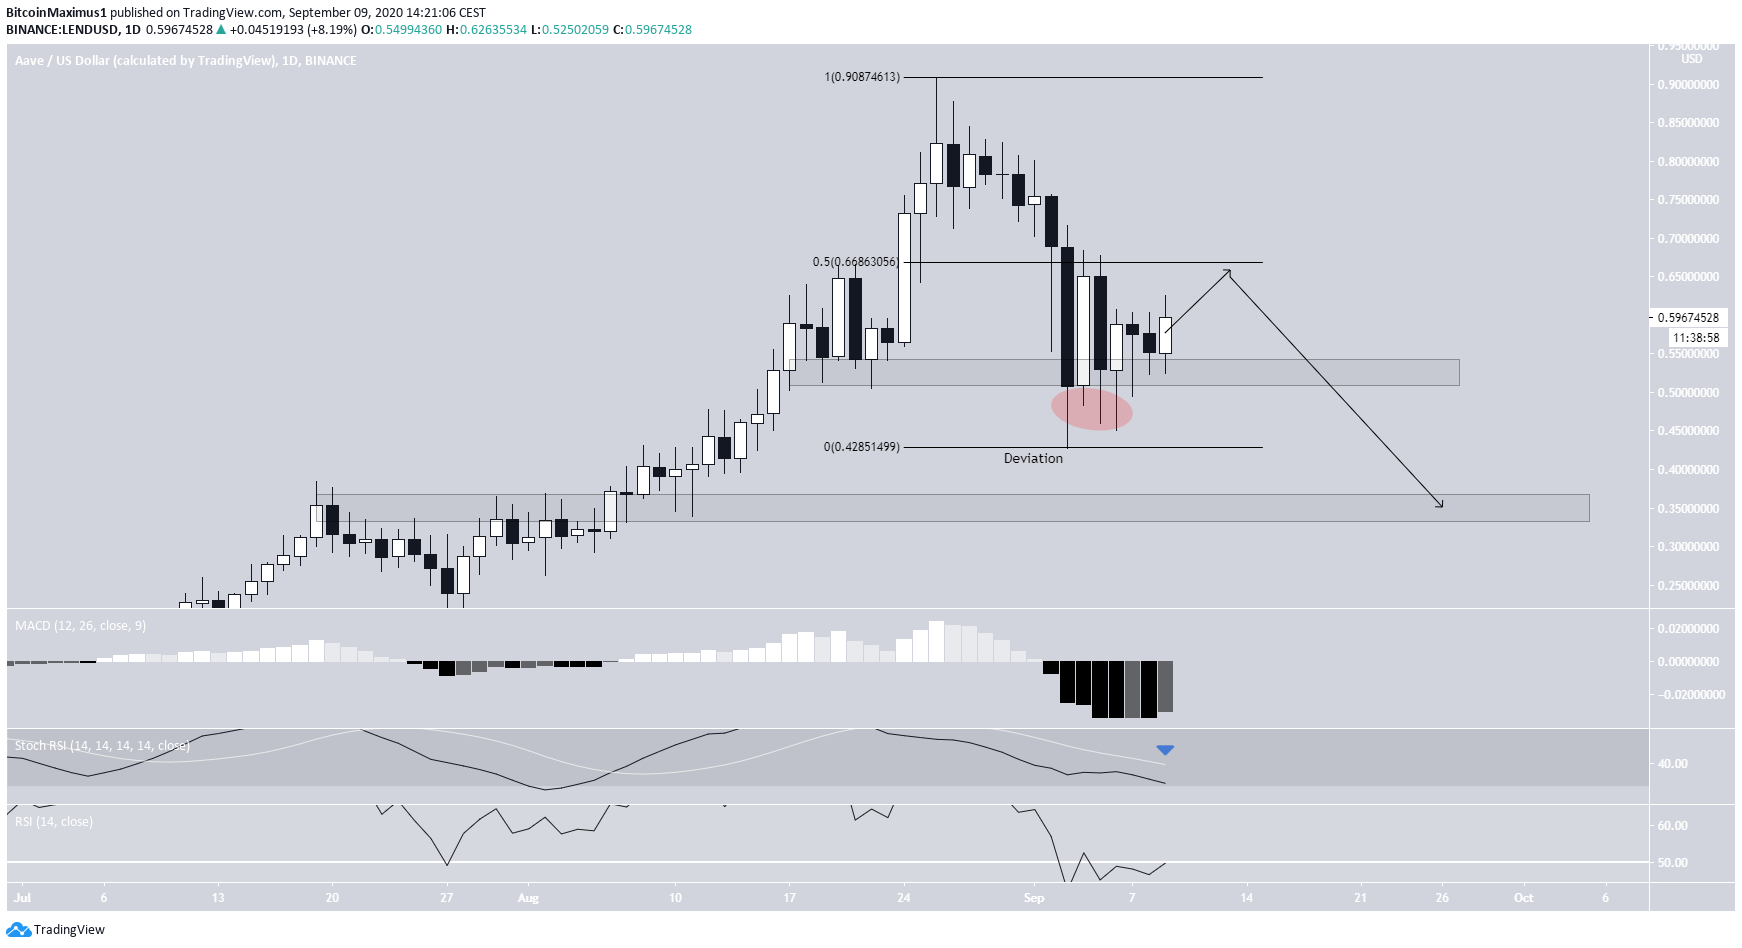
The daily chart supports this idea. While the price has deviated below the $0.5 area and reclaimed it, the upward movement has been weak. Technical indicators do not suggest an impending reversal since the Stochastic RSI is falling, and the RSI has met resistance at 50.
Therefore, after a possible rally towards the 0.5 Fib level at $0.66, a decline towards the long-term support area at $0.35 would be expected.
DFI.Money (YFI)
YFI was subject to a similarly rapid increase, reaching a high of $9,954 on September 1. The price has been falling since then, losing 65% of its value.
However, the price has successively broken out from two descending resistance lines and validated them as support afterward. This is a bullish sign that suggests the price will move upwards.
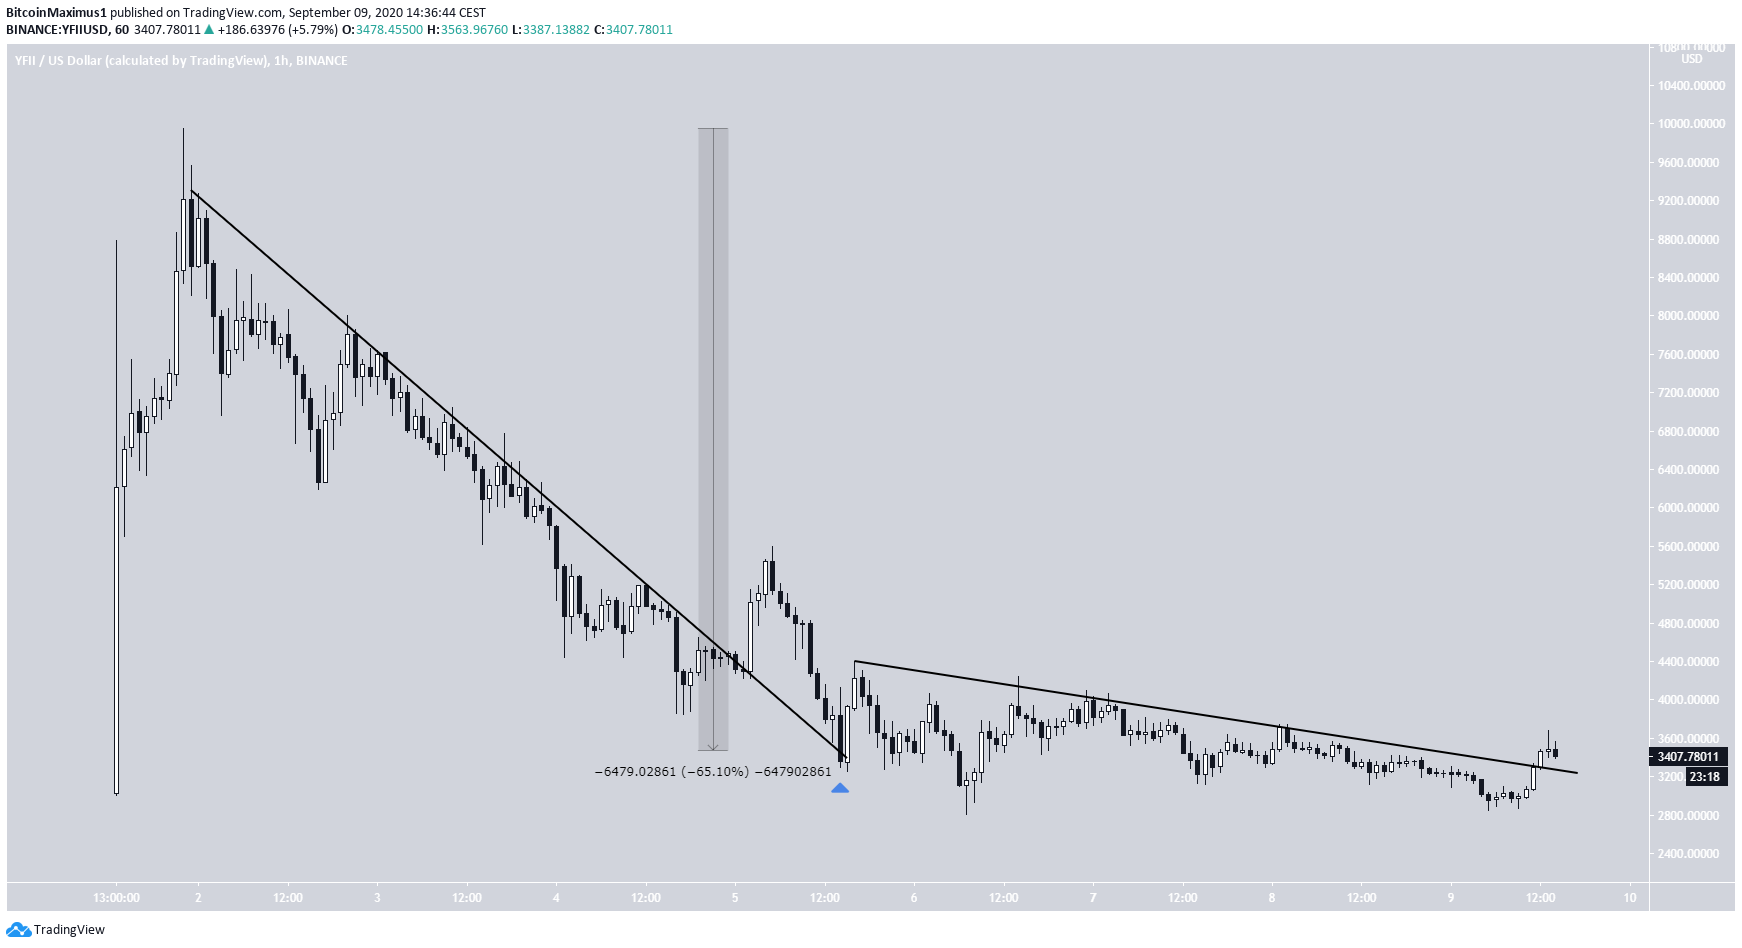
A closer look reveals that the price is trading between support and resistance at $3,100 and $4,000, respectively. A decline below the former would likely take the price to new all-time lows.
However, technical indicators are bullish. The stochastic RSI has made a bullish cross, the RSI is above 50, and the MACD is increasing.
Therefore, a move towards the resistance area at $4,000 seems more likely.