


Trust Wallet Token (TWT) is trading inside a short-term corrective pattern from which a breakdown would be the most likely scenario.
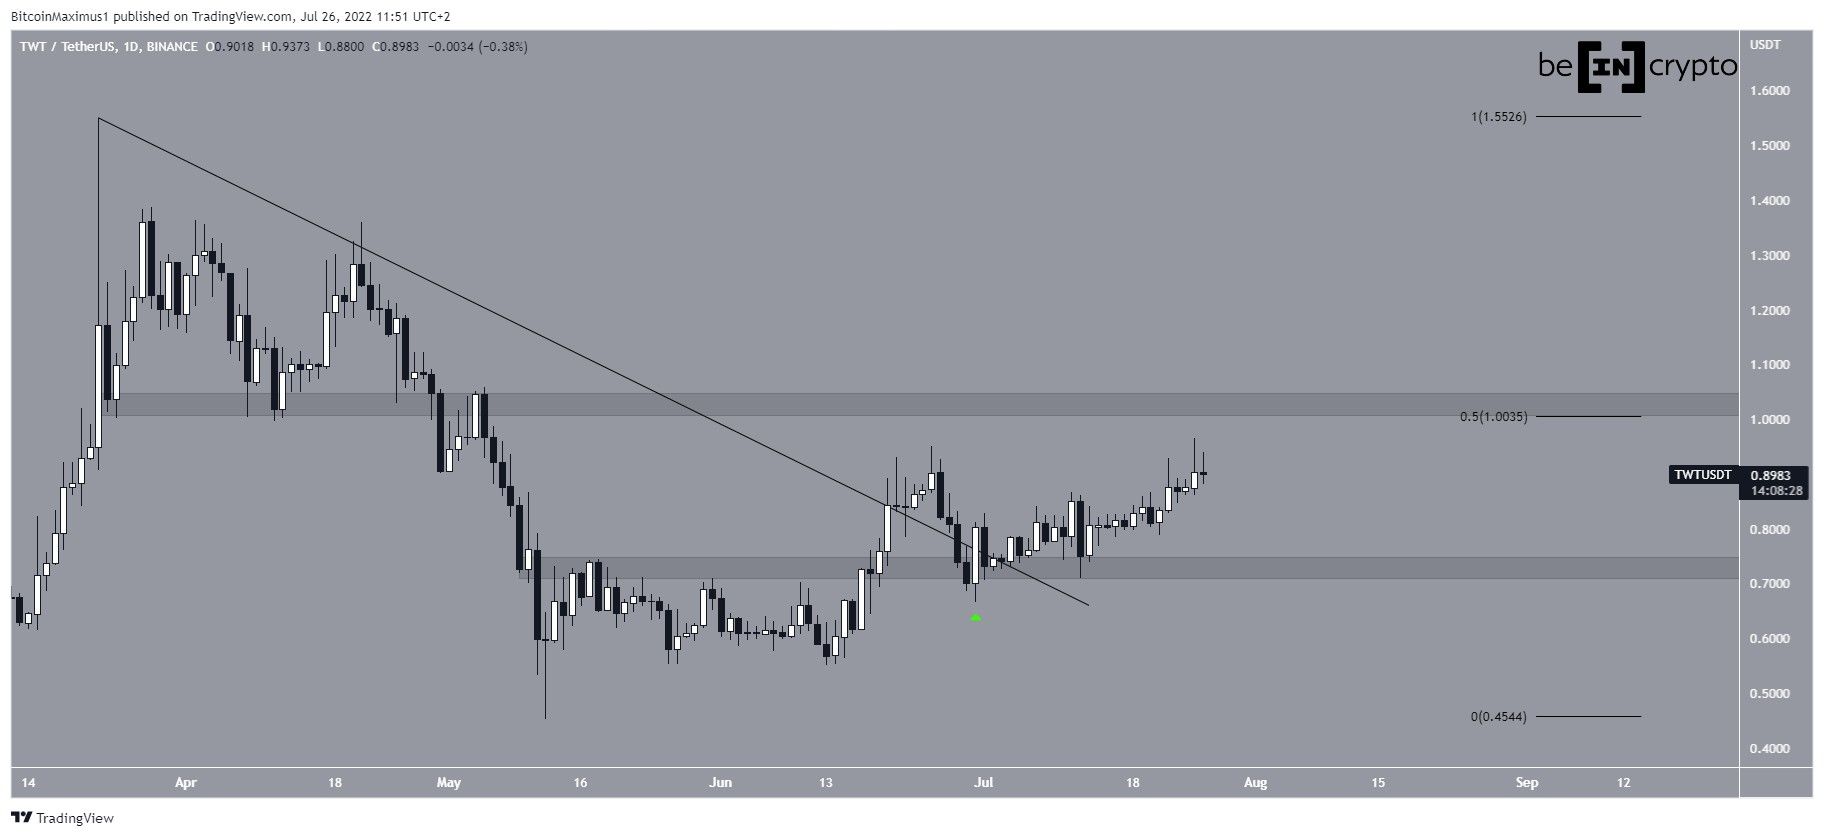
TWT has been falling underneath a descending resistance line since reaching a high of $1.55 on March 22, 2022. The downward movement led to a low of $0.45 on May 12.
The price has been moving upwards since and broke out from the line on June 21. Afterward, it returned to validate it as support (green icon) ten days later and has been moving upwards since. This second touch of the resistance line also coincided with the $0.75 horizontal support area.
If the upward movement continues, the next closest resistance area would be between $1 – $1.05, created by the 0.5 Fib retracement resistance level and a horizontal resistance area.
Potential double top
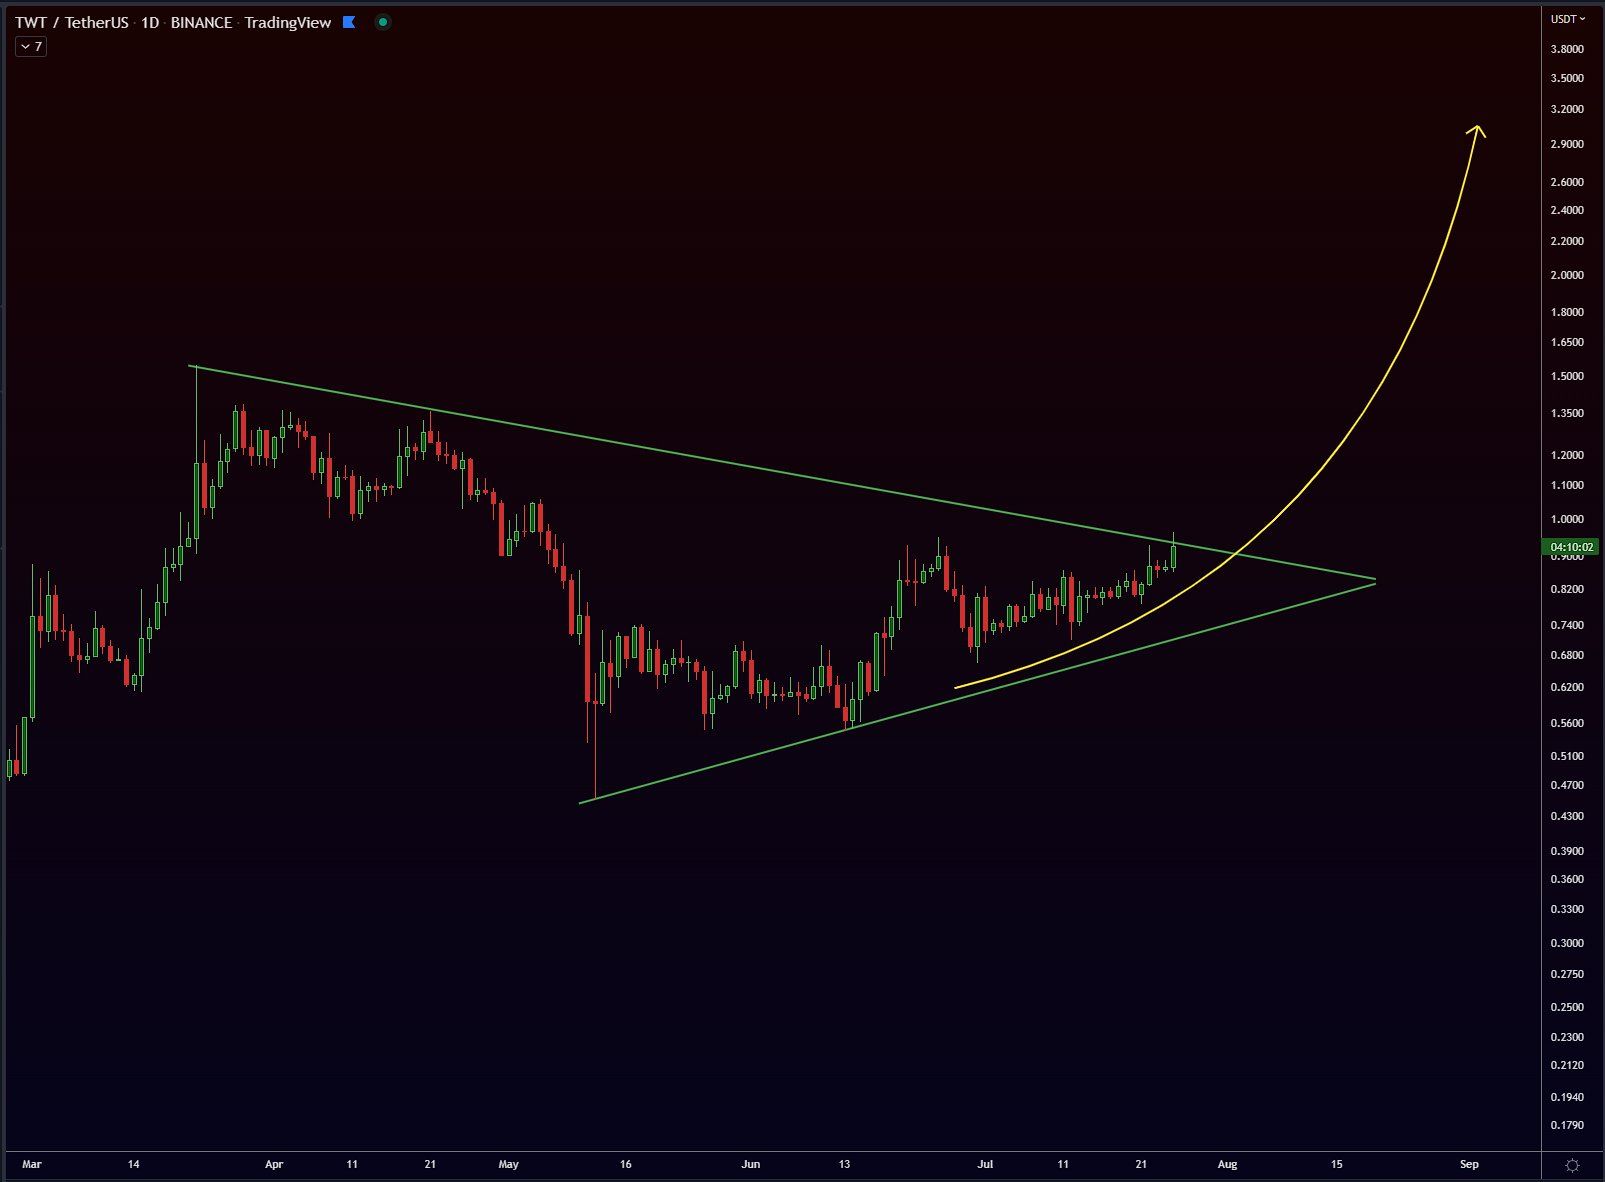
Cryptocurrency trader @easyeight08 tweeted a chart of TWT, stating that a short-term breakout is transpiring.
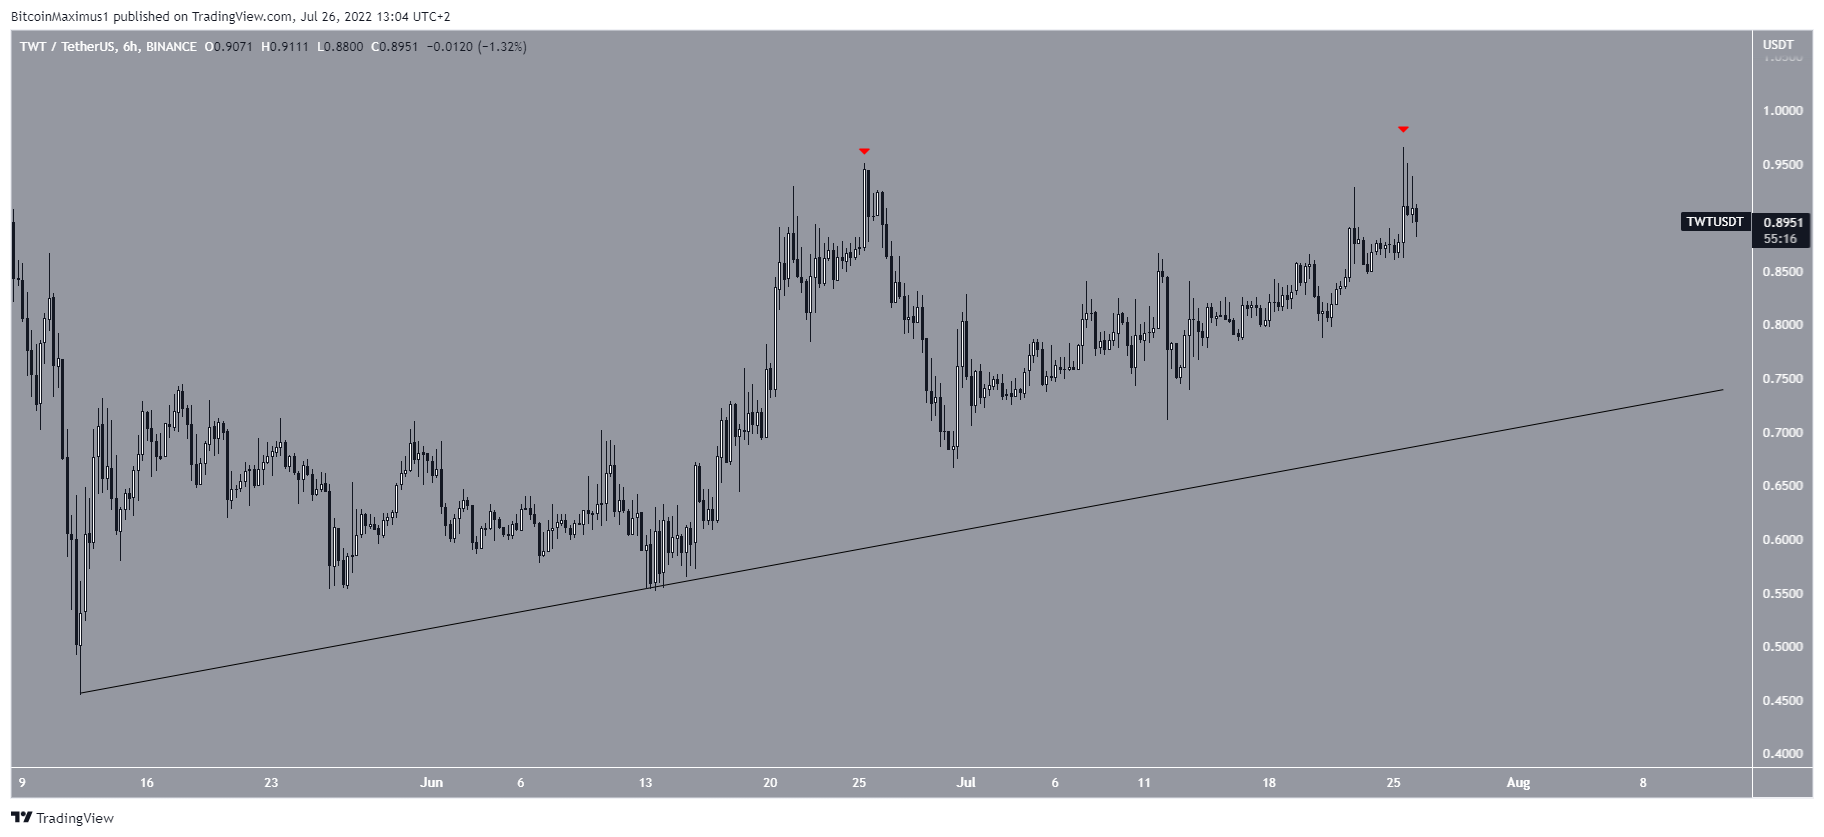
However, since the tweet, the price seems to have created a double top pattern, which is considered a bearish pattern. Furthermore, the second top was combined with a long upper wick (red icon), a sign of selling pressure.
So, it is possible that the price will decrease in the short-term.
If it does, there is a potential ascending support line close to $0.75, also aligning with the previously outlined support line.
TWT wave count analysis
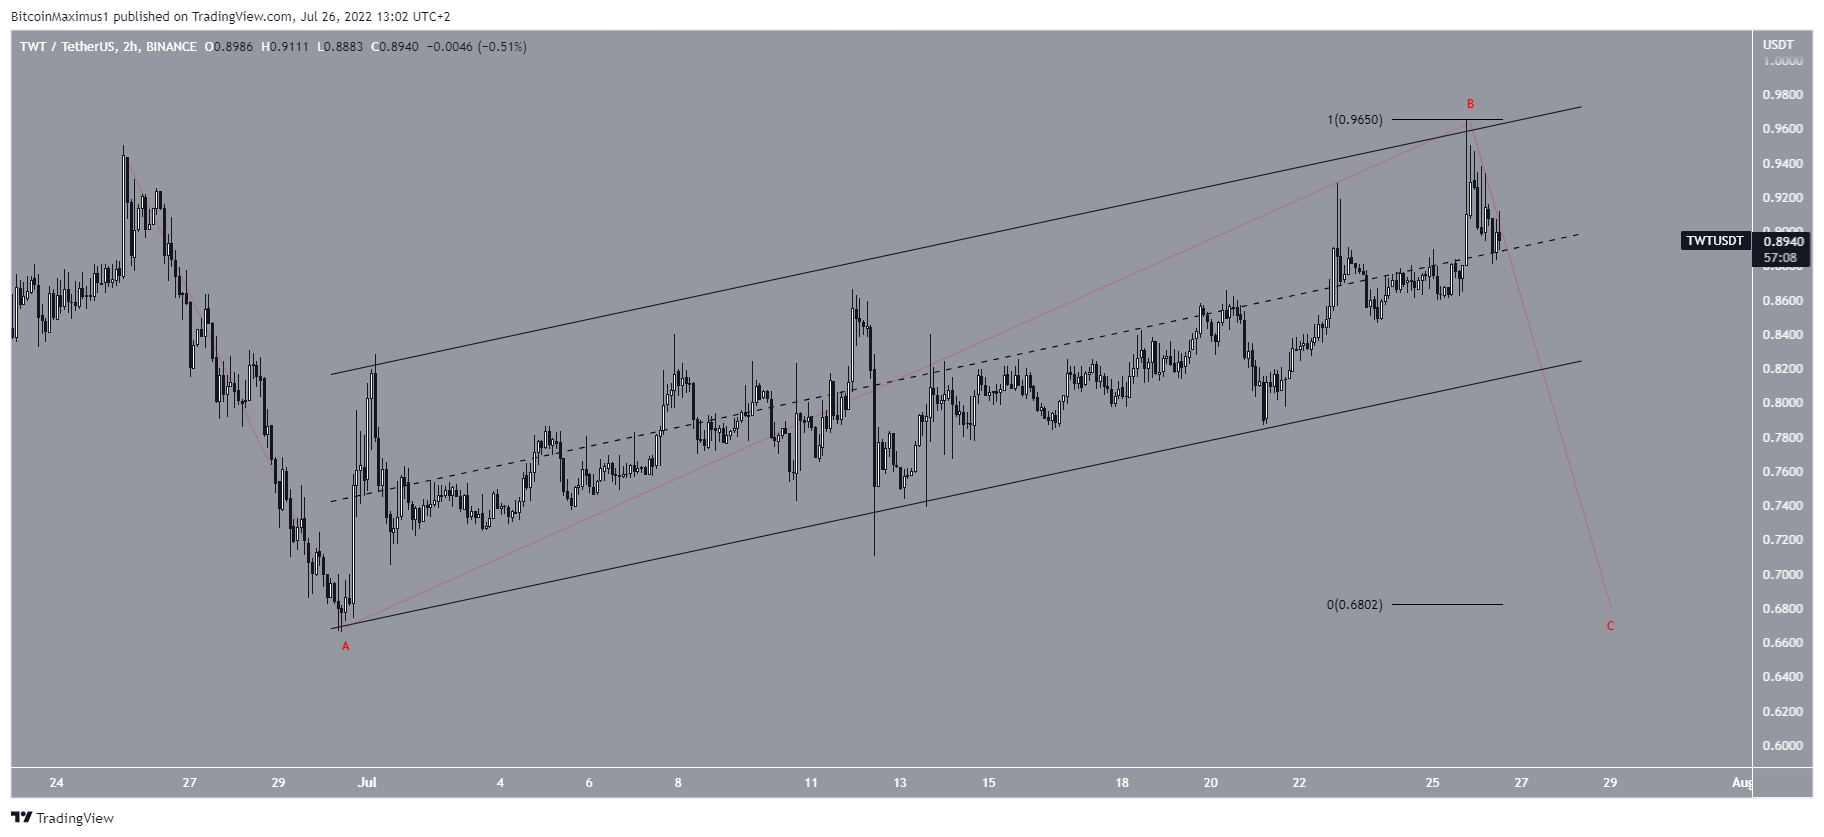
The wave count analysis also indicates that a decrease is the most likely scenario. The entire increase since the beginning of July has been contained inside an ascending parallel channel. As a result, it is likely to be a corrective movement.
So, the most likely wave count would suggest that it is wave B of an A-B-C corrective structure (red).
Giving waves A:C a 1:1 ratio would lead to a low of $0.68.
For Be[in]Crypto’s latest bitcoin (BTC) analysis, click here


