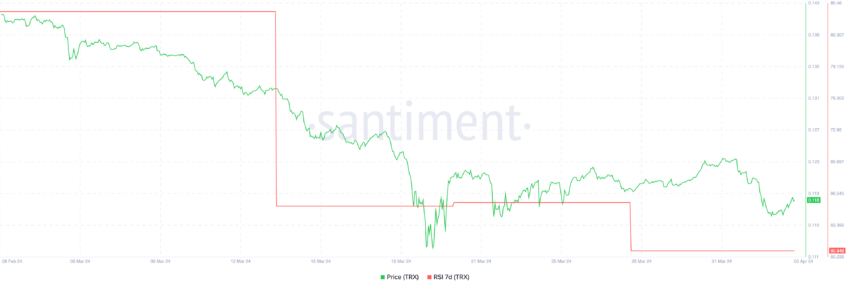
TRON’s (TRX) price dynamics indicate a move towards potentially lower volatility, highlighted by reduced trader activity in the past week.
The Relative Strength Index (RSI) has adjusted to a neutral level at 60, suggesting that TRX is entering a phase of consolidation.
TRON Eyes a Consolidation Phase
The 7-day RSI for TRX has decreased from highs of 84.6 to 60.8. This is a pivotal metric for gauging whether TRON is overbought or oversold. It currently indicates a balanced market sentiment and equilibrium between buyers and sellers, pointing to potential consolidation ahead.
This period of consolidation, marked by stable prices within a narrow range, implies a balanced market sentiment that is likely to dominate in the upcoming days.

After months of increased activity, TRX has also seen a decrease in the number of traders holding the cryptocurrency, with a decline from 7.52 million addresses on March 25 to 7.38 million by April 2. This change suggests a move towards lesser price volatility, potentially leading to a more consolidated market phase.

TRX Price Prediction: Enough Support?
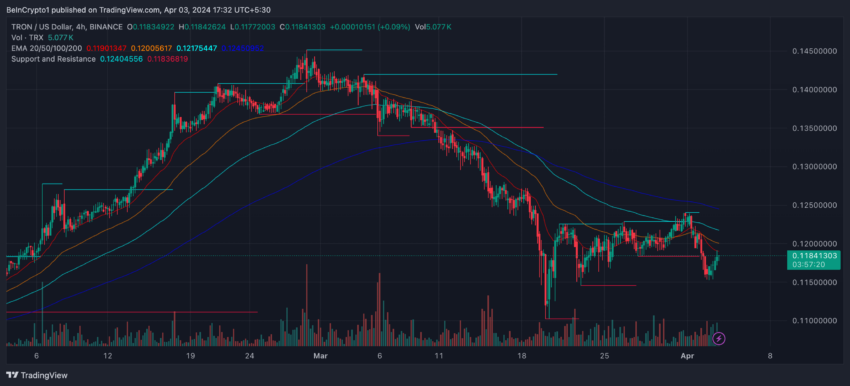
TRX recently experienced a technical pattern known as a death cross on April 2, where a short-term Exponential Moving Average (EMA) falls below a long-term EMA, often seen as a bearish signal. This event followed a 22.34% price correction after the previous death cross on March 5.
Given this scenario, TRX might enter a phase of consolidation, particularly with its RSI positioned at 60. Should the $0.1145 support level falter, TRX could decline towards $0.097, marking a low since December 2023.
Read More: TRON (TRX) Price Prediction 2024/2025/2030

Conversely, bullish market sentiment could propel TRX towards testing the $0.14 resistance level, potentially initiating an uptrend.
Disclaimer
In line with the Trust Project guidelines, this price analysis article is for informational purposes only and should not be considered financial or investment advice. BeInCrypto is committed to accurate, unbiased reporting, but market conditions are subject to change without notice. Always conduct your own research and consult with a professional before making any financial decisions. Please note that our Terms and Conditions, Privacy Policy, and Disclaimers have been updated.


