See More

Tron (TRX) Drops After Reaching a Top while Binance Coin (BNB) Keeps Rising. How High Will BNB Go?

3 mins
Updated by Alexander Fred
Join our Trading Community on Telegram

Tron (TRX) and Binance Coin (BNB) both initiated upward moves on May 10. However, TRX reached a high on May 16 and began to decrease. BNB, on the other hand, has not yet reached a top.

Will the gains continue for BNB or will TRX take the lead?

To answer this question, we continue our analysis of TRX and BNB by looking at price fluctuations, trends, indicators, and possible trade setups.

binance

We begin by looking at the long-term price outlook for TRX. Then, we incorporate the RSI and MACD to predict future short-term price fluctuations. Subsequently, we do the same for BNB and summarize our findings in the conclusion. 

If you need to catch up, you can read our May 16 analysis of TRX and BNB HERE!.

Tron (TRX) Drops into a Symmetrical Triangle

On May 10, the price of TRX/USD reached a low of $0.021. A gradual increase followed. It intensified on May 14. TRX subsequently reached an apparent top of $0.033 on May 16.

It has been decreasing inside the symmetrical triangle outlined below: TRX Outlook While trading inside the triangle, the price has increased by 23.4%. It is currently trading in the middle of the pattern. The resistance and support lines are soon to converge which will force a breakout or breakdown.

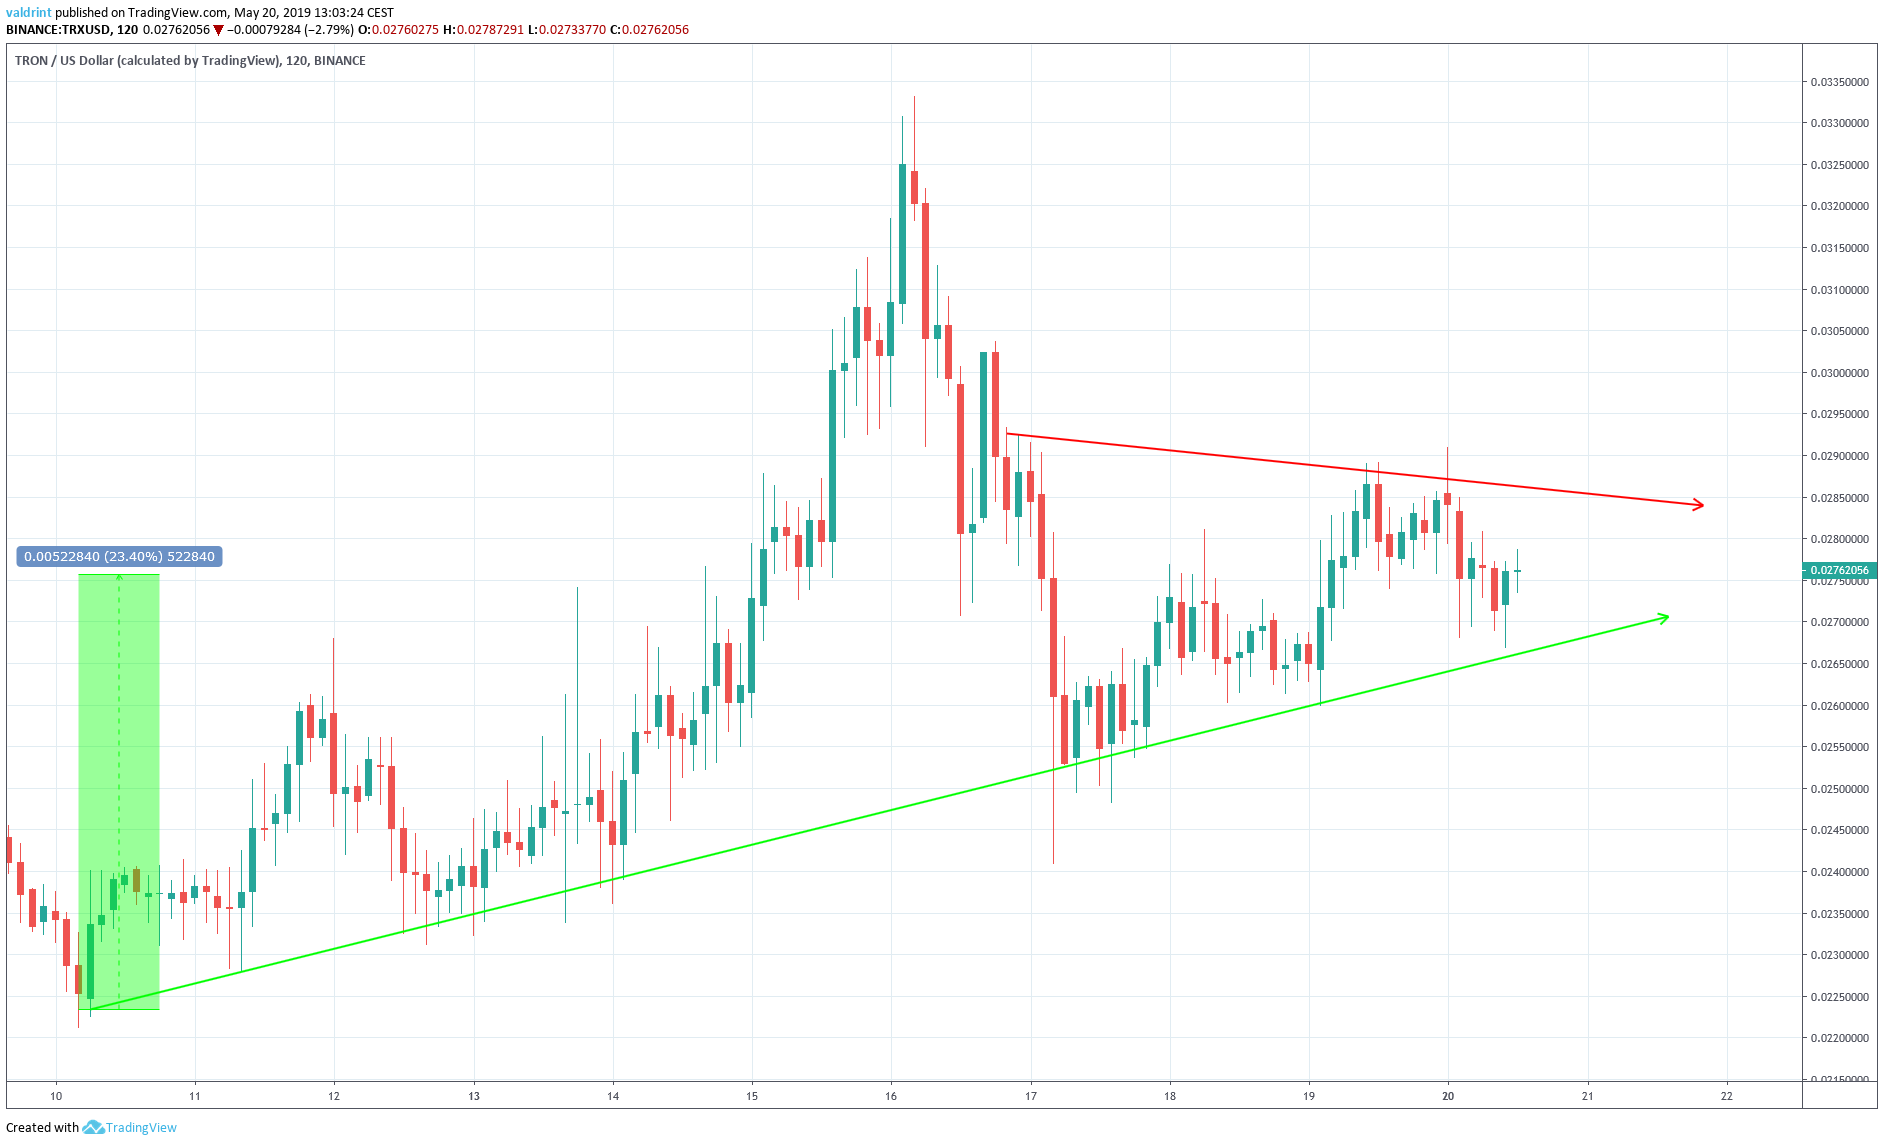
To determine which is more likely, the price of TRX is analyzed at daily intervals alongside the RSI and the MACD below:

TRX Bearish Divergence We can see that the price has been trading inside a horizontal channel since the beginning of 2018.

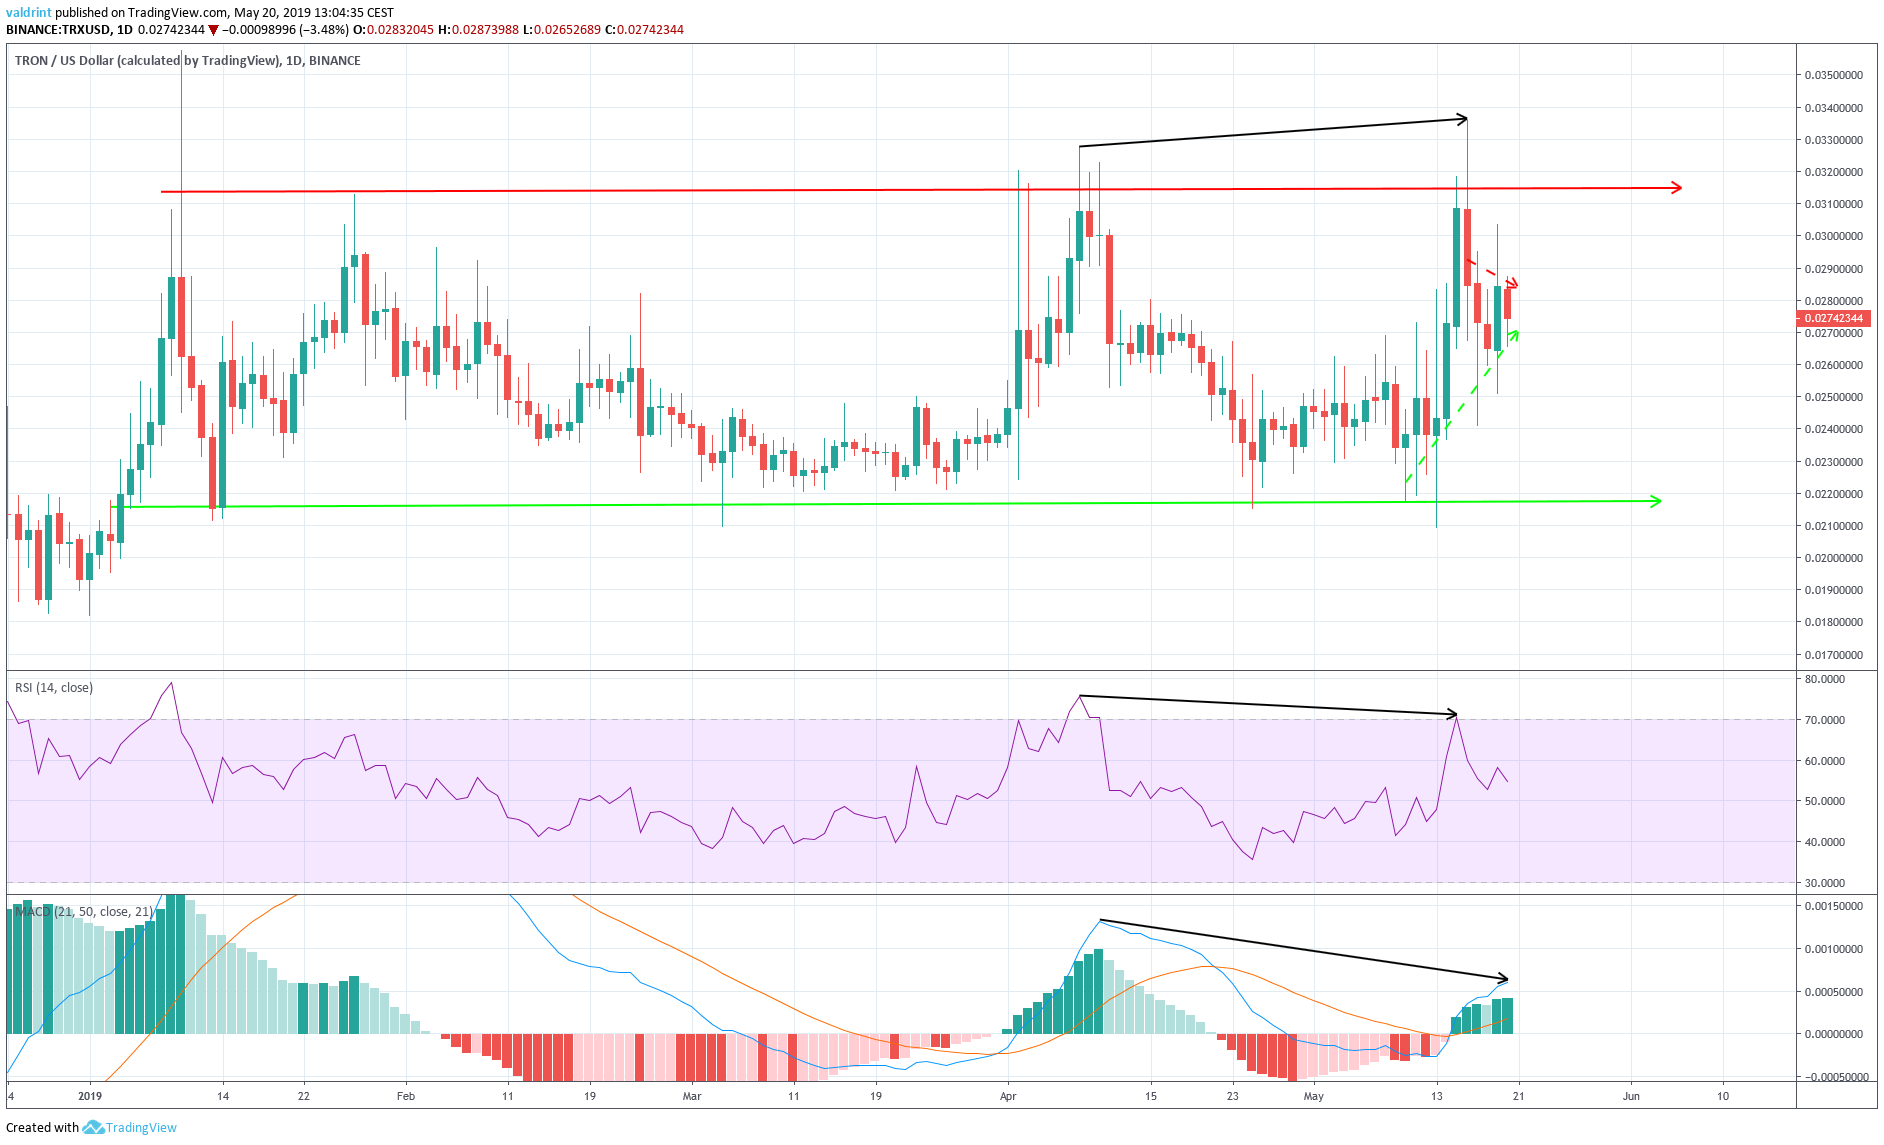
On Apr 8, the price reached a high of $0.032 A gradual decrease was followed by an increase and the price reached a higher high of $0.033 on May 16.

Similarly, the RSI and the MACD reached the first high on Apr 8. However, they have continued to generate lower values since. This bearish divergence suggests that price decreases are more likely than increases. Thus, we believe a breakdown is more likely than a breakout.

If the price does breakdown from the short-term channel, it should drop toward the support line of the horizontal channel near $0.022. At the current moment, it is unclear if TRX will reach this level before rebounding to the resistance line.

Binance Coin (BNB) Going Up!

On May 10, the price of BNB reached a low of $18.21. A gradual increase began with a resistance line emerging on May 15.

After a small drop, the price rebounded and validated the support the next day. A swift decrease preceded a gradual increase which brought BNB to a high of $30.4 on May 19.

Currently, BNB is trading inside the ascending wedge outlined below: TRX Ascending WedgeSince the formation of the support line, the price has increased by 53%; however, the ascending wedge is a bearish pattern. This suggests that despite gains, we may see a breakdown in the near future. This reversal could mark significant or rapid price losses.

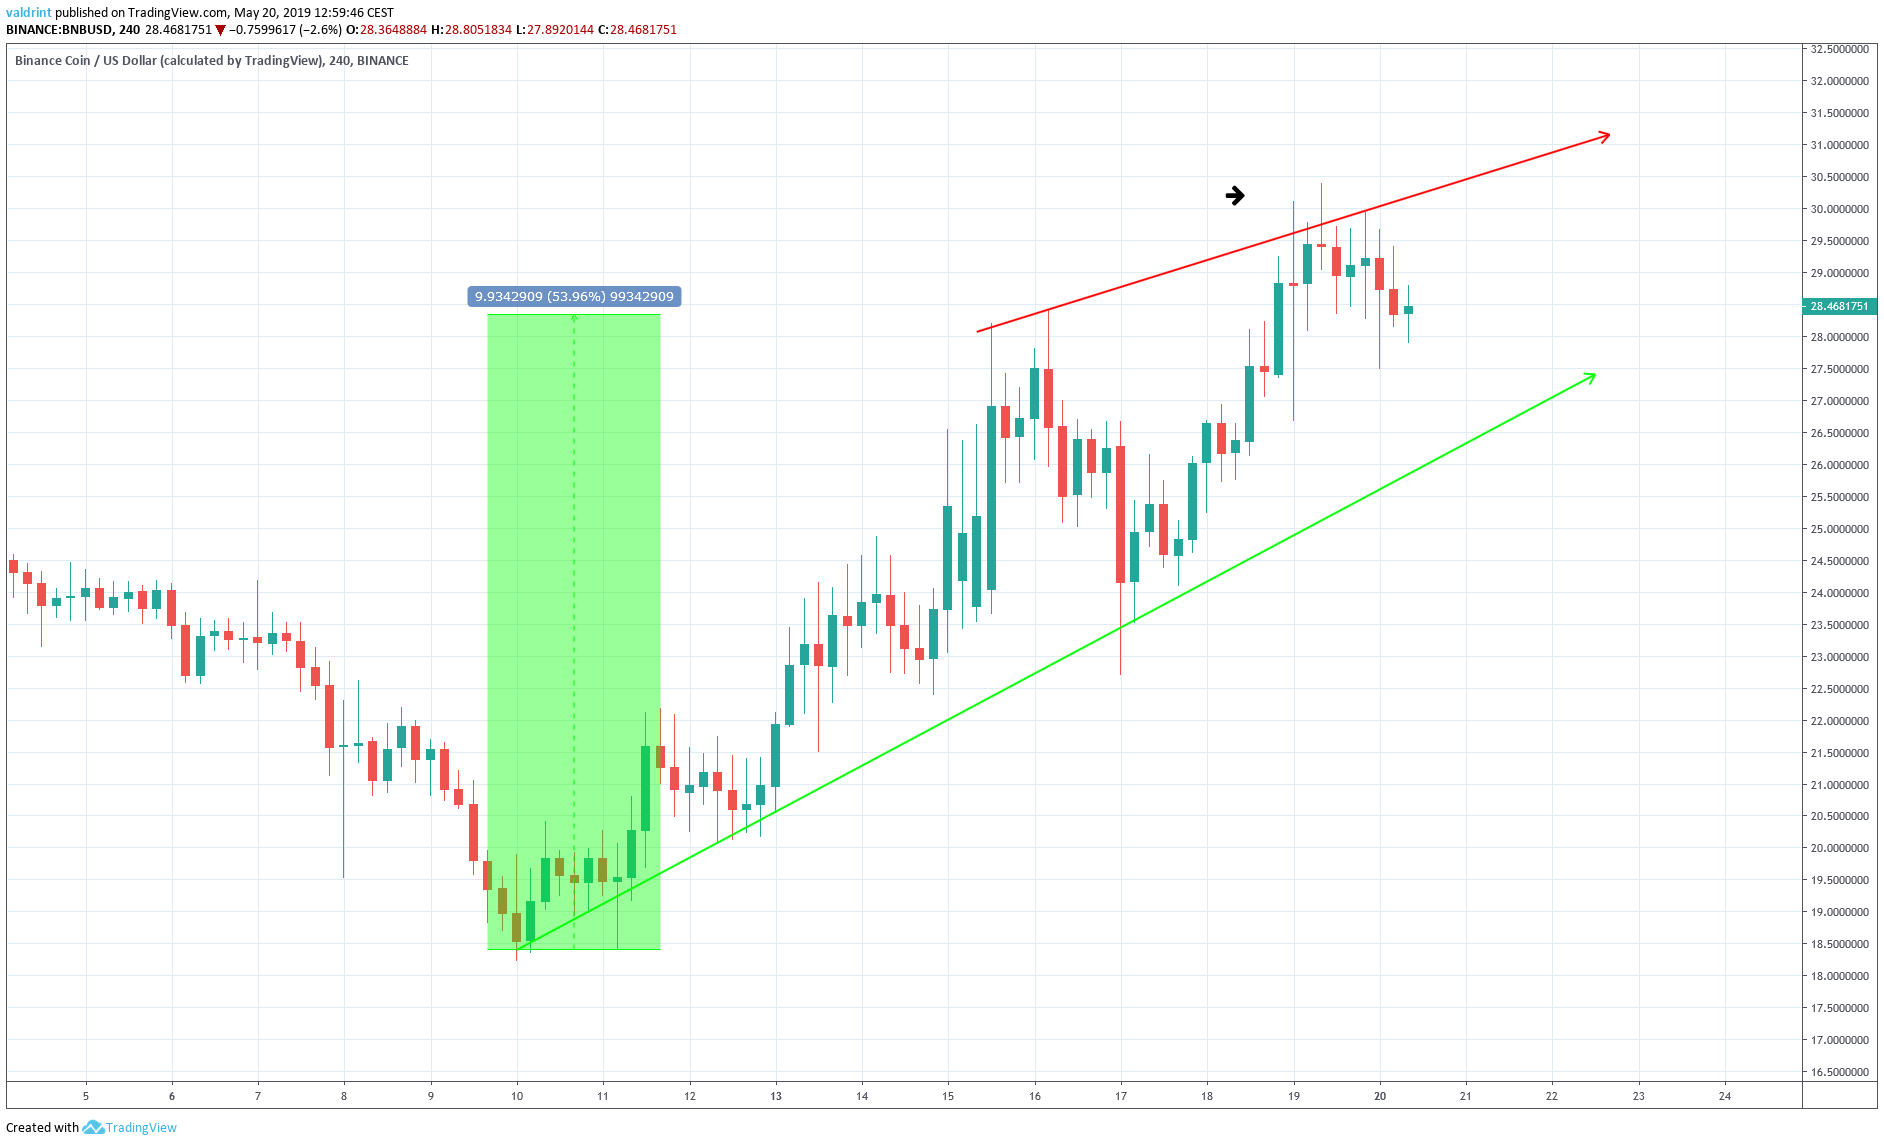
Furthermore, candlesticks near $30 have been characterized by long upper wicks, indicating that there is selling pressure in the market.

In order to predict whether a breakdown is likely BNB is analyzed at four-hour intervals alongside the RSI and the MACD below:

BNB Divergence

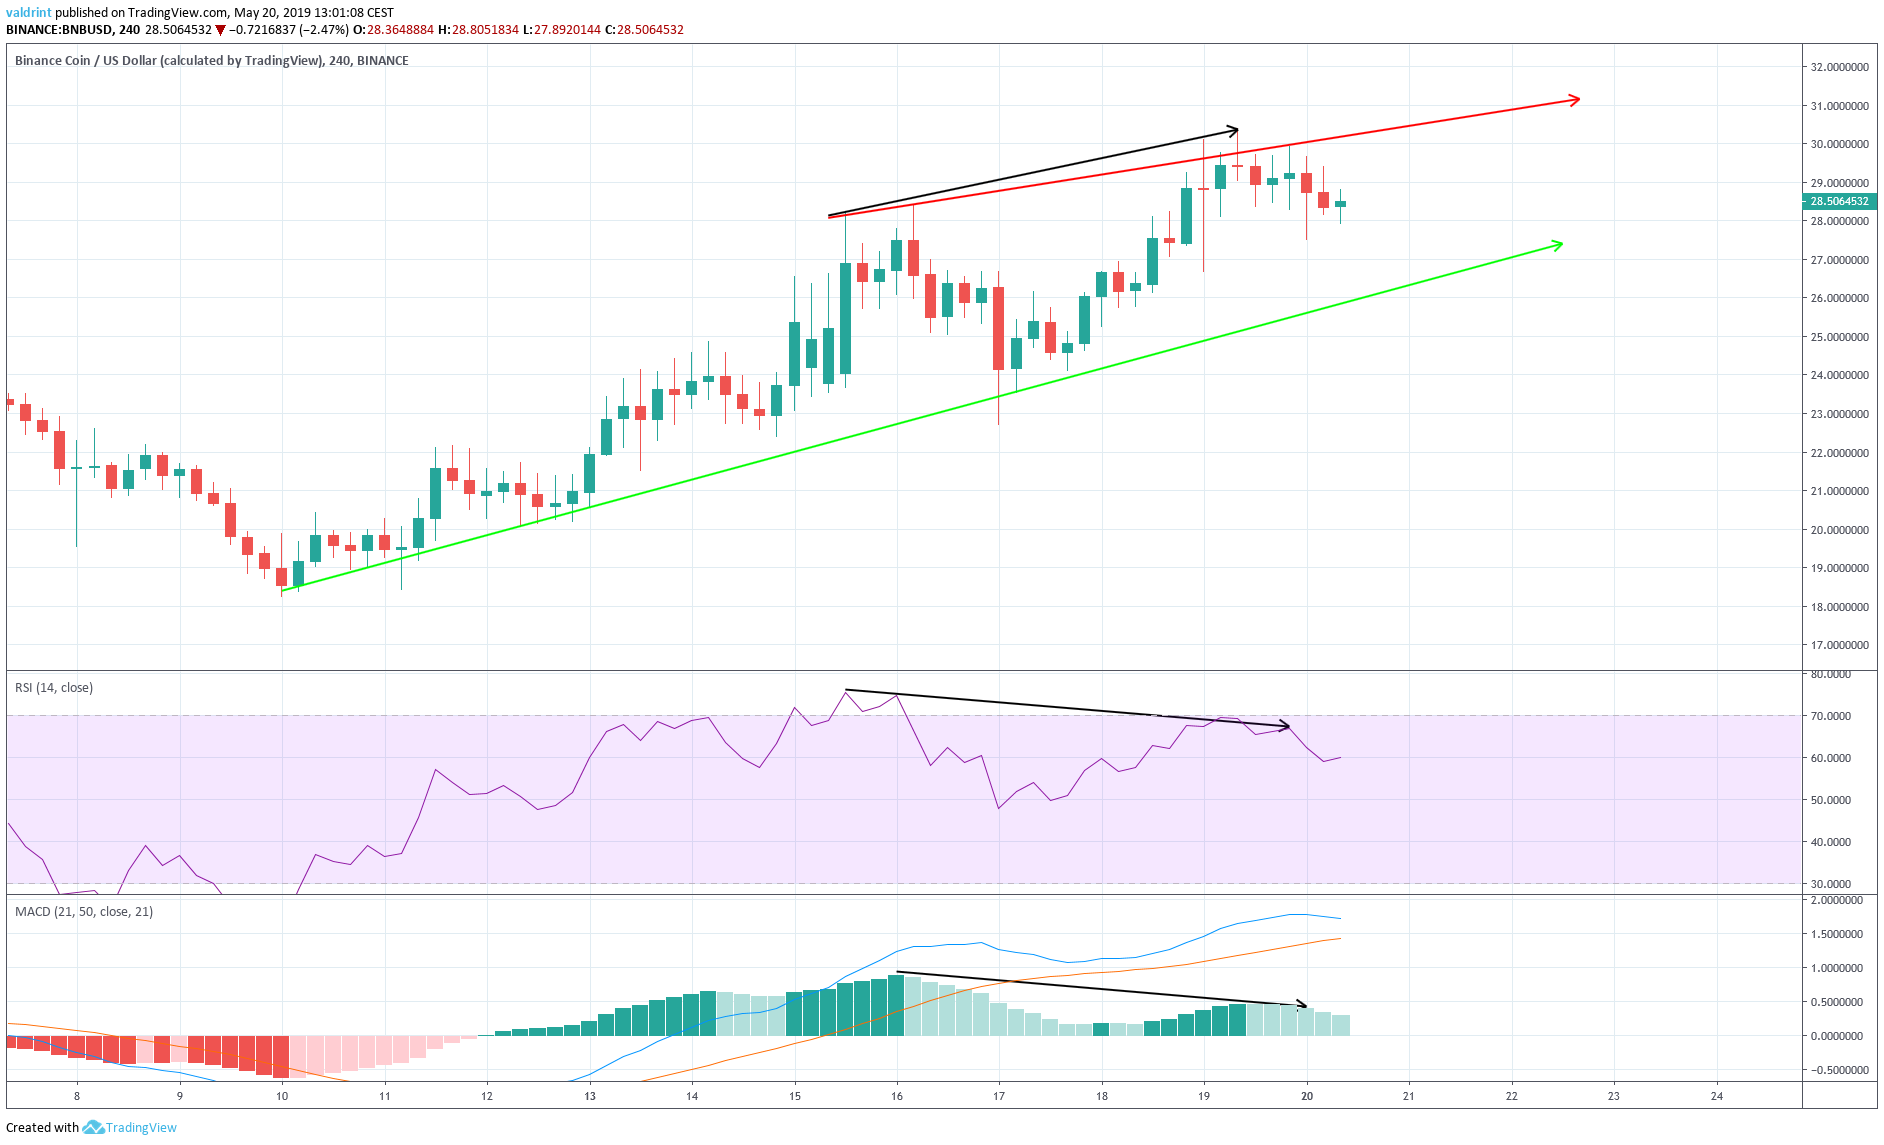
On May 15, the price reached a high of $28.21. Higher highs followed. On the contrary, the RSI and ]MACD generated lower values after their May 15 highs.

As with TRX, BNB is experiencing bearish divergence. Based on these indicators, we believe that the price will decrease to the support line of the wedge and eventually break down.

Conclusion

TRX and BNB are trading in neutral and bearish trading patterns respectively. They are both close to the resistance lines of their respective patterns.

Both of them have created bearish divergence in the RSI and the MACD. Furthermore, this divergence is present in the long-term for TRX. Similarly, Bitcoin and many altcoins including Ethereum and Stellar lumens have also recently generated bearish divergence.

Therefore, we believe that both BNB and TRX will see price decreases over the next few days. However, since BNB is trading in a bearish pattern, we believe it is more likely to break down than TRX. 

A summary of our findings is presented in the table below:
  TRX BNB Winner
Trading Pattern Symmetrical Triangle Ascending Wedge TRX
Technical Indicators Long-Term Bearish Divergence In The RSI And The MACD  Bearish Divergence in the RSI and the MACD Tie

Do you think the price of TRX will drop towards the support line? Will BNB breakdown from the wedge?

Disclaimer: This article is not trading advice and should not be construed as such. Always consult a trained financial professional before investing in cryptocurrencies, as the market is particularly volatile.

Top crypto projects in the US | April 2024

Trusted

Disclaimer

In line with the Trust Project guidelines, this price analysis article is for informational purposes only and should not be considered financial or investment advice. BeInCrypto is committed to accurate, unbiased reporting, but market conditions are subject to change without notice. Always conduct your own research and consult with a professional before making any financial decisions. Please note that our Terms and ConditionsPrivacy Policy, and Disclaimers have been updated.

Valdrin-Tahiri.jpg
Valdrin Tahiri
Valdrin discovered cryptocurrencies while he was getting his MSc in Financial Markets from the Barcelona School of Economics. Shortly after graduating, he began writing for several different cryptocurrency related websites as a freelancer before eventually taking on the role of BeInCrypto's Senior Analyst. (I do not have a discord and will not contact you first there. Beware of scammers)
READ FULL BIO
Sponsored
Sponsored