

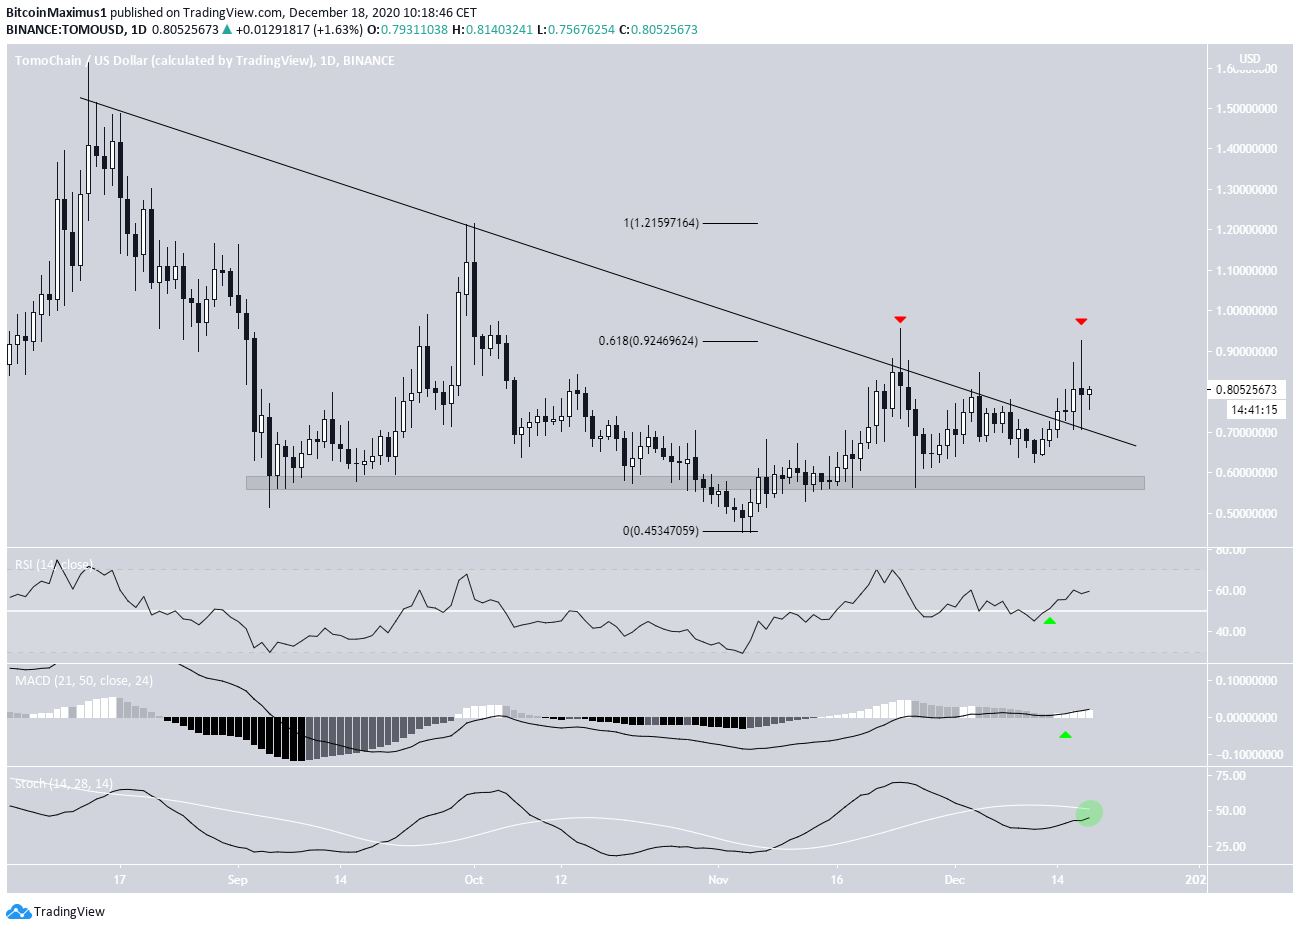
The Tomochain (TOMO) price has broken out from a long-term descending resistance line but has failed to sustain its higher prices.
While TOMO is expected to continue increasing, a retracement could occur prior to the resumption of the upward move.
TOMO Breakout Doesn’t Last Long
TOMO had been following a descending resistance line since Aug. 13 and made four unsuccessful attempts at breaking out. On Dec. 14, TOMO was finally successful in breaking out above this line and proceeded to reach a high of $0.926 a few days later.
However, the higher prices could not be sustained and TOMO created a long upper wick before decreasing. The wick re-validated the $0.925 area as resistance. This price is also the 0.618 Fib retracement level of the prior decrease.
A breakout above the $0.925 resistance would likely trigger a sharp increase towards $1.21. Conversely, the closest support area is found at $0.58.
Technical indicators in the daily time-frame are bullish, supporting the continuation of the upward move. A bullish cross in the Stochastic oscillator would likely confirm that the trend is bullish.
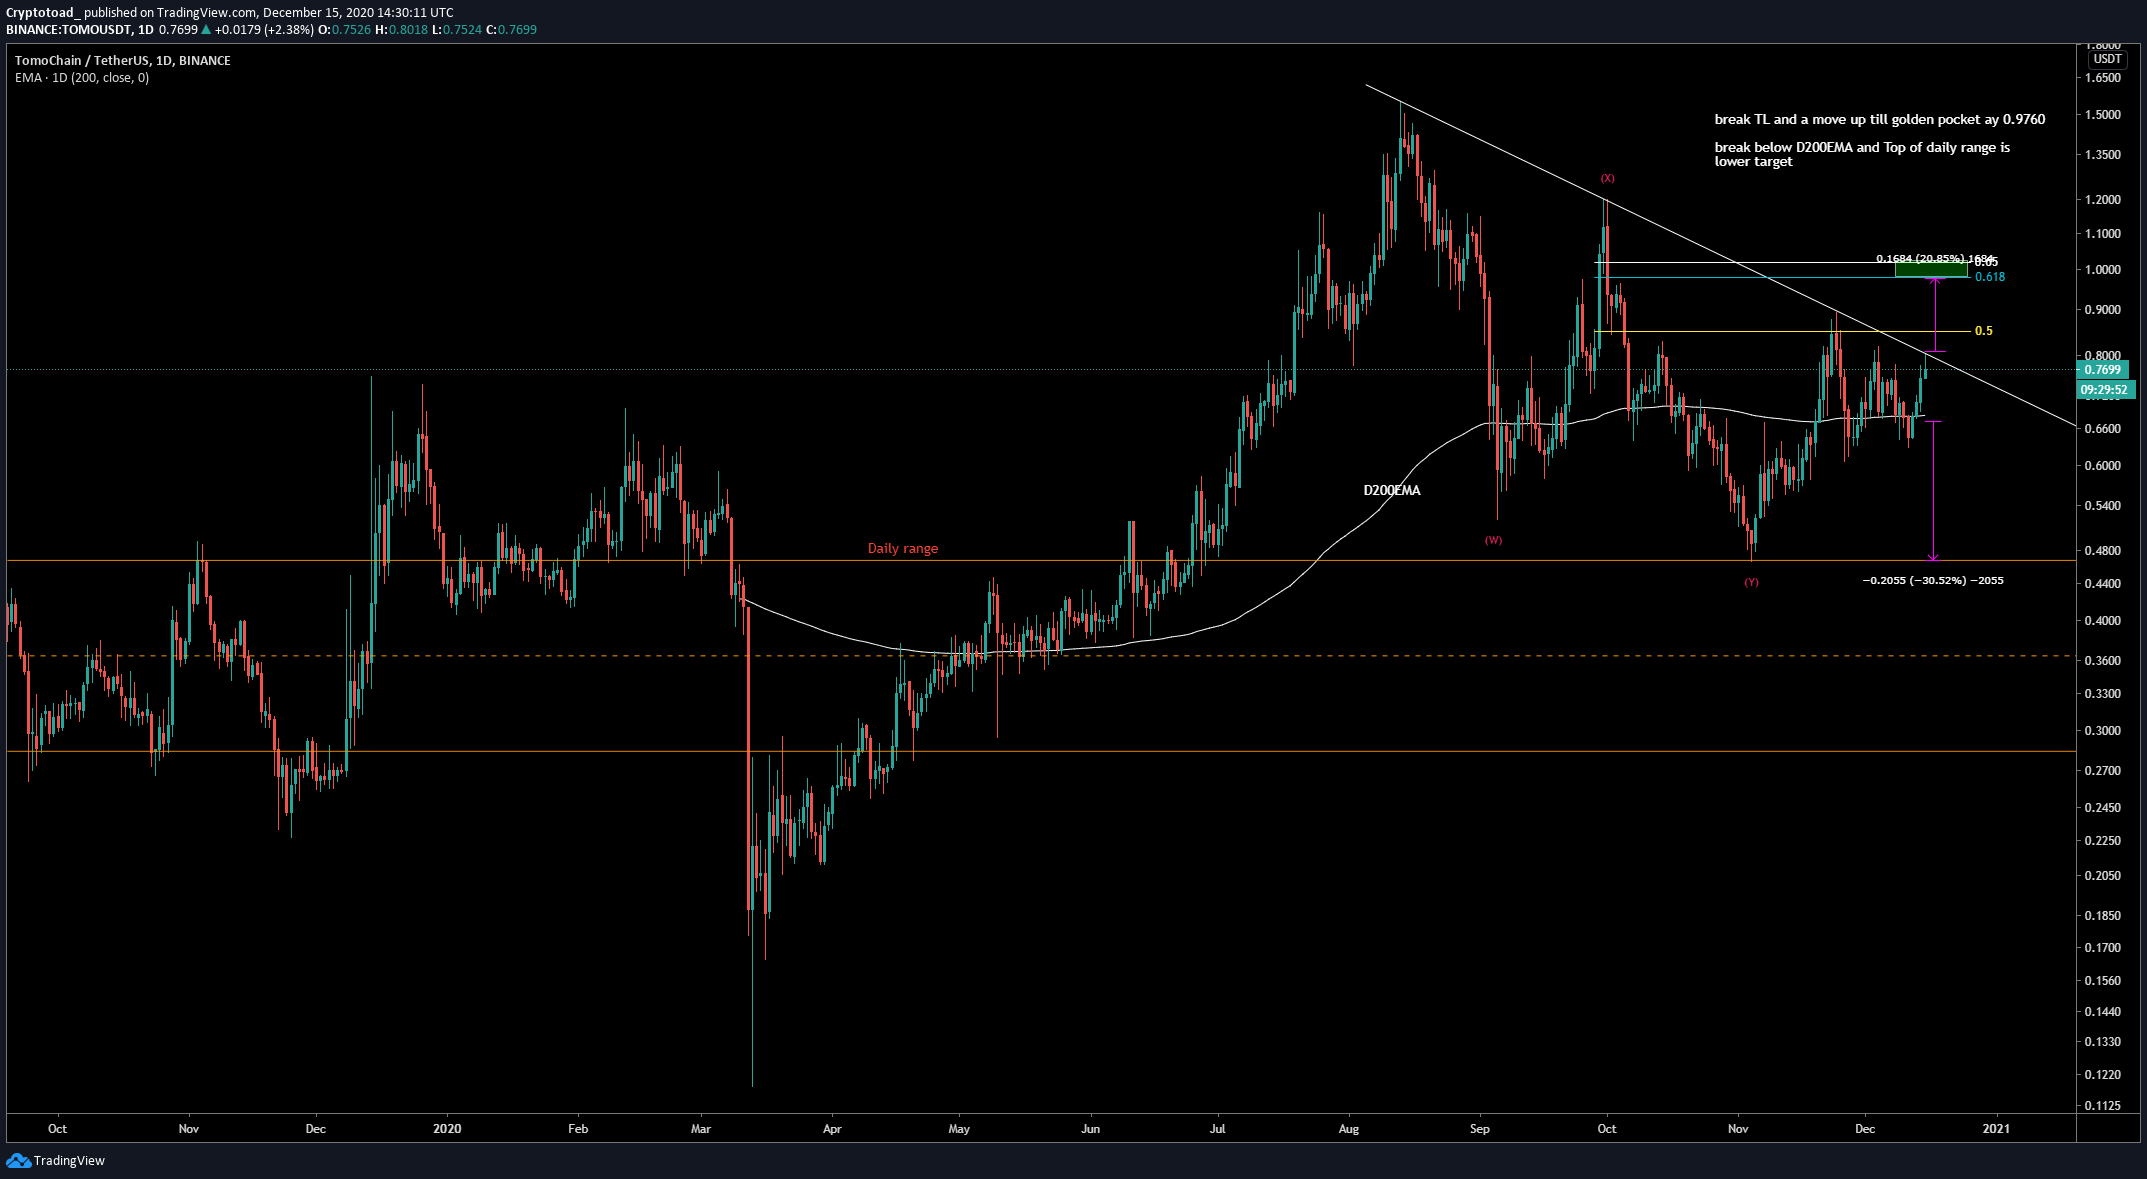
Cryptocurrency trader @mesawine1 outlined a TOMO chart, stating that a breakout above the current descending resistance line would likely take the price to $1.
Since the tweet, TOMO has broken out from the line and reached a high of $0.926 before decreasing towards $0.80, where it is currently trading.
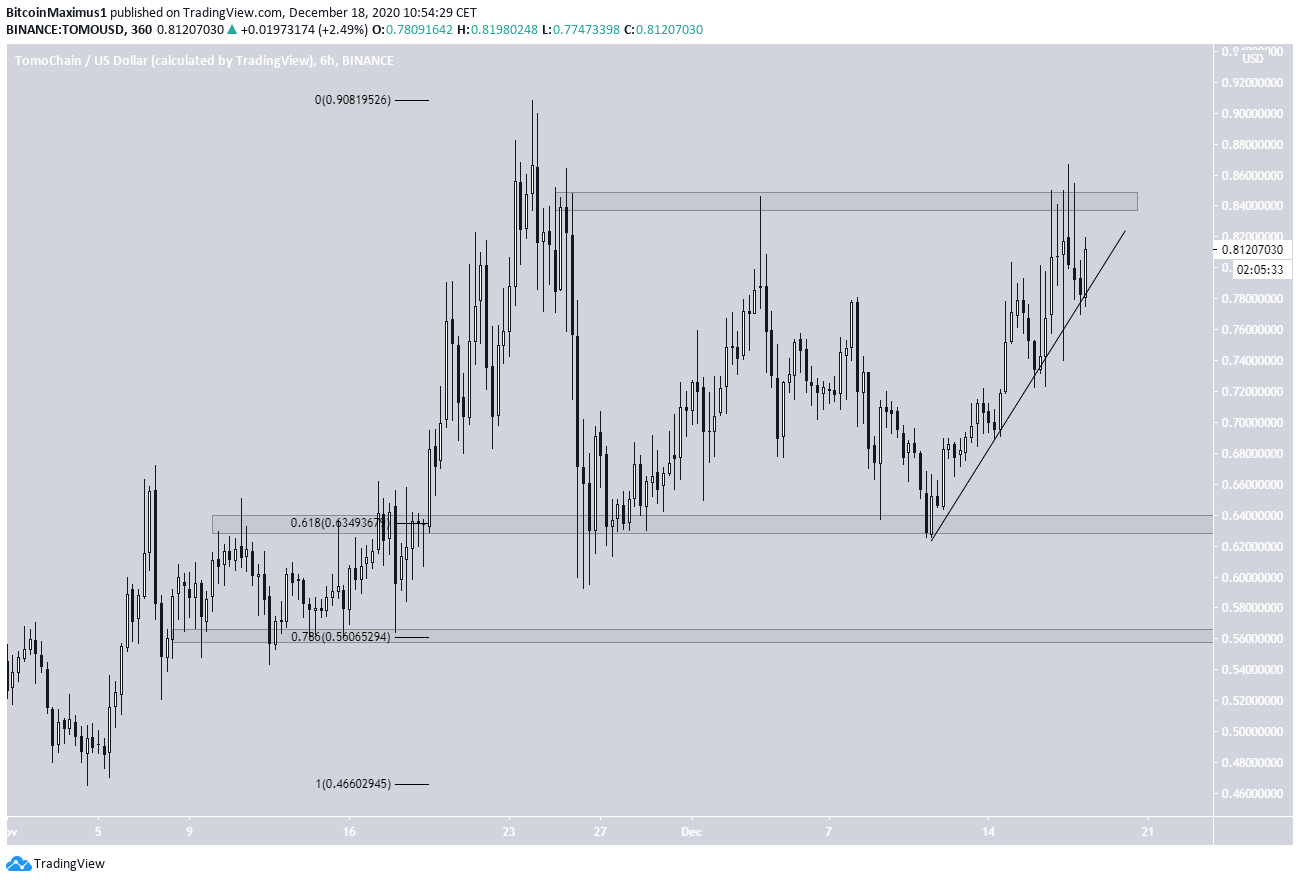
Future Movement
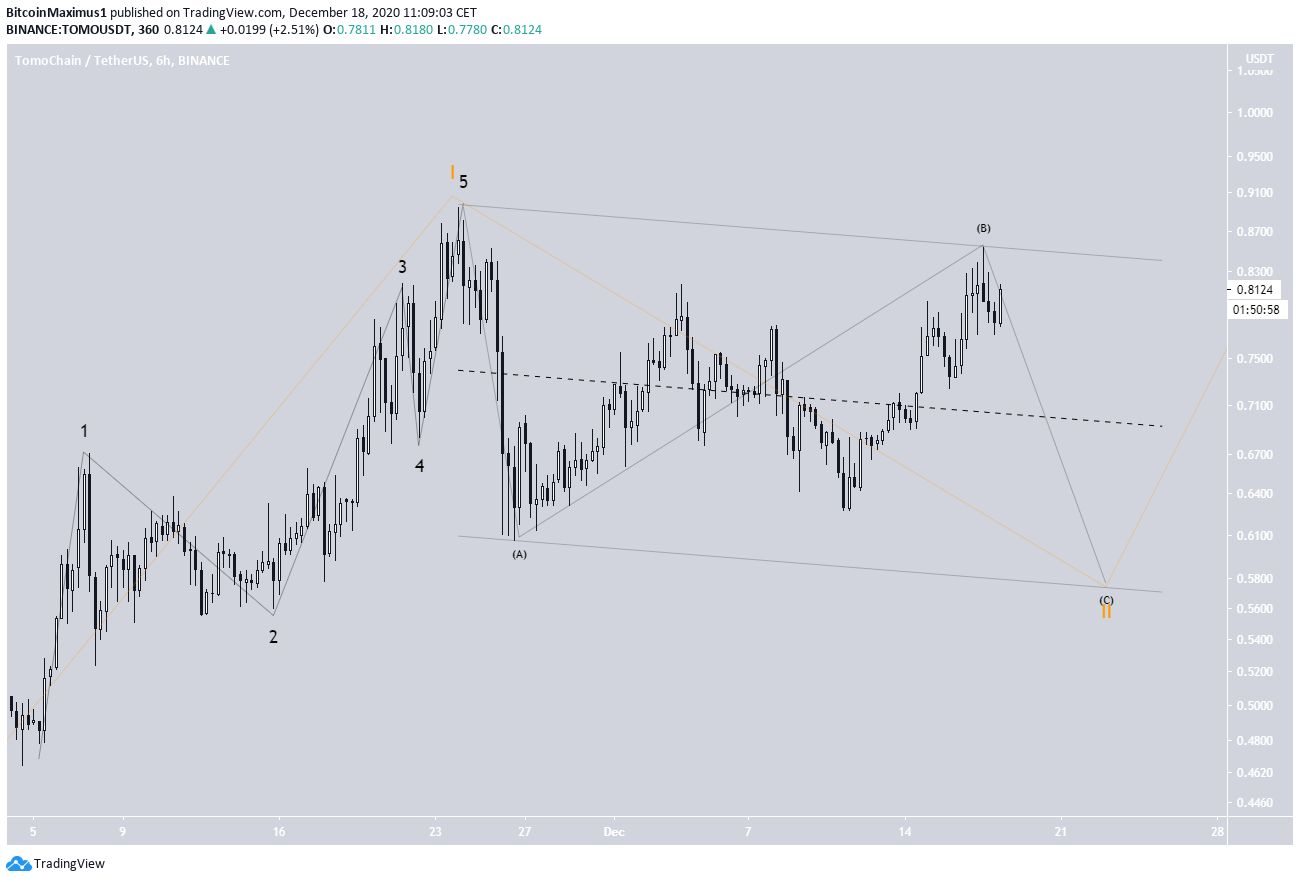
A look at the six-hour chart shows that TOMO is following a steep short-term ascending support line and also facing resistance at $0.85.
At the time of press, the point of convergence between the support line and the resistance area is close, which means a decisive move is expected to occur soon.
A breakdown from the line would likely take TOMO to $0.635 — the 0.618 Fib retracement of the entire upward move.
The next support level below that is found at the range lows near $0.56.
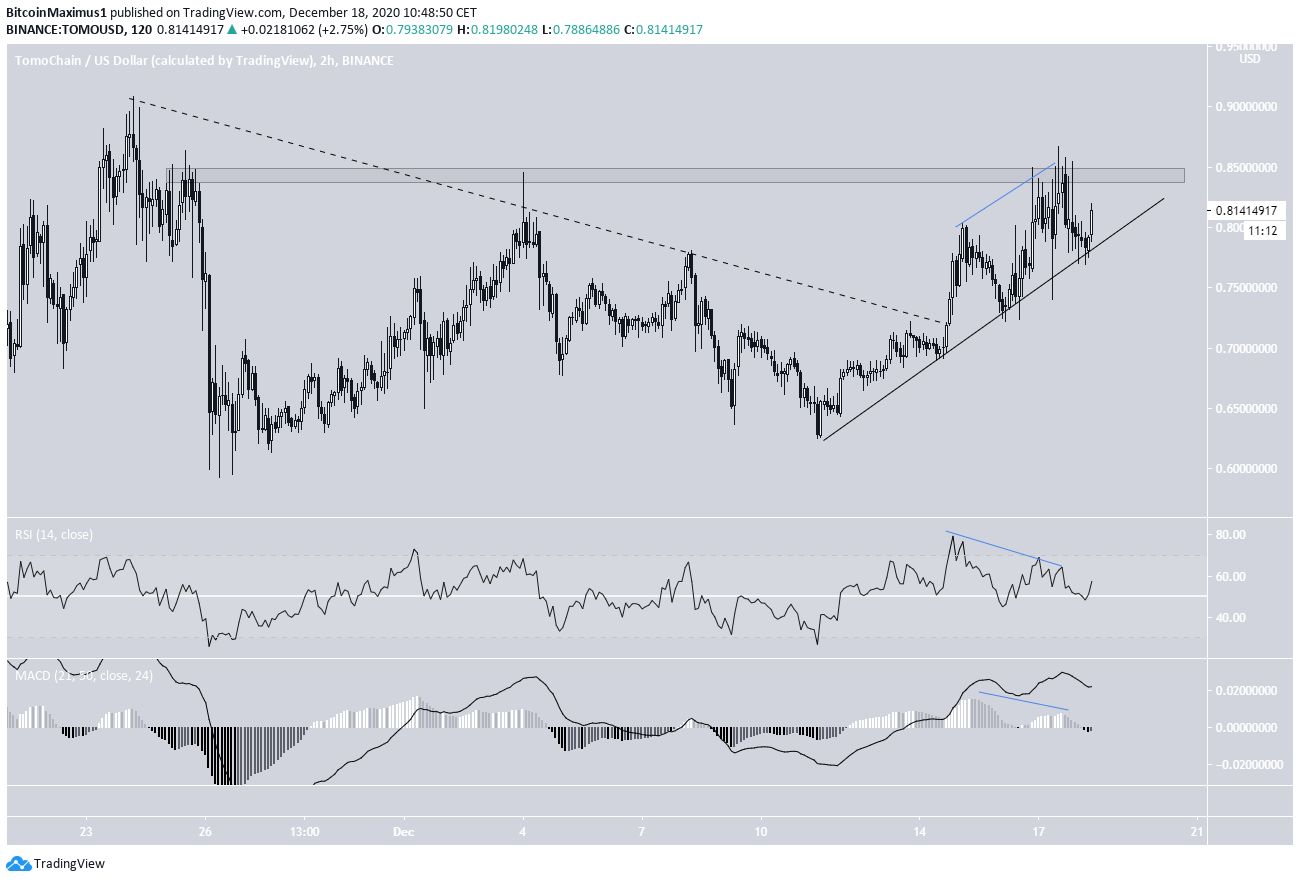
The two-hour chart shows clear signs of weakness. Both the RSI and MACD have generated bearish divergences, a sign of a weakening trend.
Therefore, it is more likely that TOMO breaks down and moves towards the support levels.
A close above the $0.85 resistance area would invalidate this scenario.
TomoChain Wave Count
The wave count suggests that TOMO began a bullish impulse in March and is currently in cycle wave 3 (shown in white below).
A preliminary target for the top of cycle wave 3 is found at $2.78 but will depend on how the wave formation develops (orange).
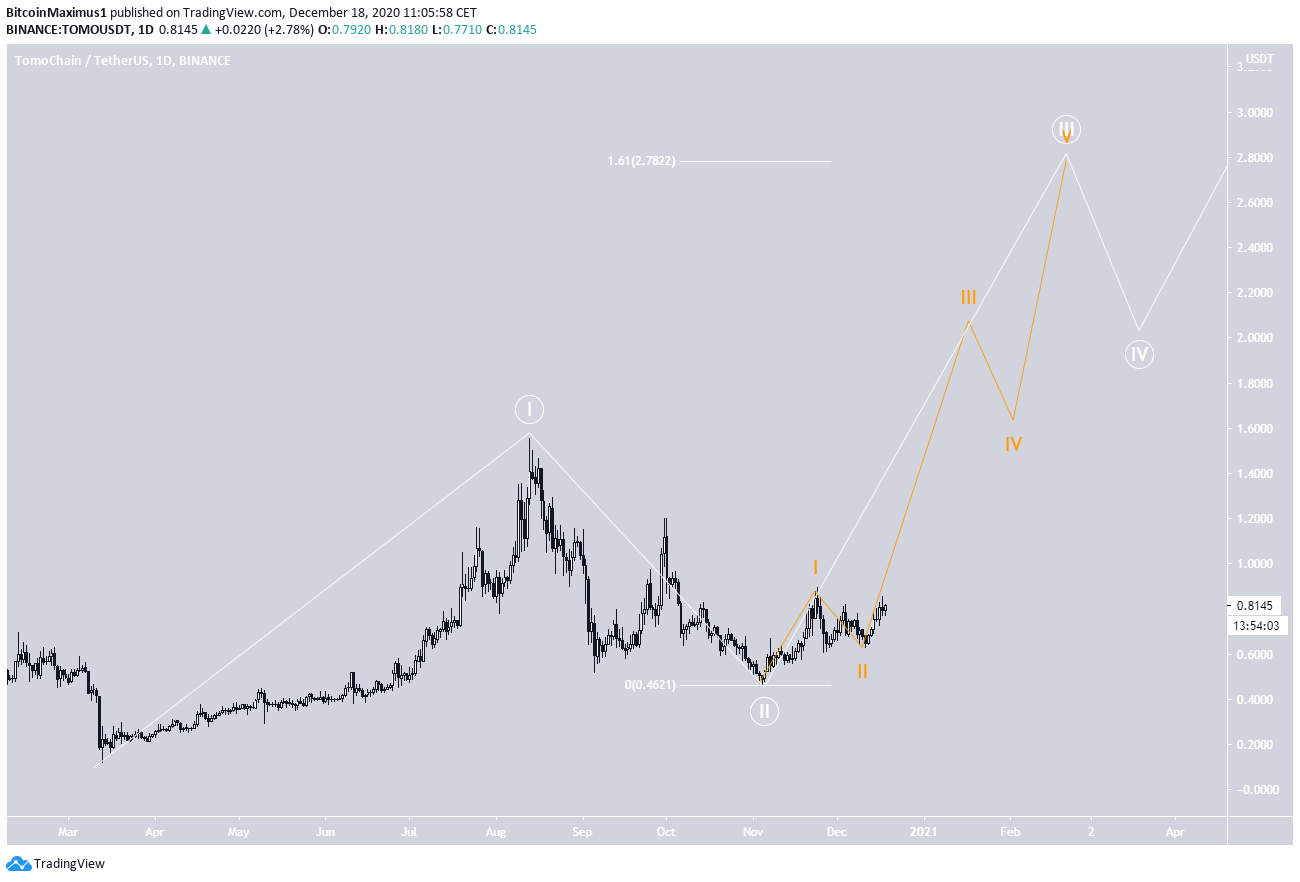
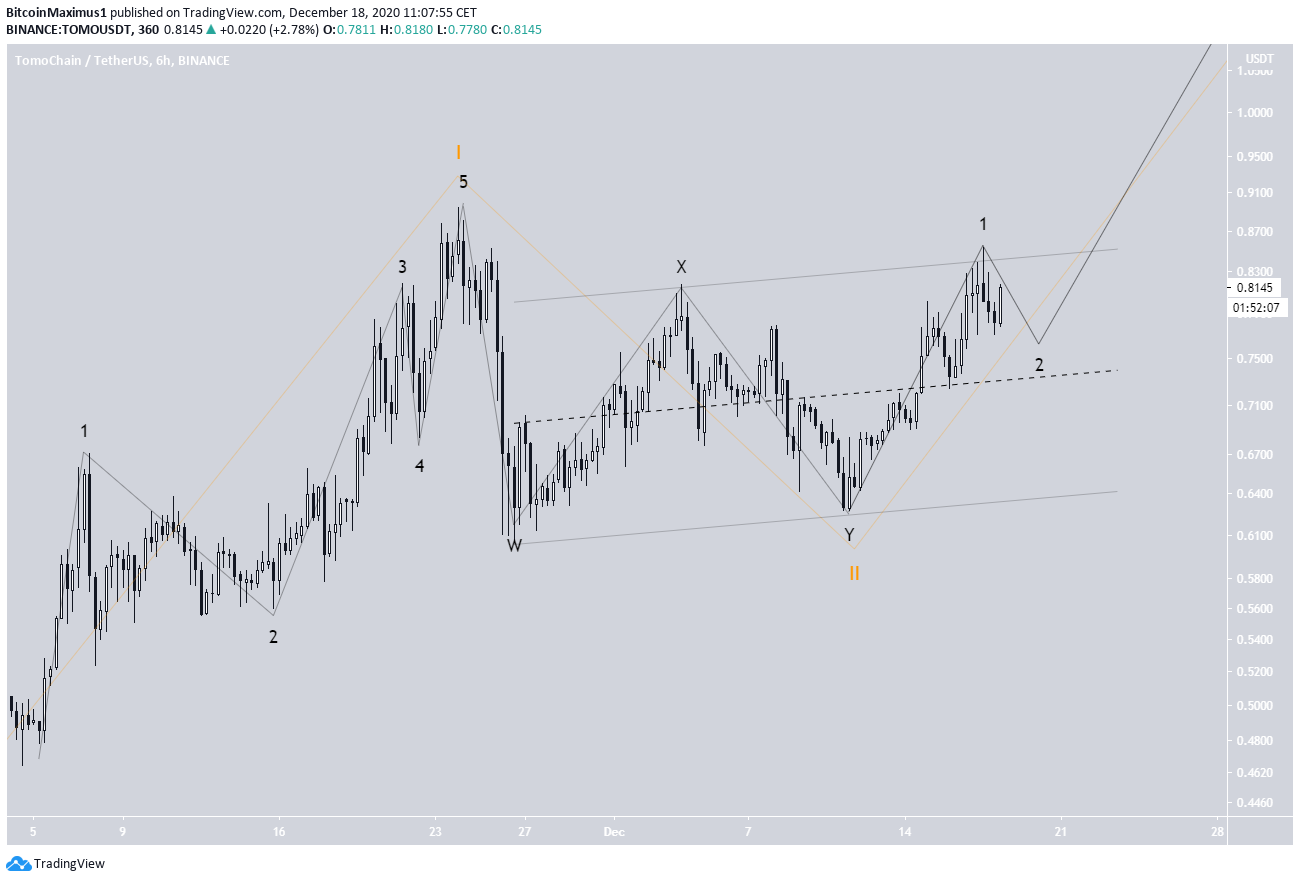
A closer look at the movement reveals that while TOMO has completed wave 1 (orange), it is not yet certain if it’s still correcting inside wave 2 or has already completed it.
The most likely scenario, which would fit with the short-term readings, suggests that TOMO is still in wave 2 and will soon decrease to complete the pattern.
A potential target for the bottom would be at $0.56, fitting with the target given in the previous section.
The sub-wave count is shown in black:
An alternative count suggests that the correction is complete and the price has now begun wave 3.
A breakout above the parallel channel, which would also be a breakout above the previously mentioned $0.85 resistance area, would confirm that this is the correct count.
Conclusion
While the longer-term trend looks bullish, it’s not yet clear if TOMO has completed its short-term correction or if there is one more wave down to go.
Whether TOMO breaks out from the short-term parallel channel or gets rejected by it should help in determining if the correction is complete.
For BeInCrypto’s latest Bitcoin (BTC) analysis, click here!
Disclaimer: Cryptocurrency trading carries a high level of risk and may not be suitable for all investors. The views expressed in this article do not reflect those of BeInCrypto.
Disclaimer
In line with the Trust Project guidelines, this price analysis article is for informational purposes only and should not be considered financial or investment advice. BeInCrypto is committed to accurate, unbiased reporting, but market conditions are subject to change without notice. Always conduct your own research and consult with a professional before making any financial decisions. Please note that our Terms and Conditions, Privacy Policy, and Disclaimers have been updated.
