


The Stellar Lumens (XLM) price shows signs that the correction ongoing since Nov. 2021 might be coming to an end.
Stellar is a decentralized network created by the Stellar Development Foundation. The native crypto asset for the network is XLM, which helps with cross-border transactions and transaction fees. Stellar also serves as a marketplace and decentralized exchange.
While the XLM price has stagnated in a bear market for more than a year, some signs indicate the correction could end soon.
Long-Term Stellar Price Correction
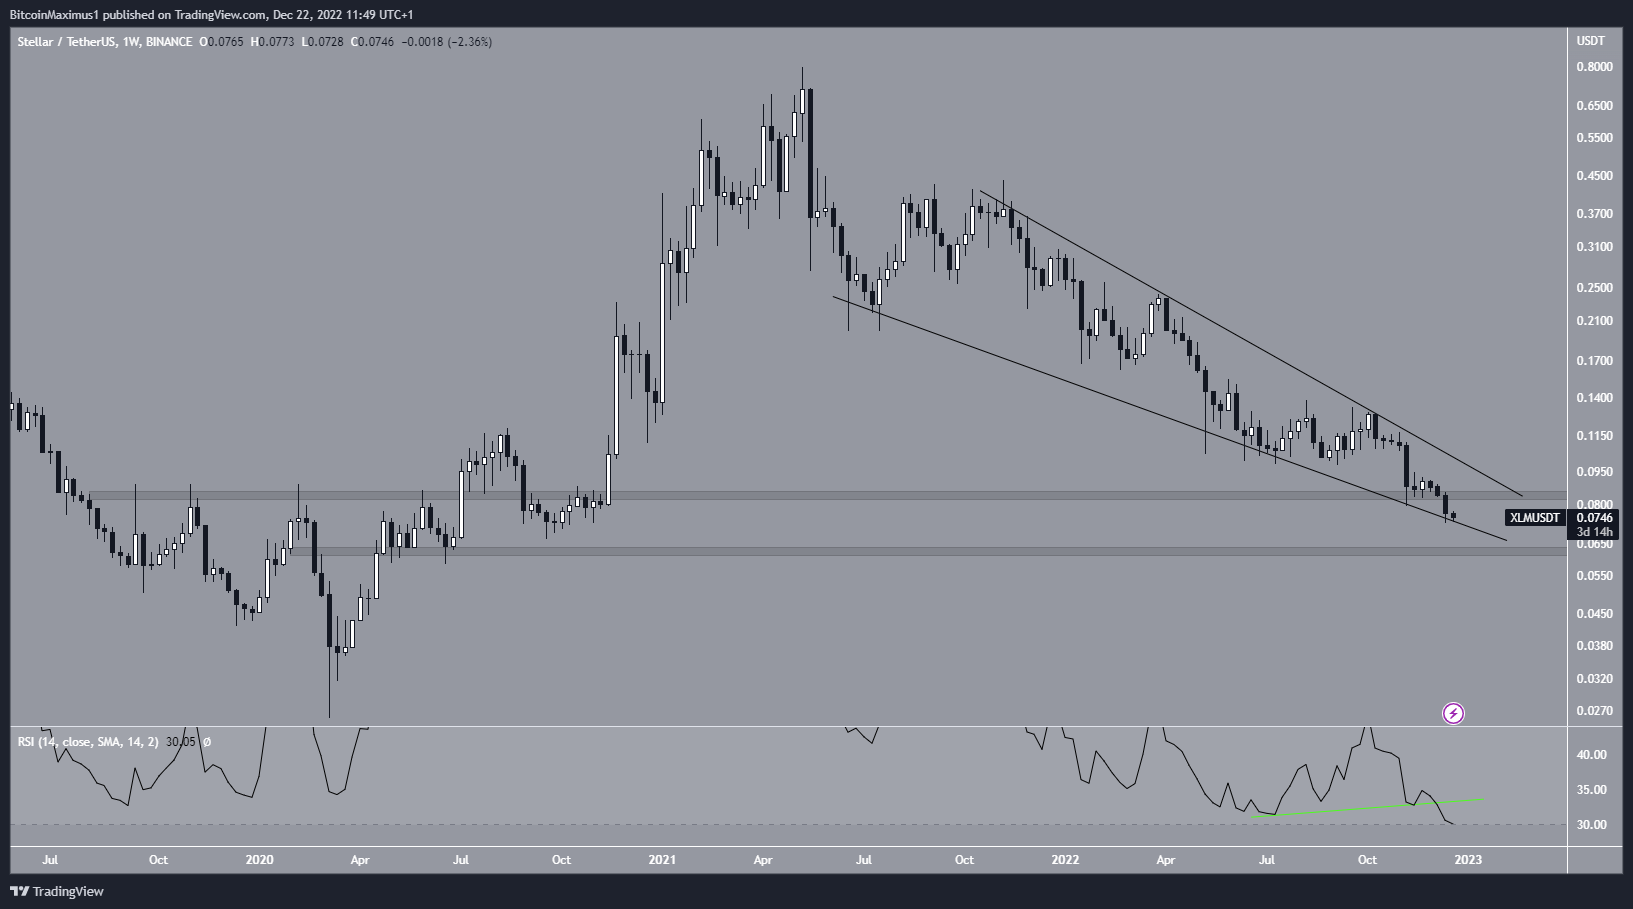
The Stellar price has fallen since May 2021, when it was trading at a high of $0.798. The XLM price created a lower high in Nov. of the same year and accelerated its rate of decrease afterward.
So far, the XLM price has reached a low of $0.072 on Dec. 15. The downward movement caused a breakdown from the $0.084 horizontal support area. This was a crucial development since the area had intermittently acted as both resistance and support since 2019. As a result, the drop suggests that the long-term trend is bearish.
If the downward movement continues, the next closest support area would be at $0.062. The decrease is supported by the weekly RSI, which is falling and has invalidated its bullish divergence trendline (green line).
In the weekly time frame, the only bullish sign for the Stellar price is that the movement is contained inside a descending wedge. The wedge is considered a bullish pattern.
However, even if the wedge is the correct pattern, the XLM price can decrease gradually inside it until it reaches the $0.062 support area. A breakout from the wedge would also mean a reclaim of the $0.084 resistance area. This would indicate that a bullish reversal has begun.
XLM Price Could Begin Rally
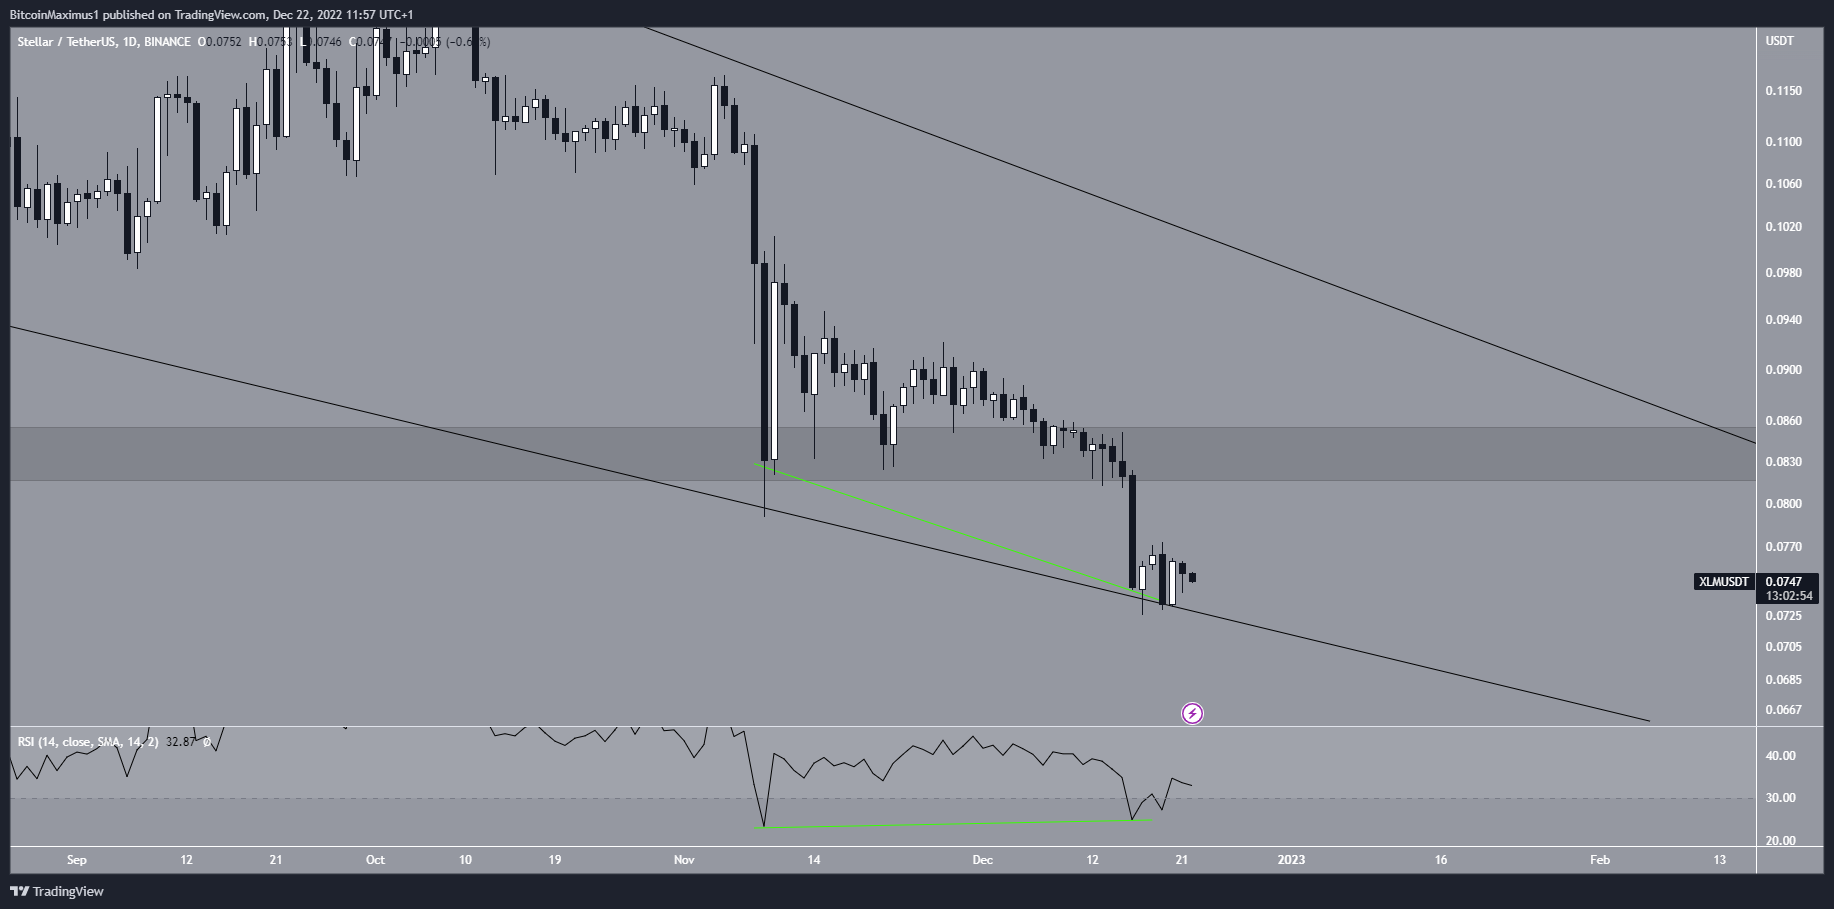
The daily chart provides a more bullish outlook than the weekly one. The main reason for this is the RSI reading. The indicator has generated bullish divergence over a one-month period (green line) and has crossed above its oversold territory. These are both signs that an upward movement is expected.
The fact that the divergence transpired right at the support line of the wedge increases its significance and makes it more likely that a Stellar price increase will follow. If one occurs, the $0.084 area is expected to provide resistance.
Conversely, a daily close below the support line of the wedge would suggest that new lows are likely instead. This could take the XLM price toward the $0.062 support area.
Wave Count Supports Bottom
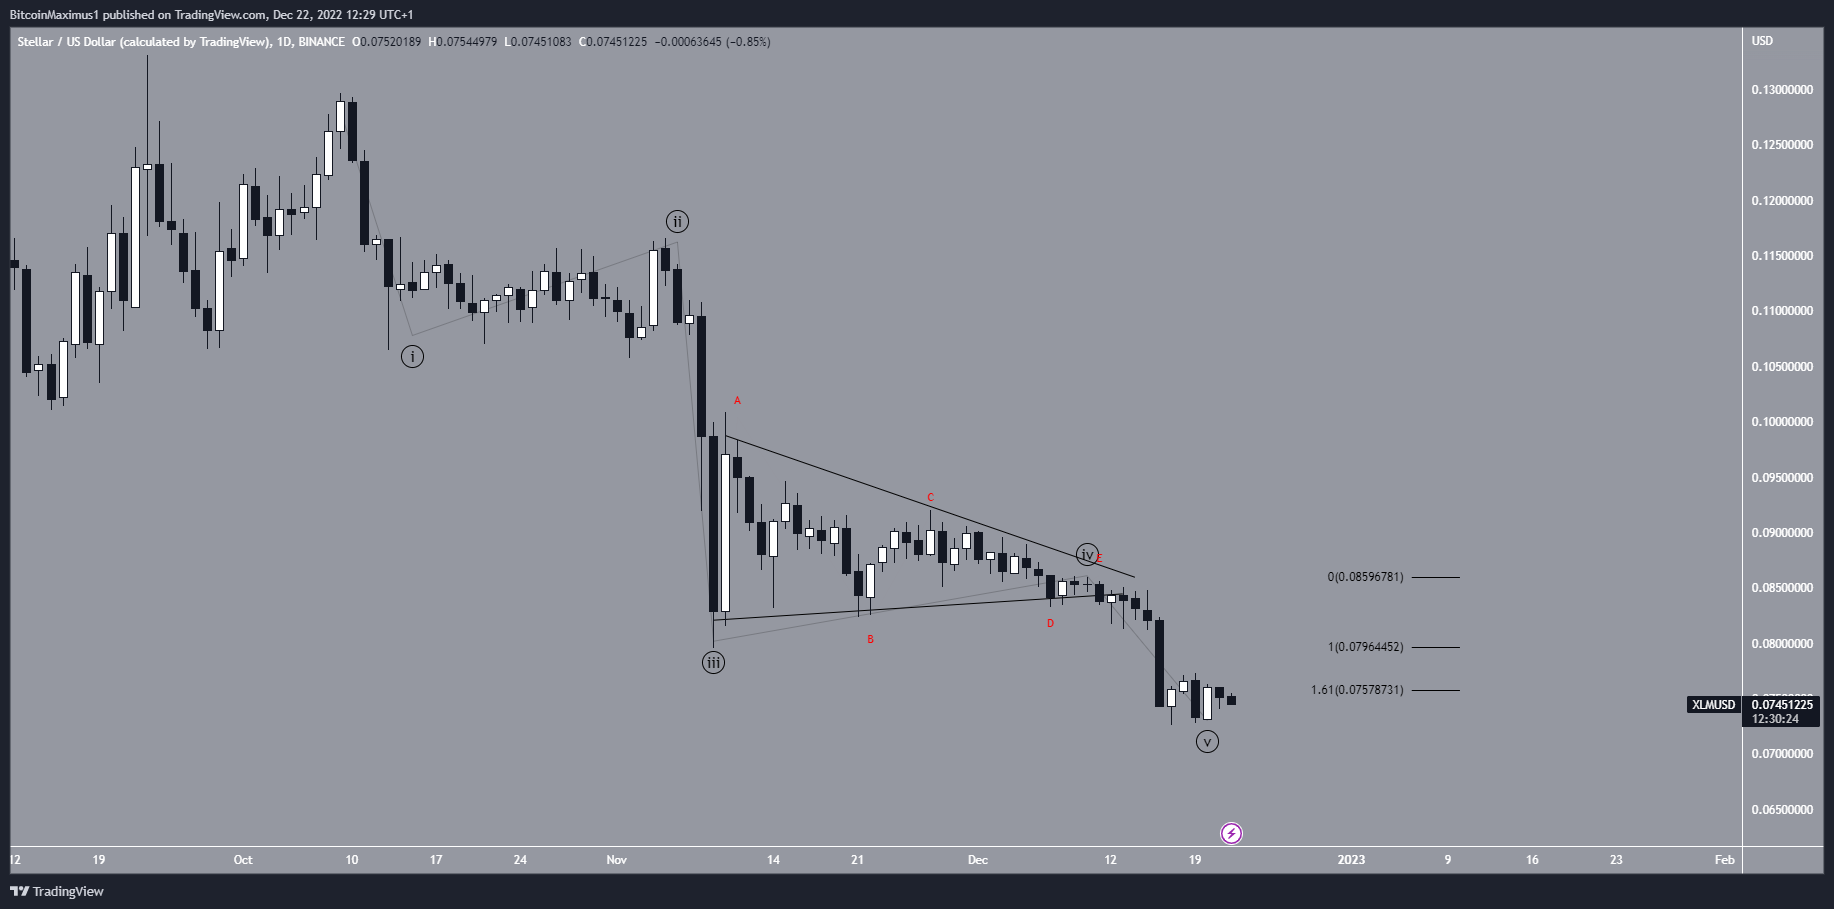
Finally, the wave count aligns with the possibility of a bottom. Since the beginning of Oct, the XLM price has completed a five-wave downward movement (black). The defining characteristic of this formation is the symmetrical triangle in wave four. Additionally, wave five ended close to the 1.61 external retracement of wave four, which is common in such formations. The sub-wave count is given in (red).
A drop below the $0.072 low would invalidate this wave count.
To conclude, while the readings from the weekly time frame are still bearish, three reasons indicate the XLM price correction could soon come to an end:
- The descending wedge
- The wave count
- The bullish divergence in the RSI
For BeInCrypto’s latest crypto market analysis, click here.


