

Despite Bitcoin’s relatively high market dominance as of late, there are still a handful of altcoins that are showing potential for growth.
Quant (QNT) has broken out from a long-term descending resistance line and validated it as support. MATIC is attempting to move above an important resistance level but has thus far been unsuccessful.
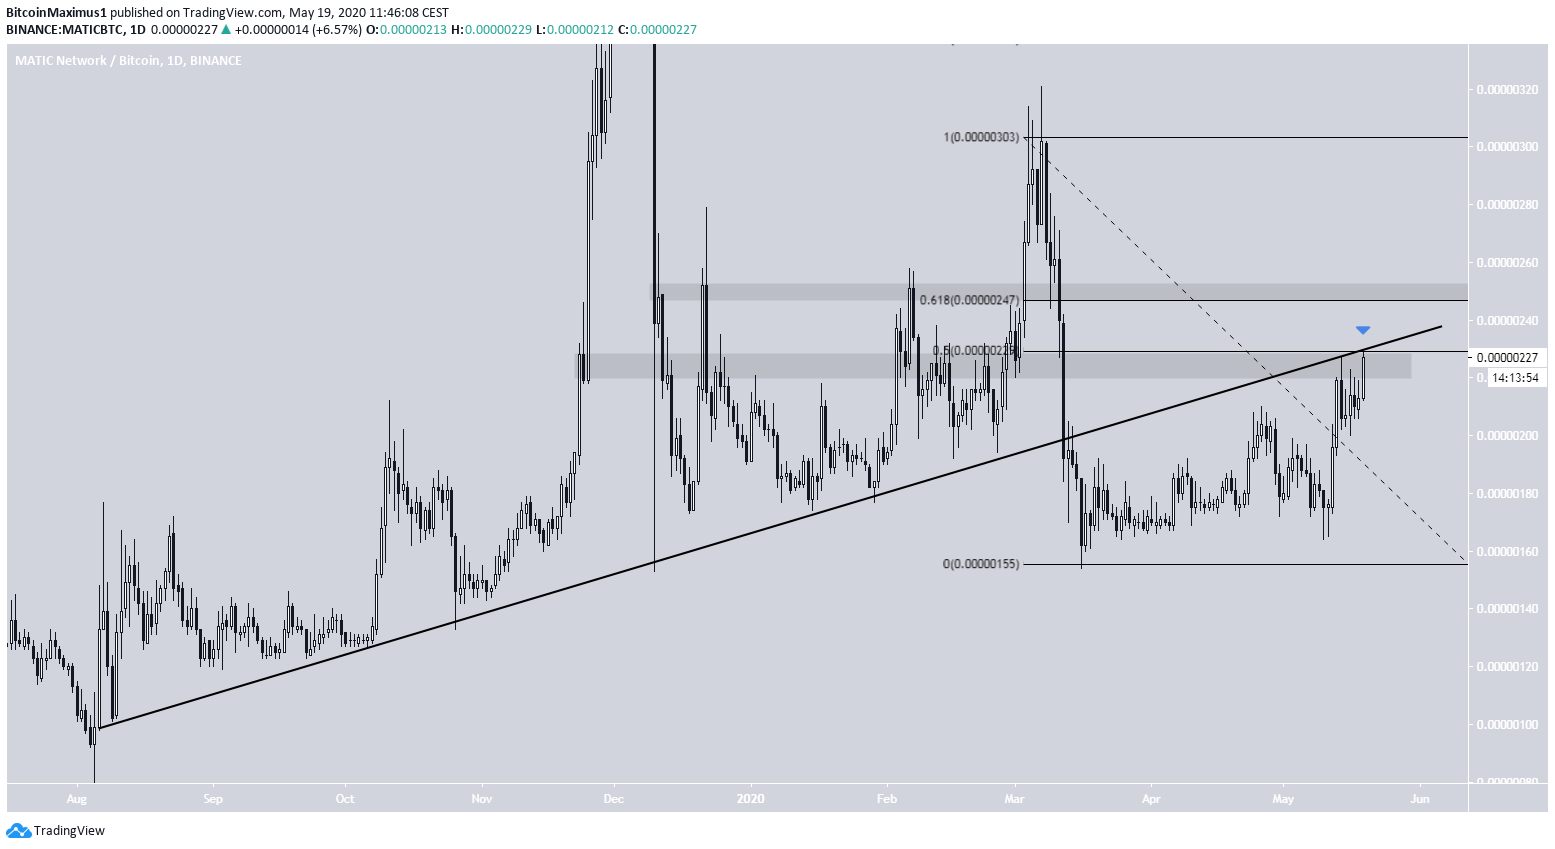
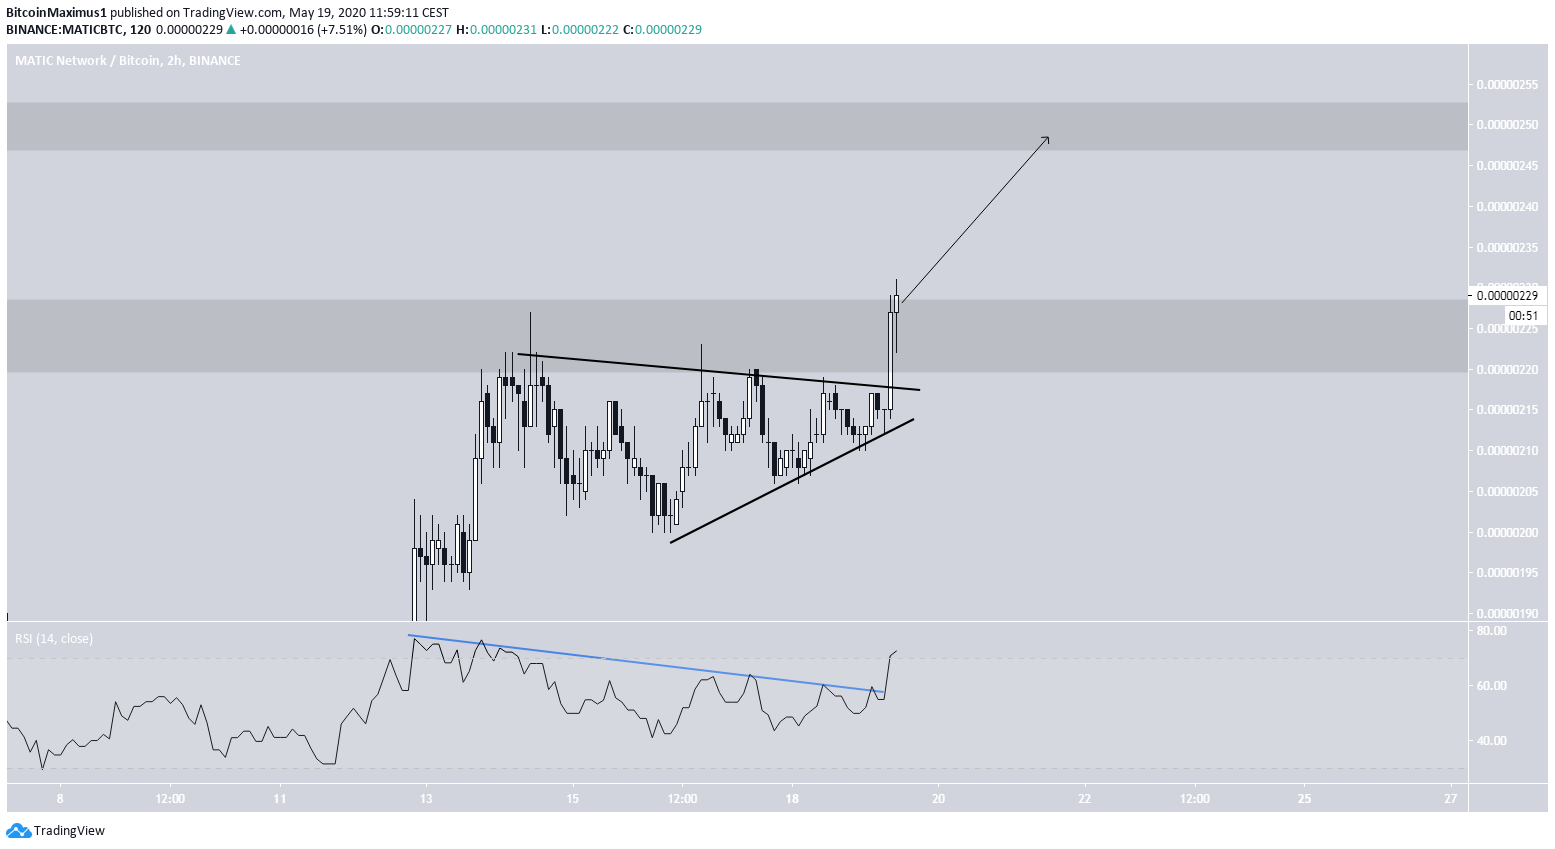
Matic Network (MATIC)
Cryptocurrency trader @CryptoMichNL outlined a MATIC chart, showing that the price has moved above a crucial resistance area and possibly validated it as support. He has given two resistance targets for further upward movement, found at 244 and 272 satoshis.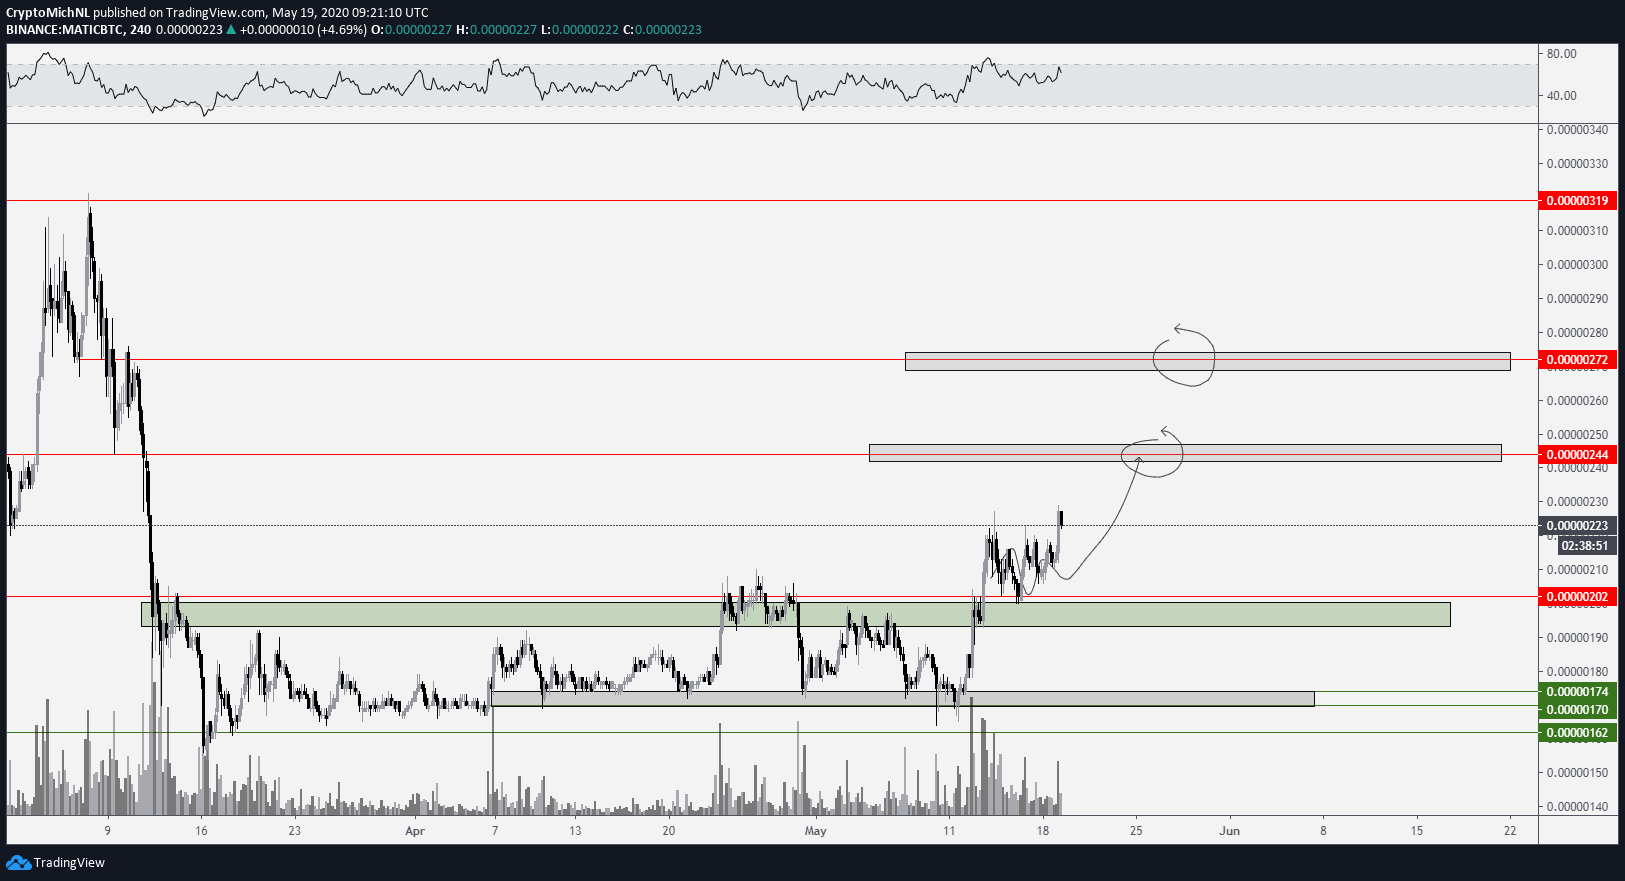
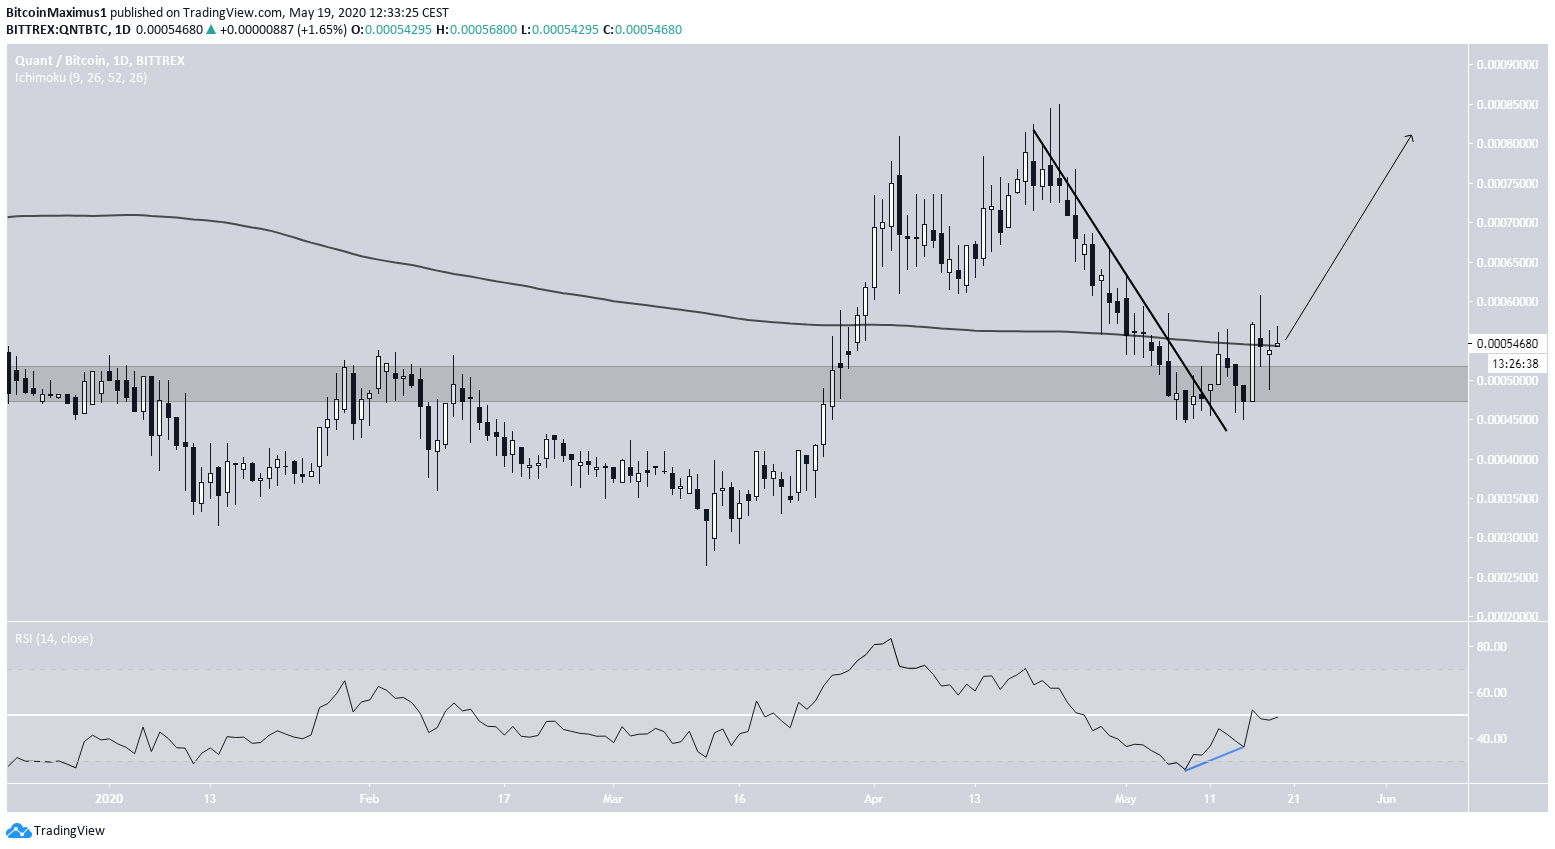
Quant (QNT)
One other coin that has significant breakout potential is QNT. On March 30, the price broke out from a long-term descending resistance line that had been in place since February 2019. Afterward, the price returned in order to validate this line as support. If it begins moving upwards, as is customary, the closest resistance area would be found at 86,000 satoshis.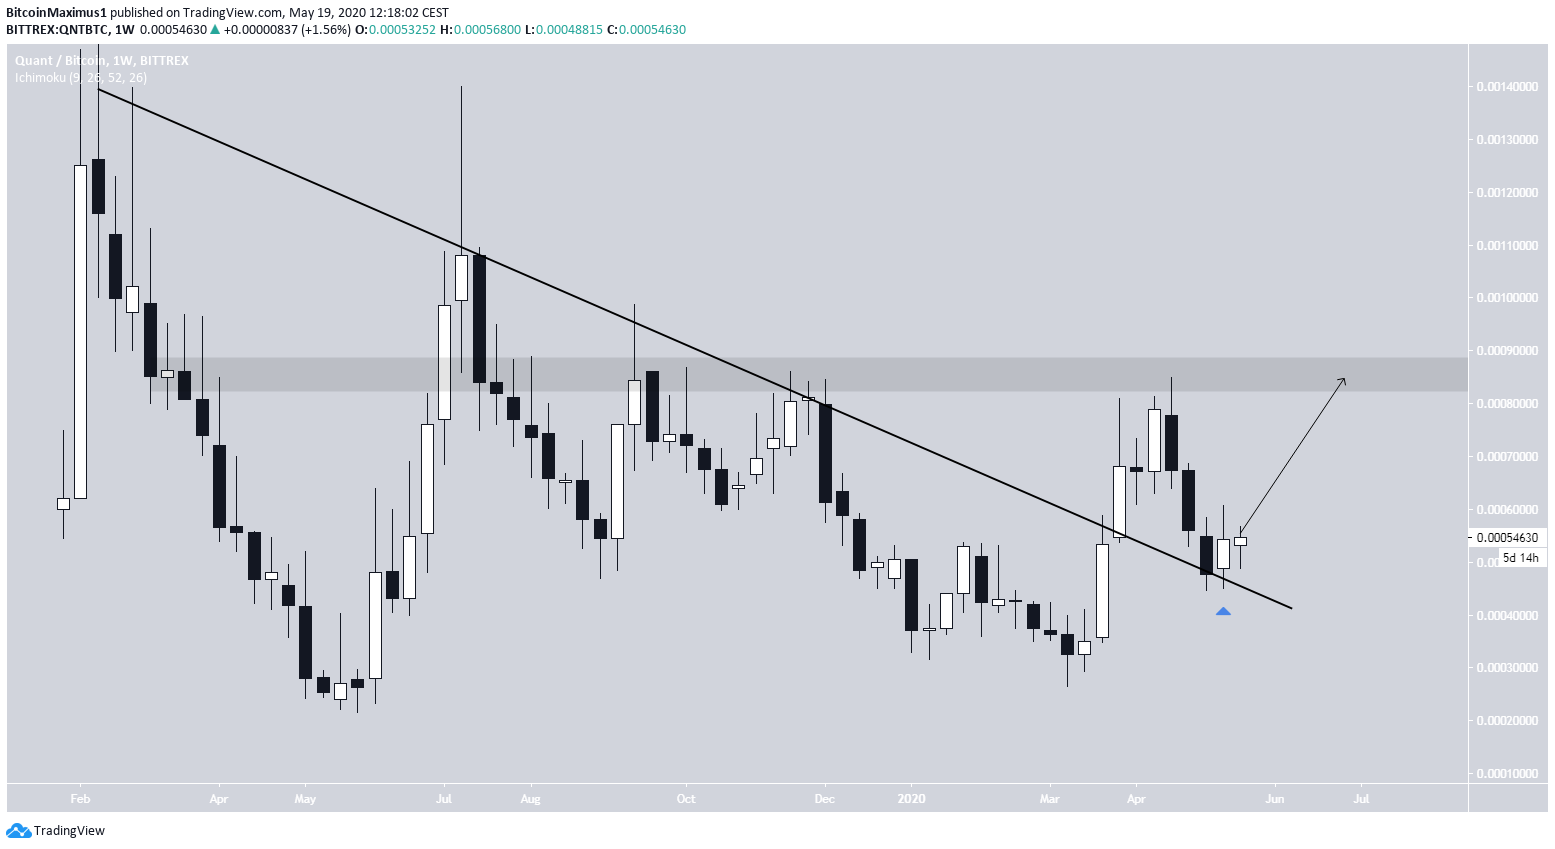
Top crypto platforms in the US
Disclaimer
In line with the Trust Project guidelines, this price analysis article is for informational purposes only and should not be considered financial or investment advice. BeInCrypto is committed to accurate, unbiased reporting, but market conditions are subject to change without notice. Always conduct your own research and consult with a professional before making any financial decisions. Please note that our Terms and Conditions, Privacy Policy, and Disclaimers have been updated.

Valdrin Tahiri
Valdrin discovered cryptocurrencies while he was getting his MSc in Financial Markets from the Barcelona School of Economics. Shortly after graduating, he began writing for several different cryptocurrency related websites as a freelancer before eventually taking on the role of BeInCrypto's Senior Analyst.
(I do not have a discord and will not contact you first there. Beware of scammers)
READ FULL BIO
Sponsored
Sponsored