


The Bitcoin dominance rate (BTCD) has been decreasing since May 14, but recently broke out from a long-term descending resistance line, indicating that an upward trend has begun.
This means that altcoin and Bitcoin pairs are likely to decrease.
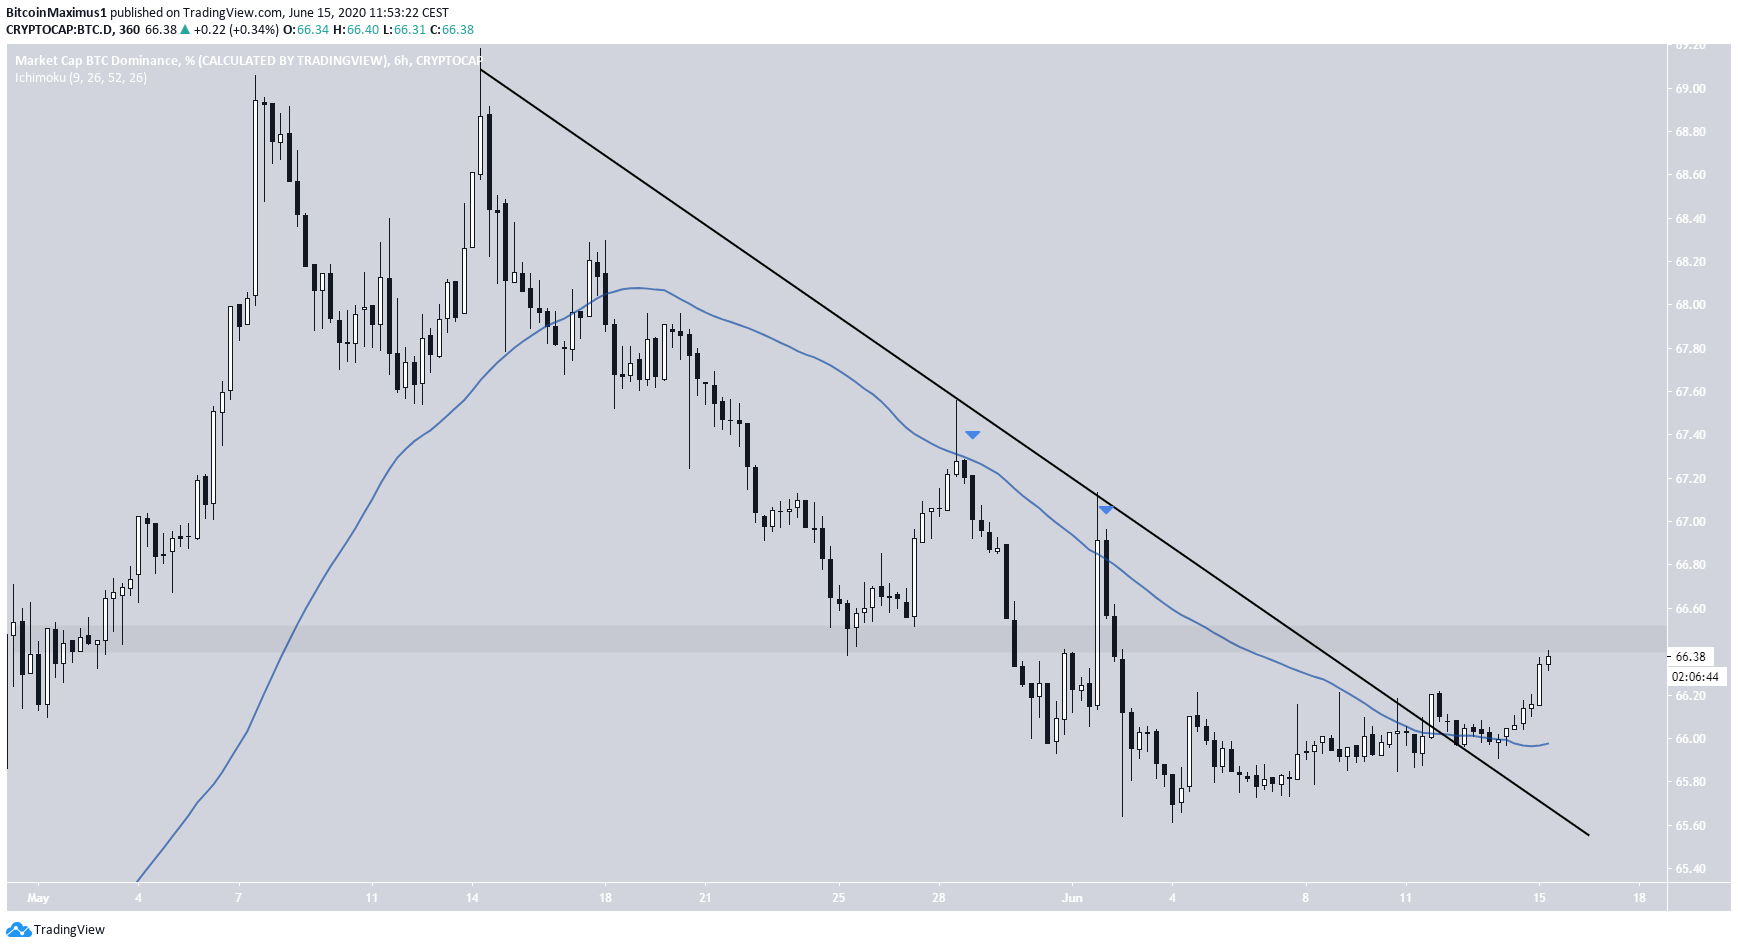
Resistance Breakout
The Bitcoin dominance rate reached a high of 69.14% on May 14 and has been decreasing with a relatively steep slope since having made three unsuccessful breakout attempts during this time. In addition, the descending resistance line coincides with the 50-period moving average (MA).
However, on June 11, BTCD broke out from this descending resistance line and has been increasing since. The closest resistance area is found at 64.5%, very close to the current rate.
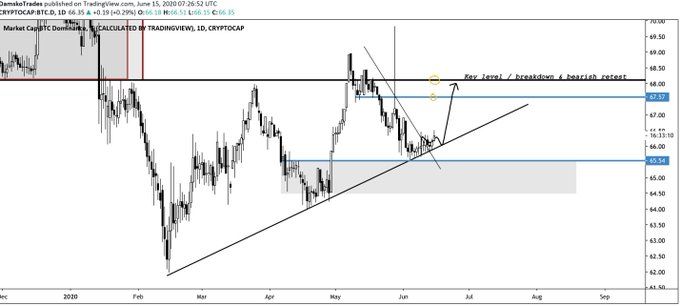
Well-known trader @Damskotrades agrees with the assessment of the breakout, stating that BTCD could increase all the way to 67%.
$BTC Dominance / $ALTS Finally! The bloodbath is starting & Dominance is bouncing.
More blood to come.
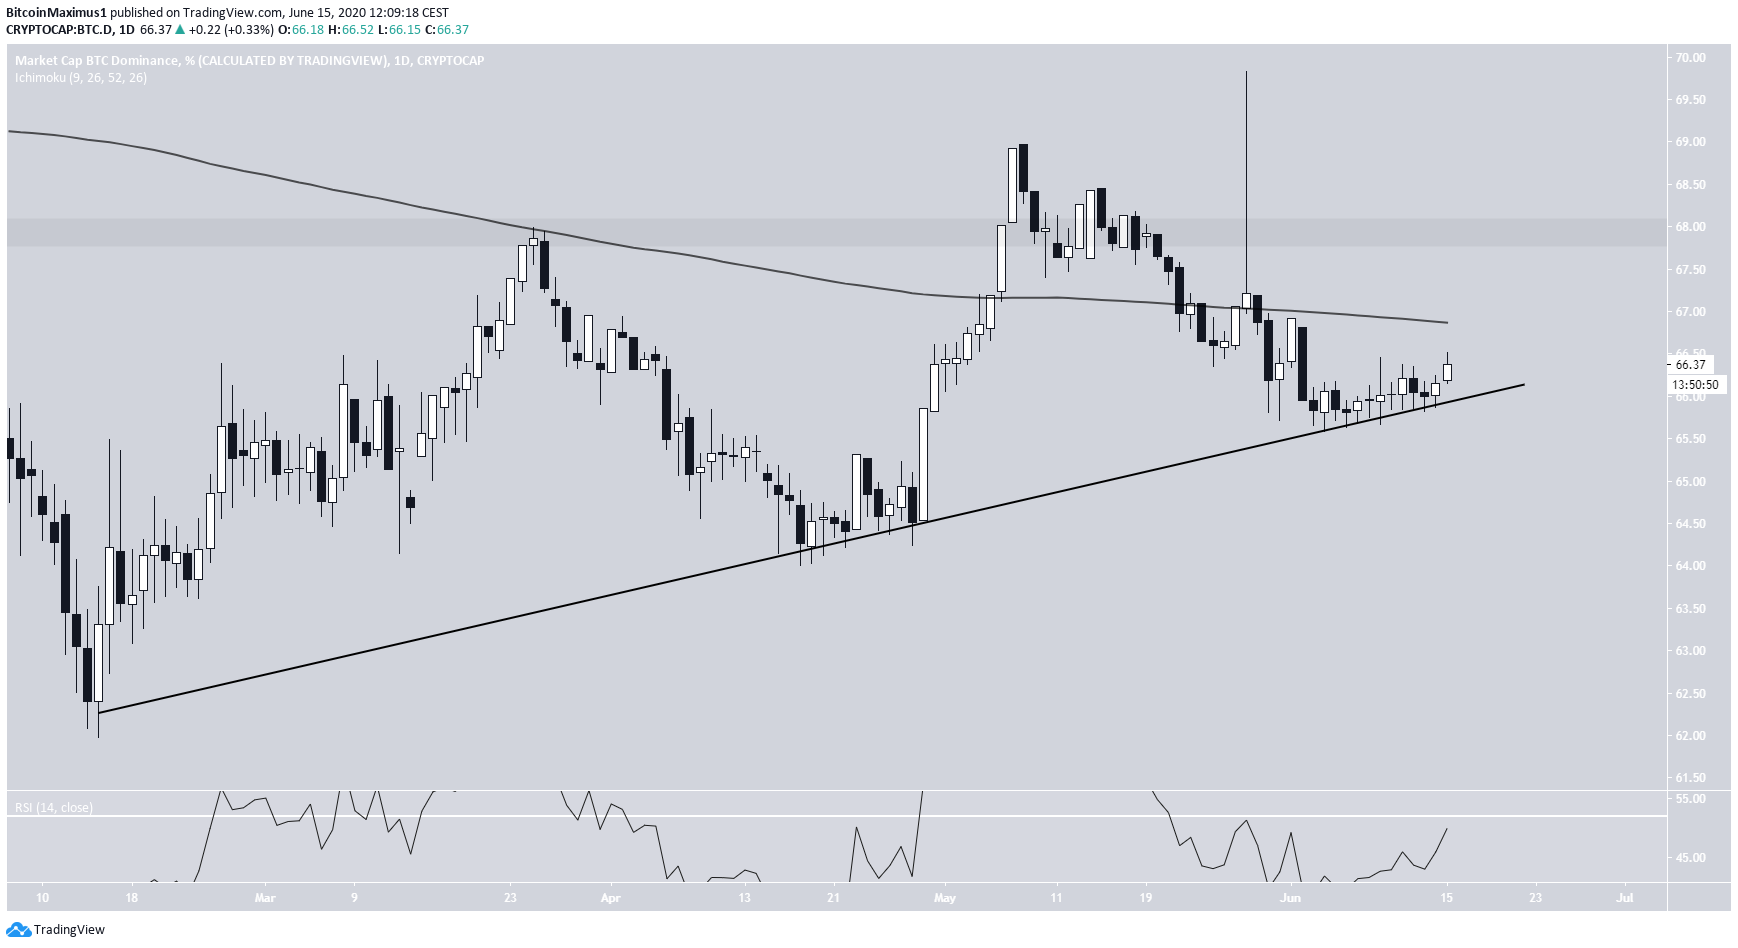
Ascending Support Line
As mentioned in the tweet, BTCD has also been following an ascending support line since Feb 14 and has recently bounced off of it. This increases the chance that the movement outlined in the previous section transpires.
The validity of the 66.5% resistance area is strengthened since it also coincides with the 200-day MA. If the rate successfully increases above this level, it is likely to reach the next resistance area at 68%.
While the daily RSI does not show any divergence, it is moving towards 50, and an increase above that would indicate that it is heading towards the target of 68%.
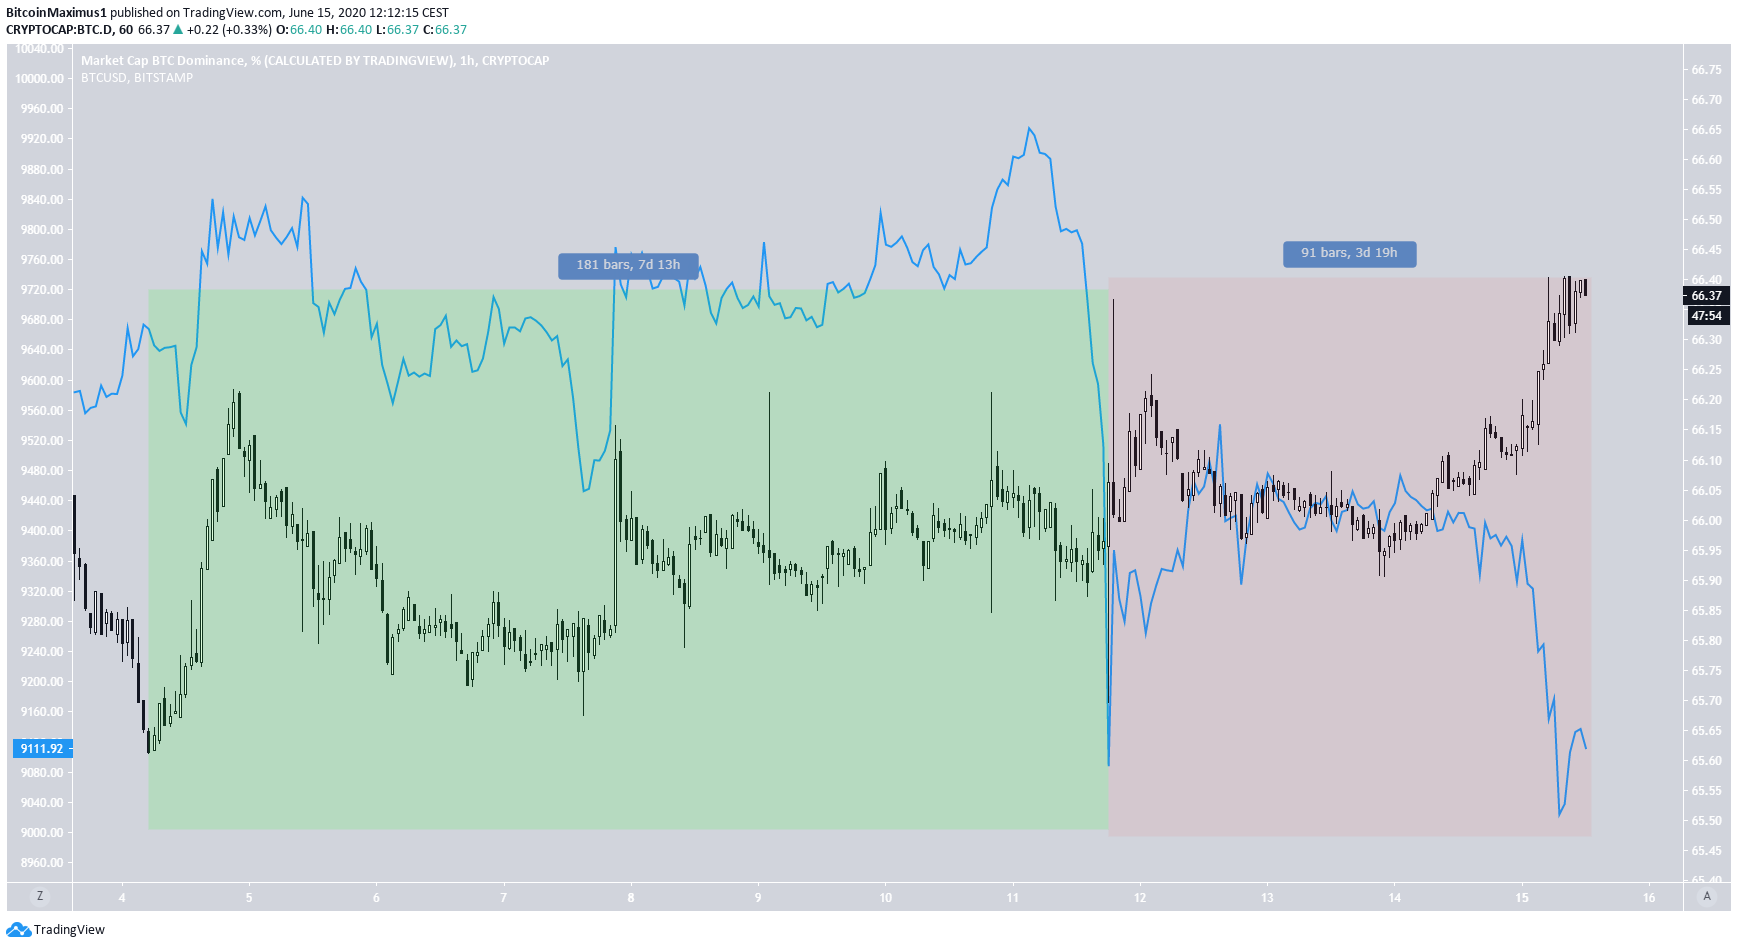
Correlation With Bitcoin
The BTCD (candlesticks) and the Bitcoin price (blue) are shown in the image below.
In the period from June 4-11, the dominance rate and the price of Bitcoin were directly correlated, meaning an increase in one also caused an increase in the other.
The opposite has been true since June 11, since a decrease in the price of Bitcoin has caused an increase in the Bitcoin dominance rate. In addition, while the Bitcoin price increase also caused BTCD to decrease, the period was relatively short, so it is not sufficient to confirm this similarity.
Therefore, while Bitcoin price decreases are causing BTCD to increase, the effect of price increases is unclear.
To conclude, the BTCD has broken out from a month-long descending resistance line and is moving upwards towards the closest resistance area. This suggests that altcoin/bitcoin pairs are due for a corrective period.


