


During the week of May 8-15, the Bitcoin (BTC) price decreased slightly while creating a small bearish weekly candlestick. Since this candlestick is following a price rejection from an important resistance area, this increases the chance that the price will continue decreasing in the long-term. However, a short-term reversal is possible.
Weekly Bitcoin Outlook
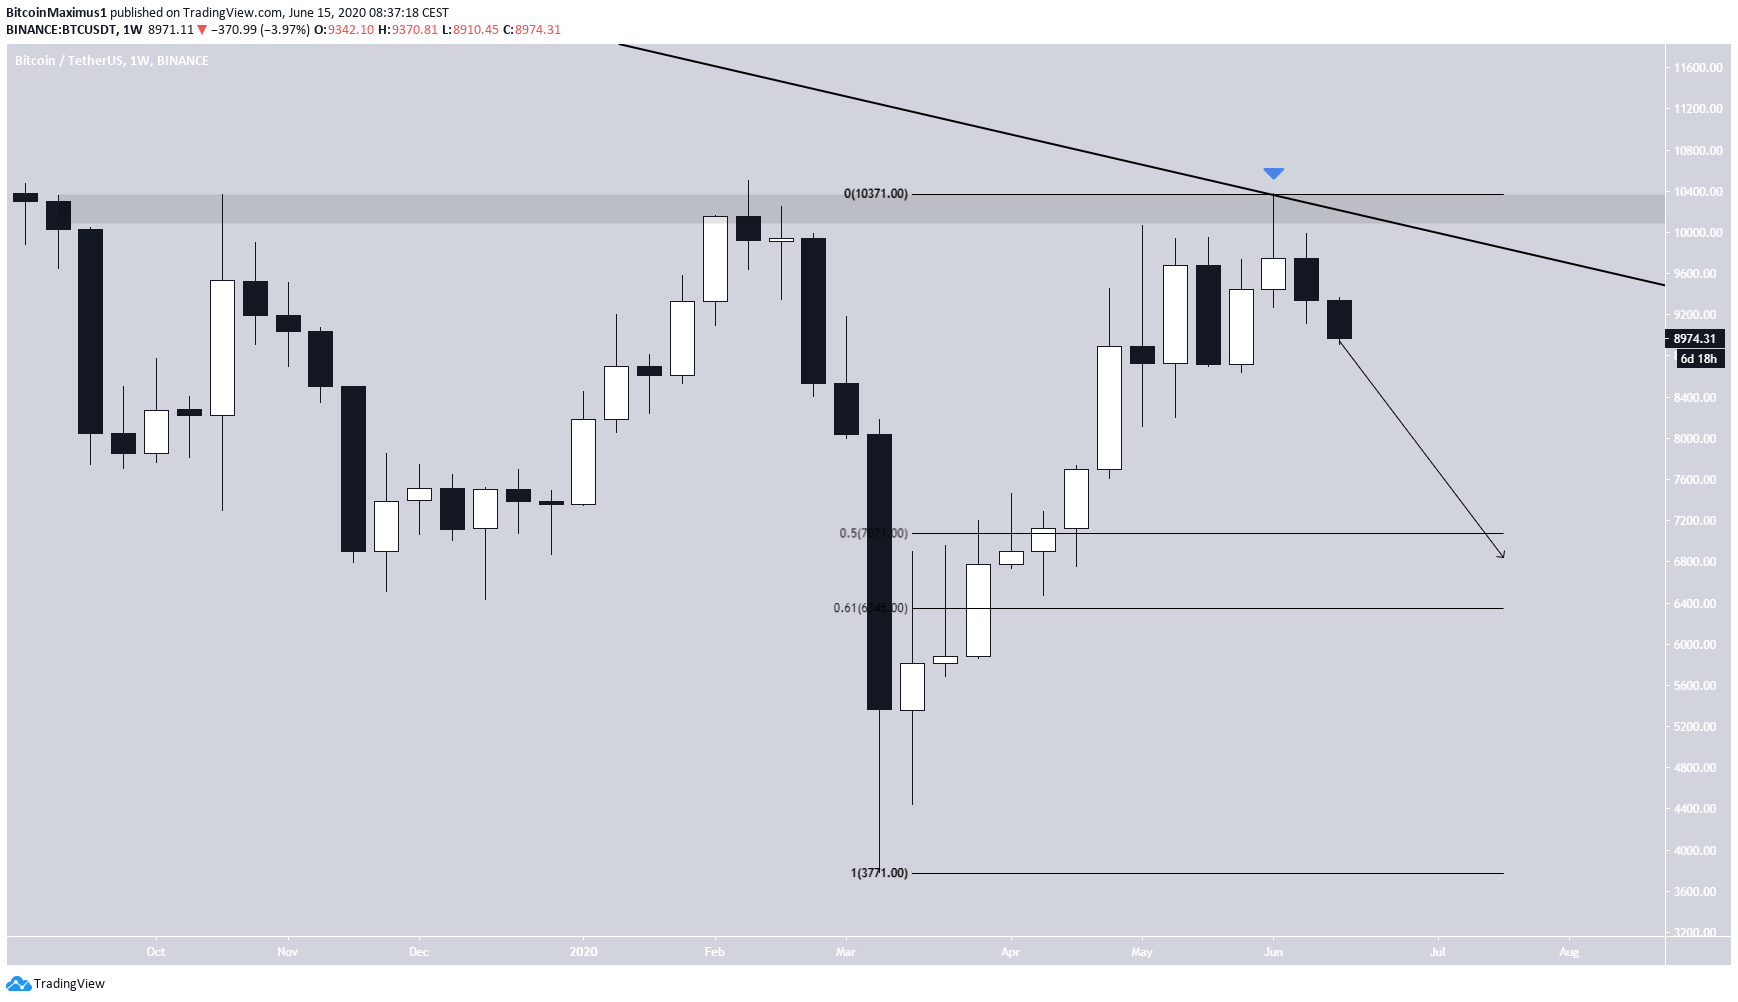
During the week of May 1-8, the Bitcoin price was rejected by the $10,500 resistance area and the long-term descending resistance line that had been in place since the all-time high of December 2017. This created a long upper wick — a sign of pressure. Bitcoin followed this by creating another weekly bearish candlestick, which engulfed the previous bullish one.
If this is the beginning of a reversal, the Bitcoin price could decrease all the way to the 0.5-0.618 Fib levels of the entire increase, found between $6000-$7000.
Short-Term Movement
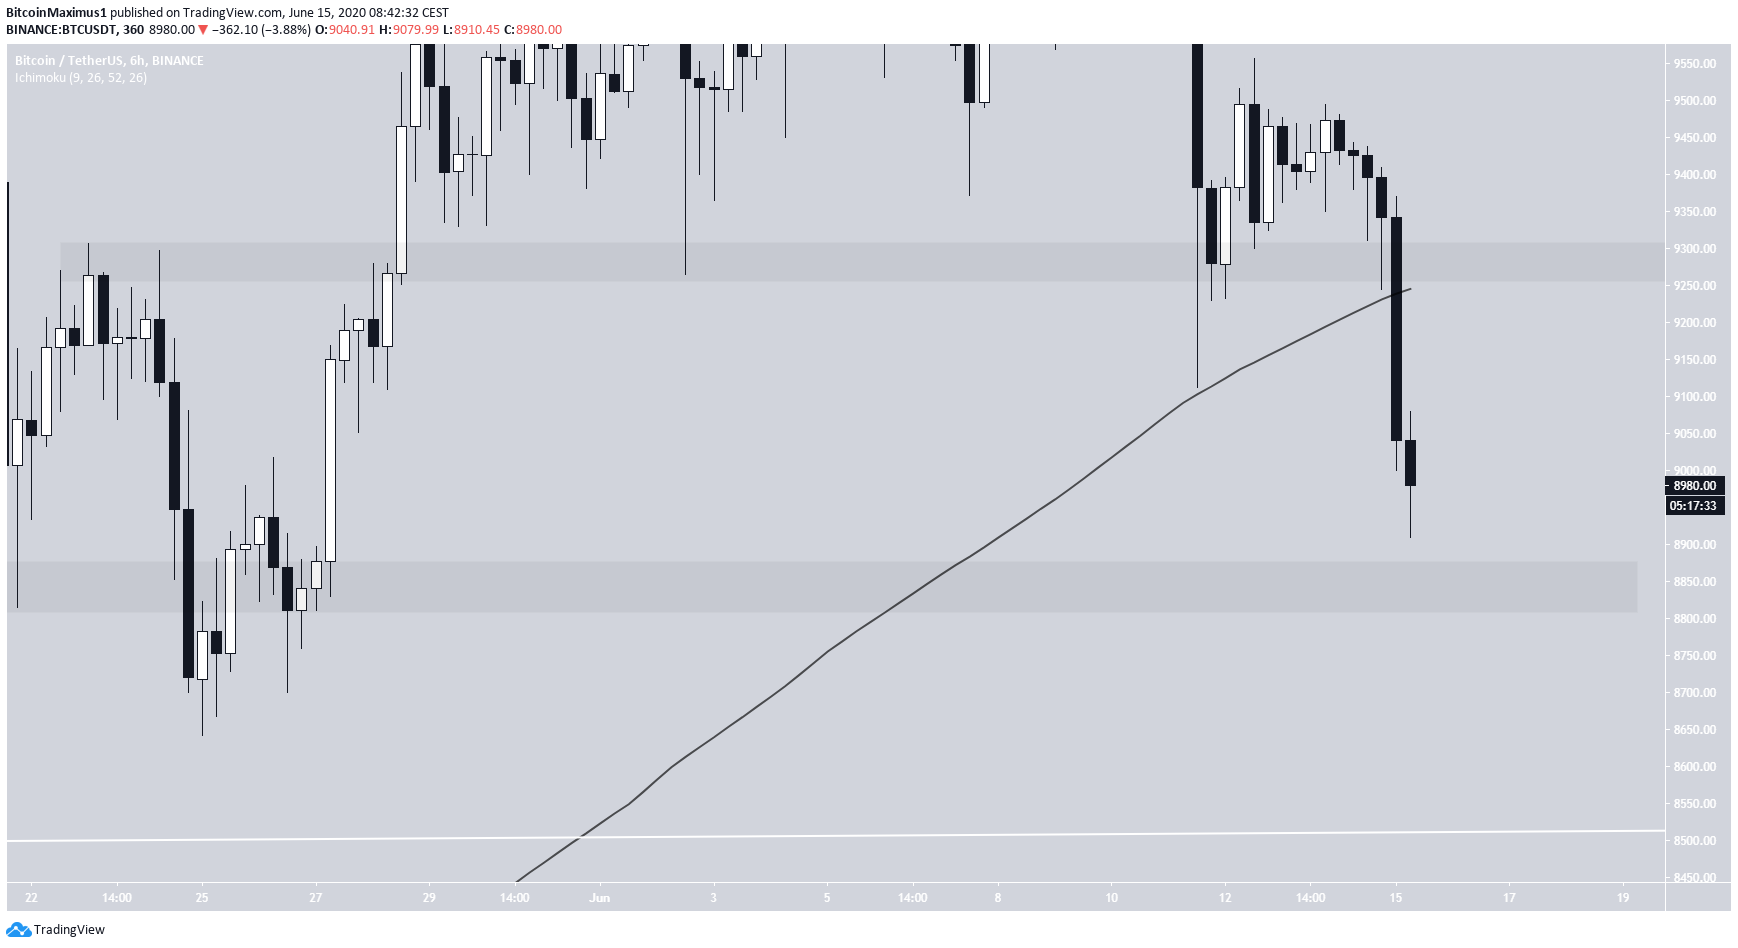
In the shorter-term, the Bitcoin price has just fallen below both the $9300 support area and the 50-day moving average (MA), both of which halted the rapid decrease of June 11. This is a bearish sign that suggests that the price will head lower.
If it does so, the closest support area is found at $8800.
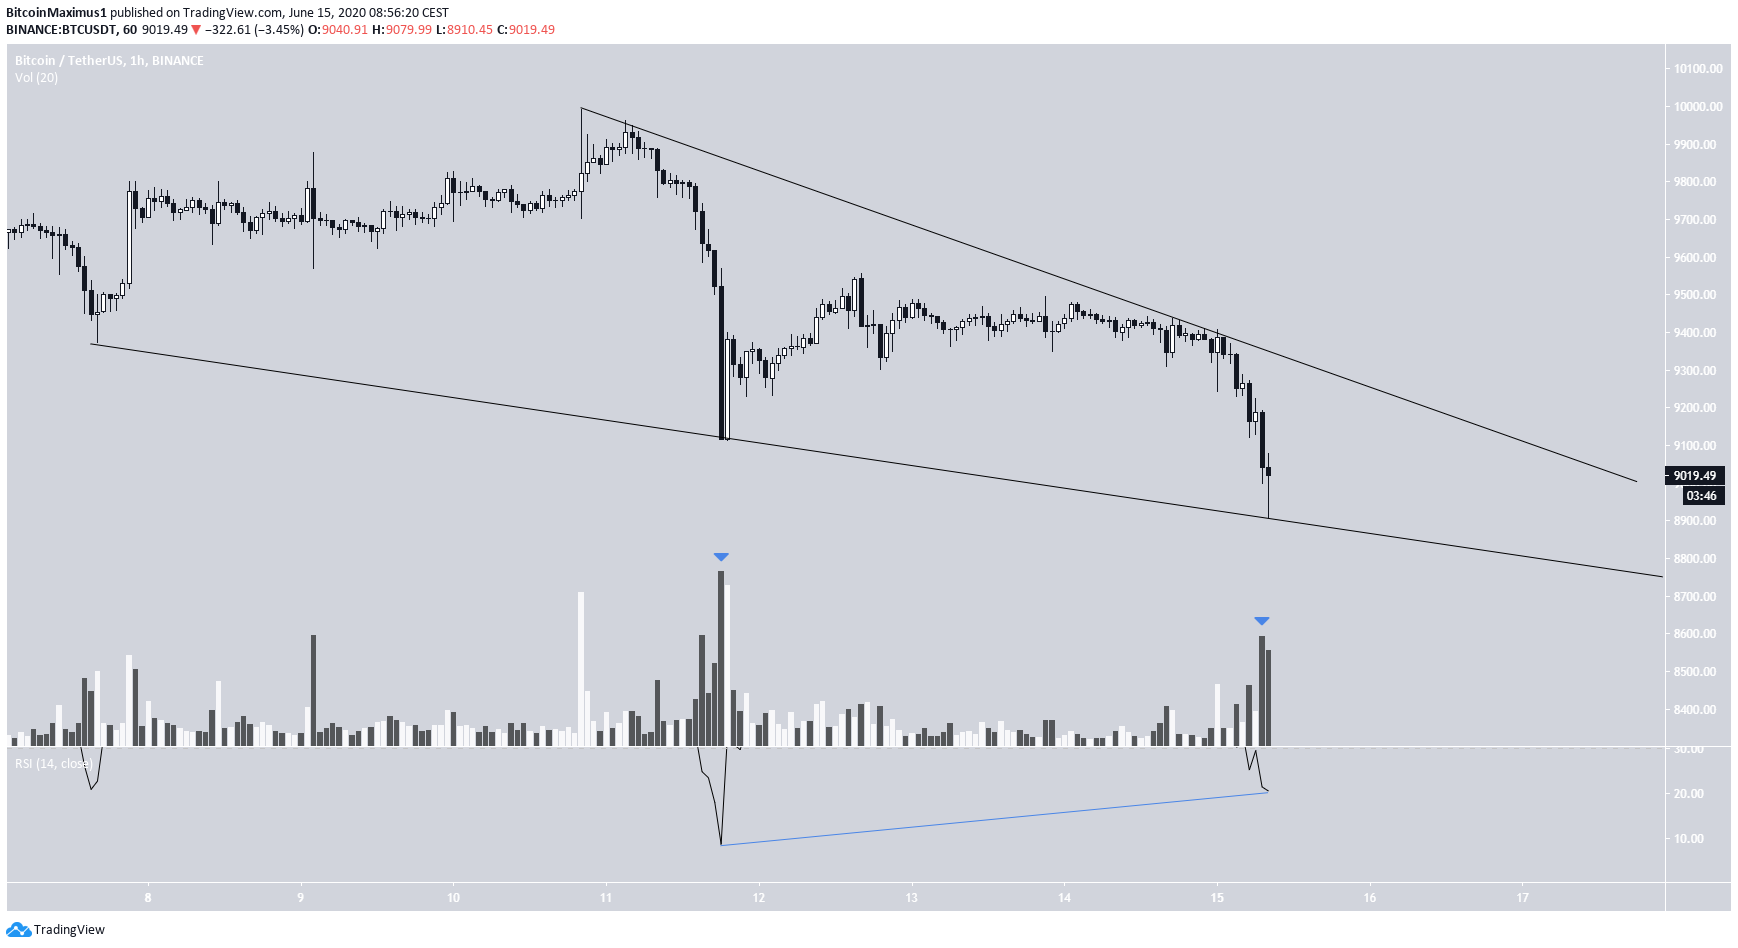
In the hourly chart, we can see that Bitcoin is possibly trading inside of a descending wedge — which is considered a bullish reversal pattern.
Additionally, while the price has decreased more than it did on June 12, the volume has been lower. This has generated bullish divergence in the hourly RSI — a sign that a reversal is near.
A continued decrease within the wedge after validating the support/resistance once more would take the price to the $8800 support area previously mentioned.
To conclude, the Bitcoin price has been decreasing considerably since reaching a high of $10,429 on June 2. However, it is trading inside a bullish short-term pattern and showing considerable signs of reversal — suggesting that a short-term upward move is likely to occur.
For our previous analysis, click here.



