


The Bitcoin Dominance Rate (BTCD) has been increasing significantly over the past three months and is very close to reaching an important resistance area.
Nevertheless, the rate has begun to show some weakness, indicating that a short-term decline could occur before BTCD resumes its upward trend.
Long-Term Levels for the Bitcoin Dominance Rate
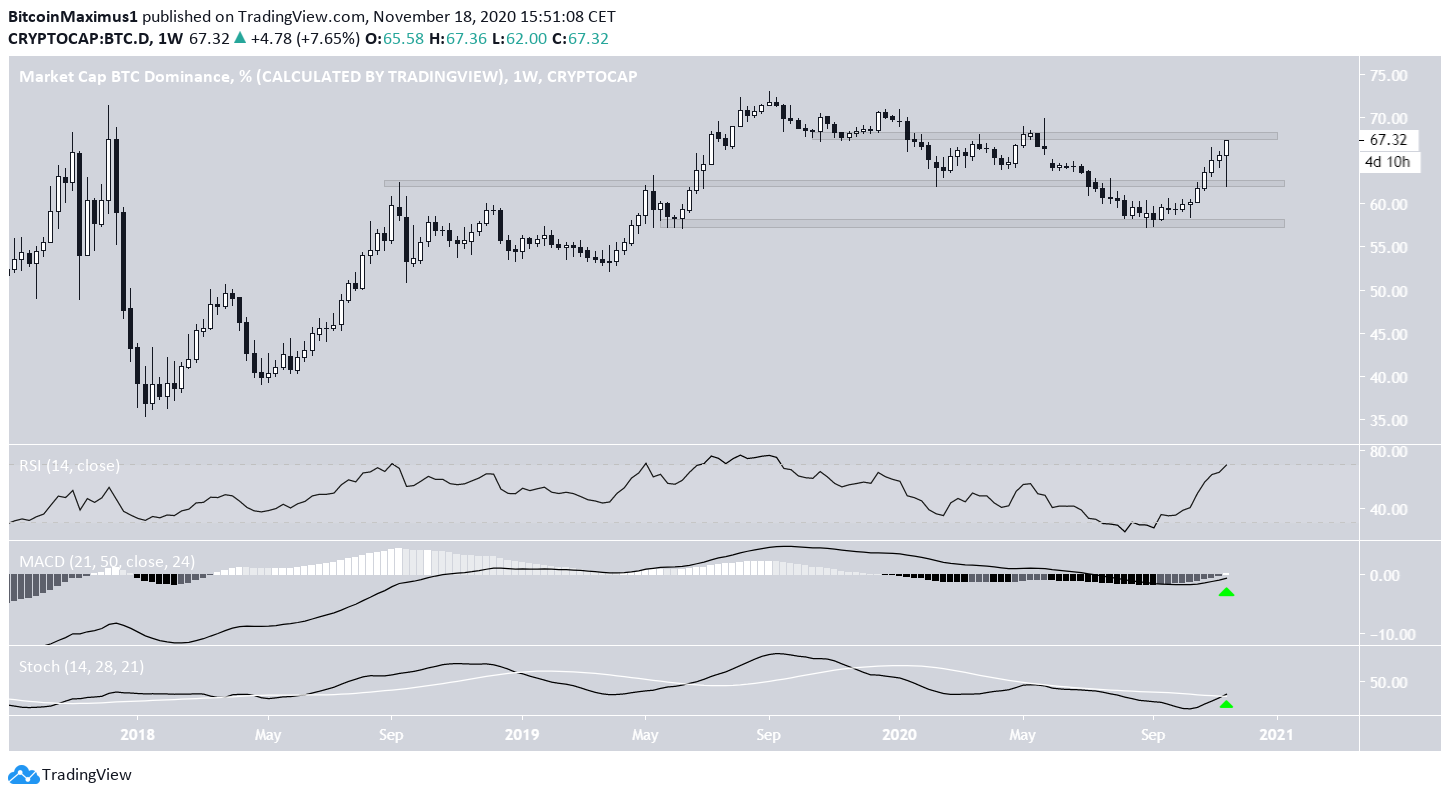
The BTCD has been increasing since the end of Aug when it reached a low of 57.21%. The ascent continued above the minor resistance level of 62.5%, taking BTCD near the next resistance area at 68%.
Technical indicators on the weekly time-frame are bullish. All three of the: MACD, RSI, and Stochastic Oscillator are increasing, with the latter having made a bullish cross and the MACD just reaching positive territory.
Therefore, the long-term trend is likely bullish.
Cryptocurrency trader @TheEuroSniper outlined a Bitcoin dominance chart (BTCD), stating that the rate is likely to do a final push into resistance at 68%, before eventually dropping sharply towards 54%.
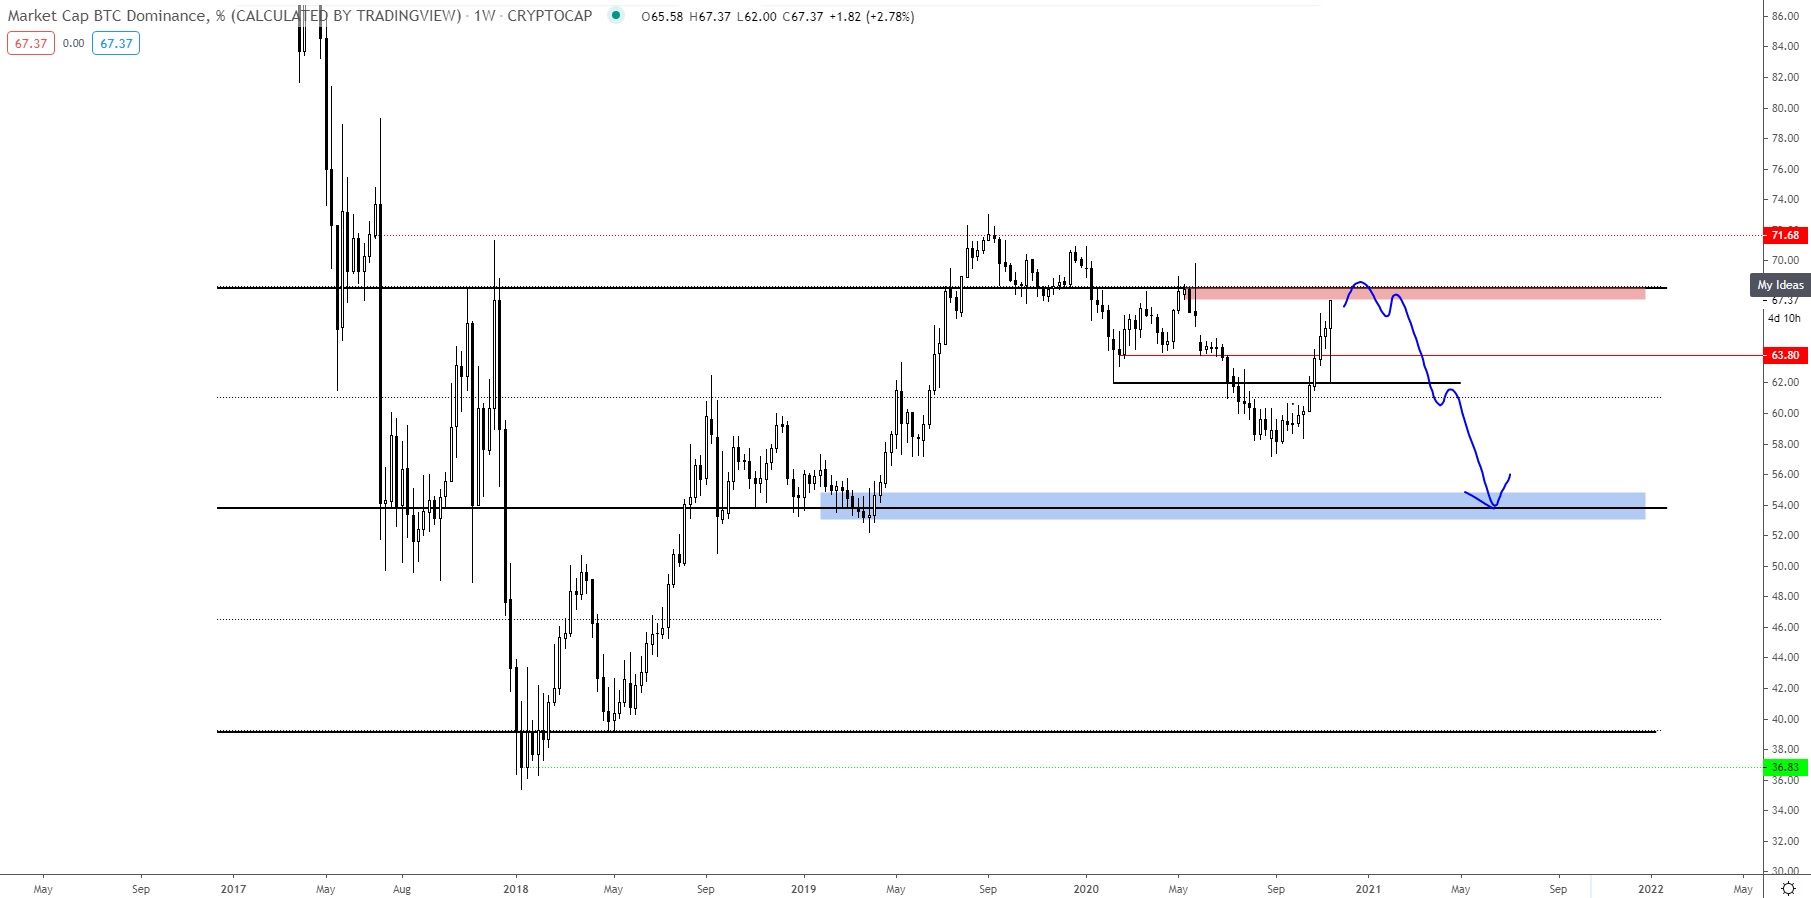
Both the resistance and support levels coincide with those we have drawn up, making this a likely scenario if BTCD were to get rejected at 68%.
Possible Rejection
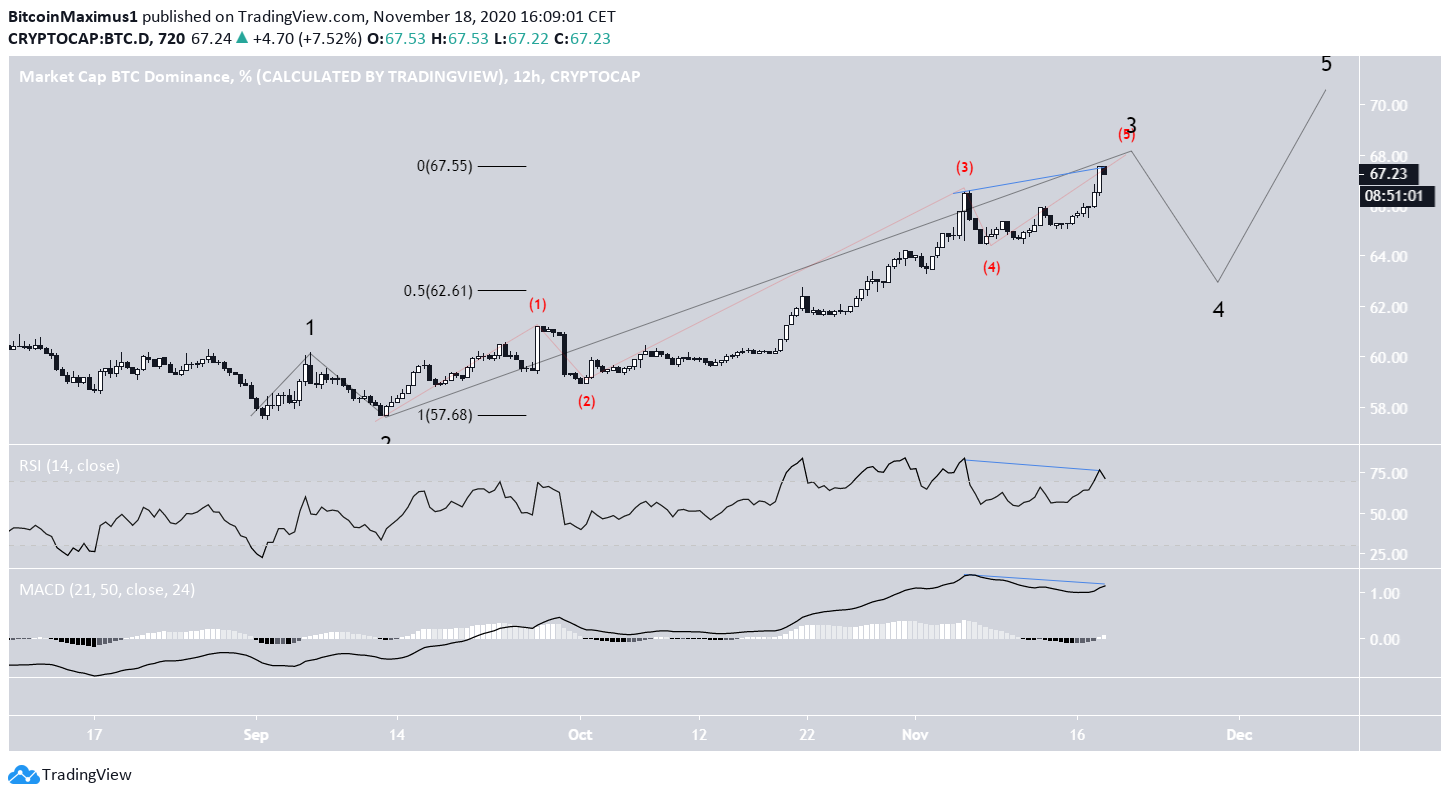
The shorter-term 12-hour chart supports the possibility of a rejection since it shows that BTCD has completed a double-top pattern. There is also bearish divergence on both the RSI and the MACD.
Furthermore, it seems that BTCD has completed an extended third wave (shown in black below) of a five-wave bullish impulse, and is currently correcting inside wave four.
A likely level for the wave to end would be near 62.5%, the 0.5 Fib retracement level of wave three and the previously outlined minor support level.
ETH/BTC
Since ETH is the largest altcoin, an increase in the ETH/BTC price usually causes a drop in BTCD.
ETH/BTC is approaching a strong support area at ₿0.0255, which could reverse the bearish trend. Technical indicators support this move since the RSI is in the process of generating bullish divergence and the Stochastic Oscillator has made a bullish cross.
This movement would fit with one final rally in BTCD before alts get some type of relief rally.

Conclusion
To conclude, BTCD should drop in the short-term, providing some relief for altcoins, before eventually resuming its upward trend.
For BeInCrypto’s previous Bitcoin analysis, click here!
Disclaimer: Cryptocurrency trading carries a high level of risk and may not be suitable for all investors. The views expressed in this article do not reflect those of BeInCrypto


