


SushiSwap (SUSHI) has shown strength by creating a long lower wick on Sept 9, validating the $9.40 area as support.
The token is trading inside a short-term descending parallel channel, a breakout above which could trigger a sharp upward movement.
SUSHI re-tests support
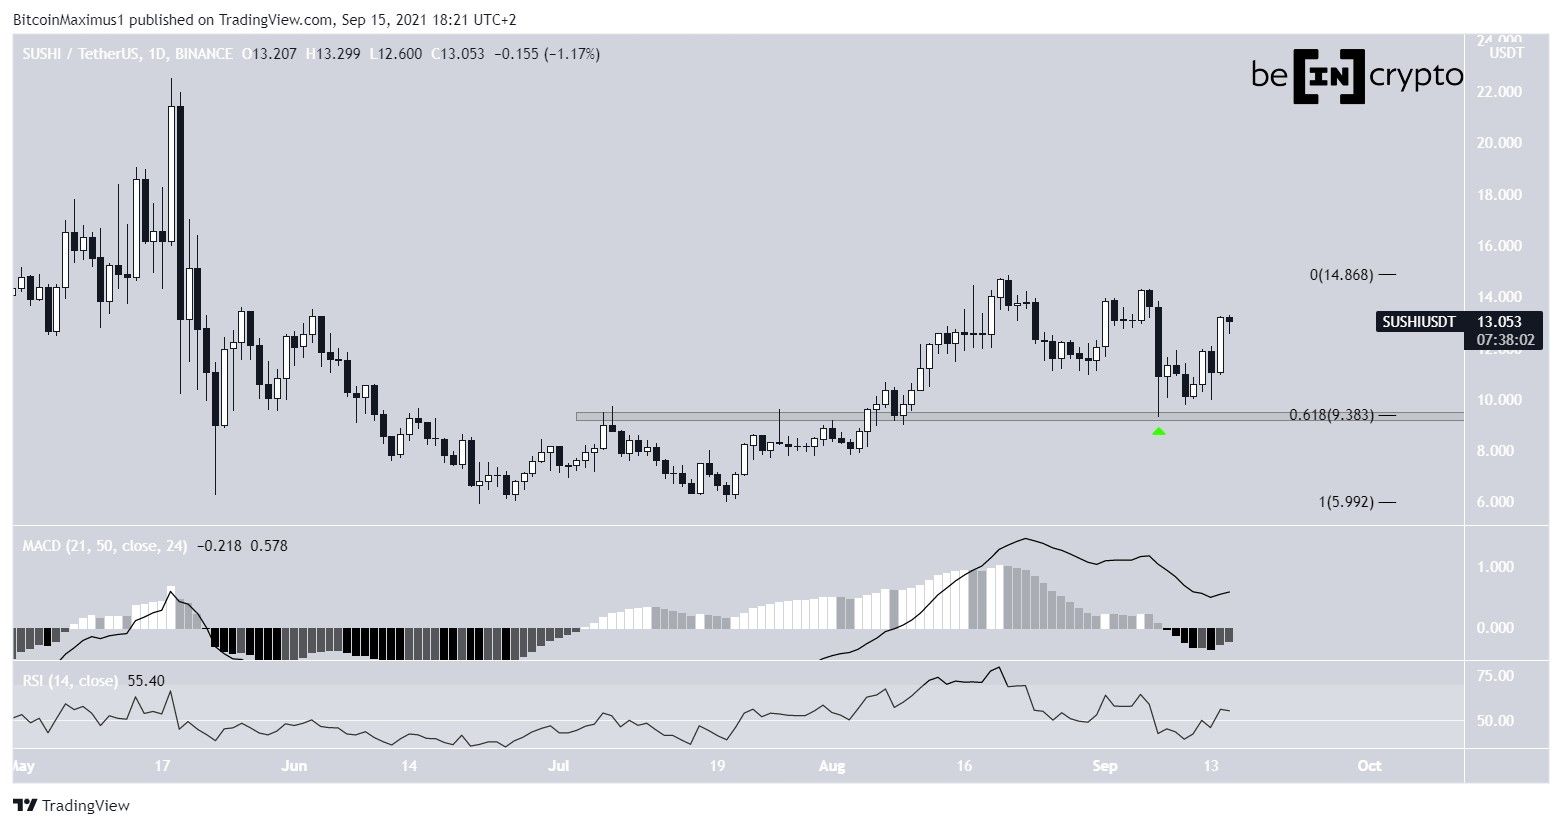
SUSHI has been moving upwards since June 22. On July 20, it created a higher low and accelerated its rate of increase, breaking out above the $9.40 area on Aug 6.
This led to a high of $14.85 on Aug. 11. While the token has been moving downwards since, it bounced strongly once it reached the $9.40 area, which is now acting as support. Furthermore, the area coincided with the 0.618 Fib retracement support level.
SUSHI created a long lower wick on Sept 7 and has been moving upwards since.
Technical indicators support the continuation of the upward movement. The MACD is increasing and has nearly given a bullish reversal signal. The RSI has just moved above 50.
If SUSHI manages to move above the $14.85 area, there is virtually no resistance until the $22 all-time high level.
Cryptocurrency trader @CryptoTony stated that is SUSHI manages to hold the $10.30 lows, it is likely to make an upward movement towards the previous highs. This fits perfectly with the analysis presented above.

Correction complete?
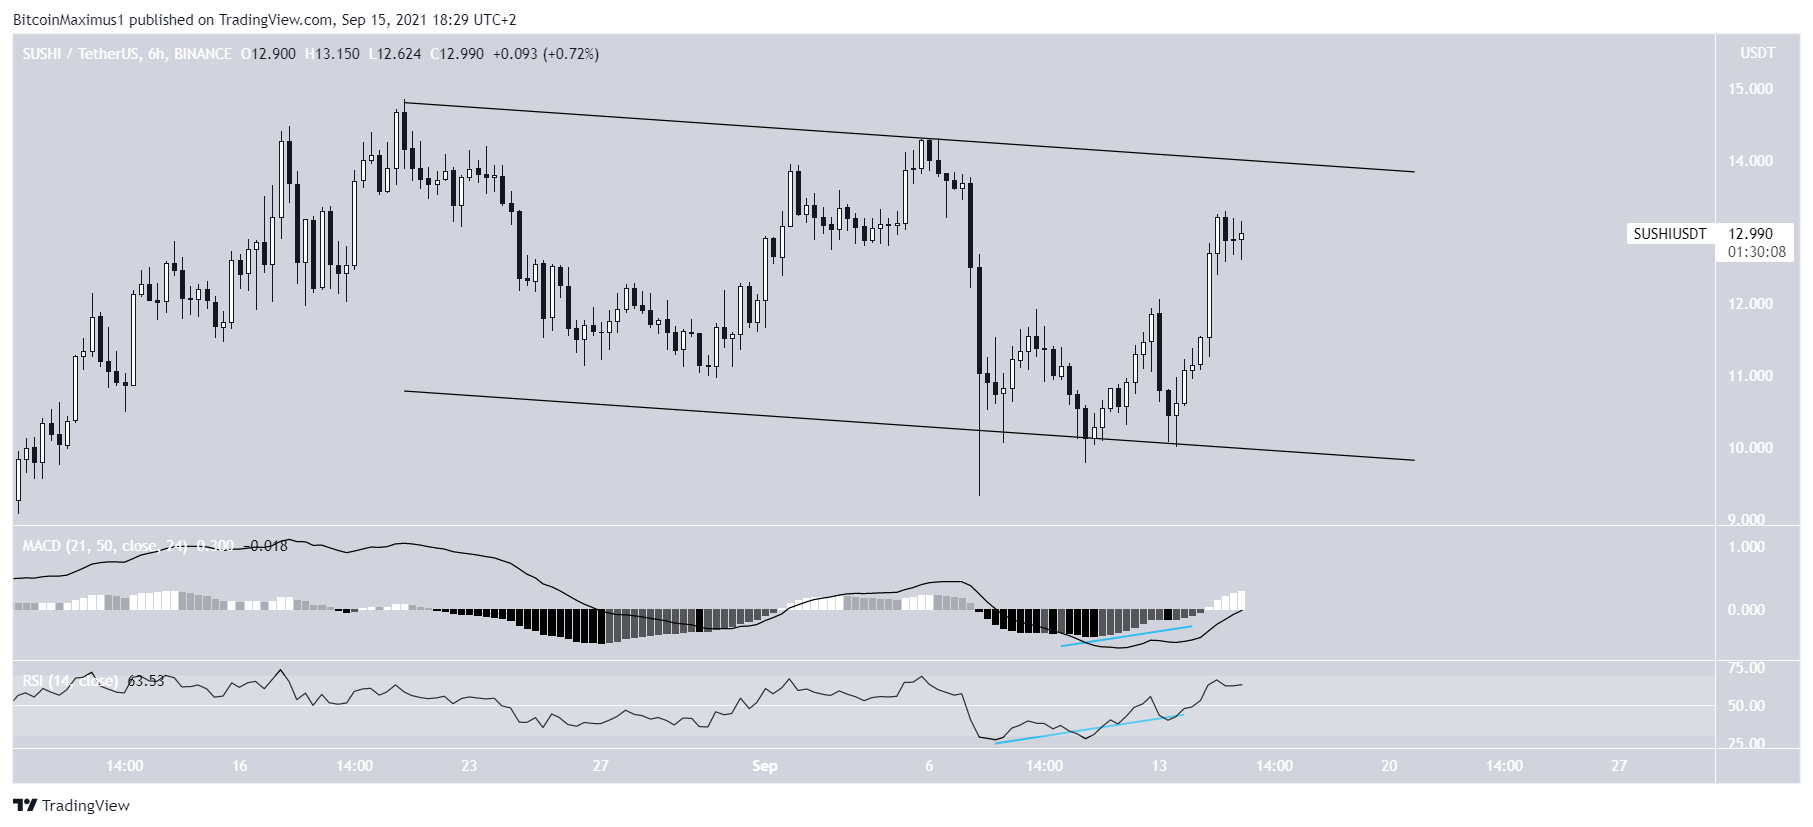
The shorter-term six-hour chart shows that SUSHI is trading inside a descending parallel channel. The movement inside the channel is gradual and choppy, indicative that it was corrective.
The ongoing upward movement began after the token bounced at the support line of the channel, and both the RSI and MACD created bullish divergences.
Therefore, a breakout from the channel would be likely.
Wave count
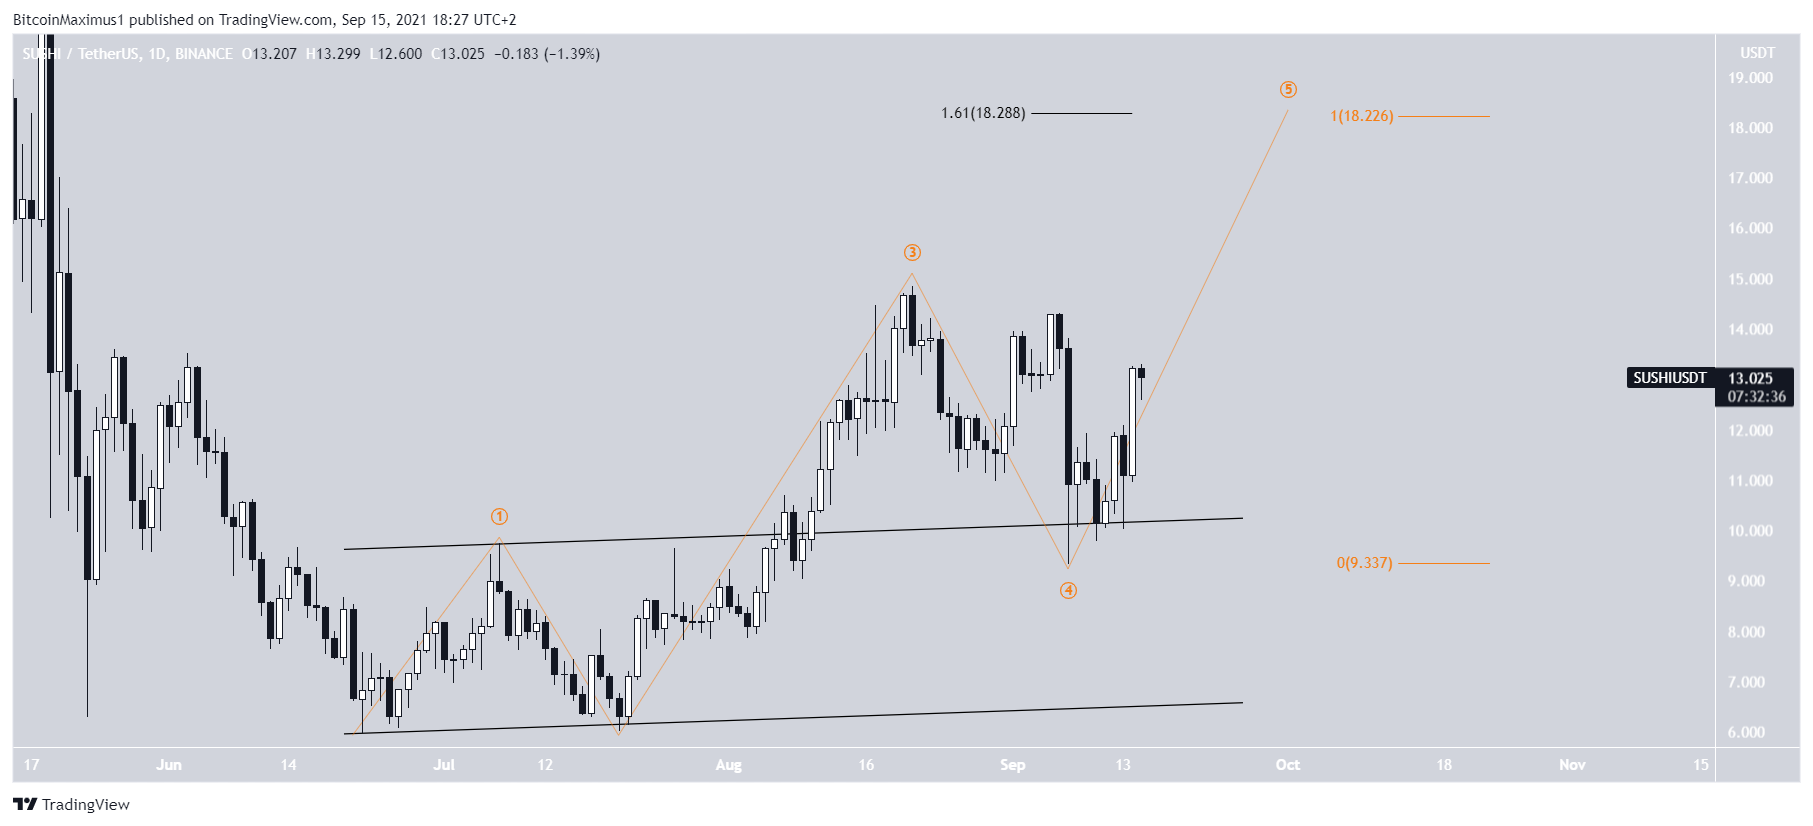
Going back to the daily chart, it is possible that SUSHI has completed a fourth wave pullback and is now in the fifth and final wave of the impulse.
The most likely target for the top of the movement is between $18.22 and $18.28. The target is found using the 1.61 external Fib retracement level (black) and the length of waves 1-3 (orange).
For BeInCrypto’s latest Bitcoin (BTC) analysis, click here.
