

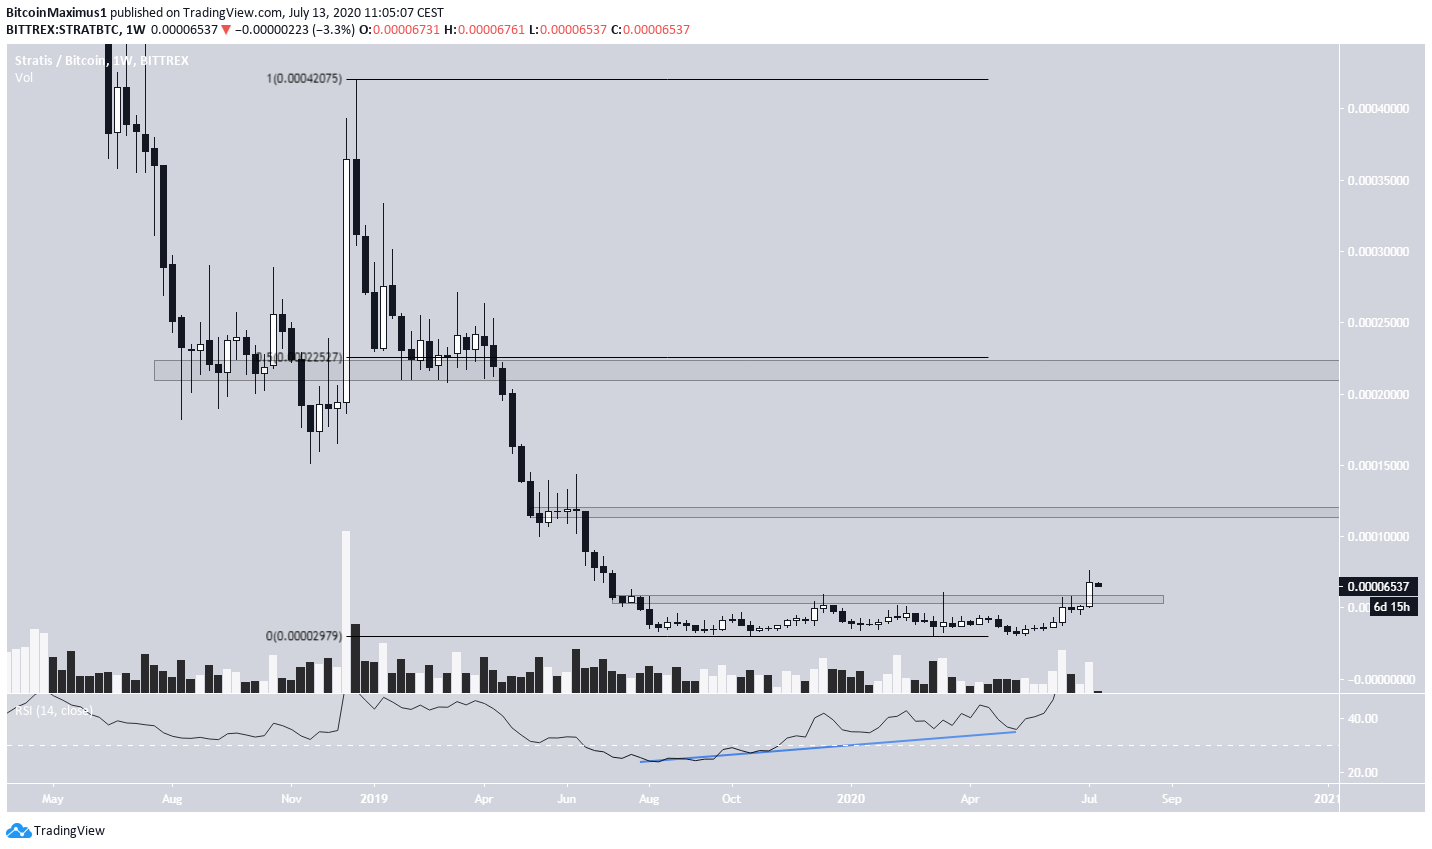
The Stratis (STRAT) price has broken out from a resistance area that had previously been in place since August 2019.
After a decrease that validates this area as support, the STRAT price is expected to continue moving upwards.
Stratis Breaks Out
The STRAT price had been facing resistance from the 5,700 satoshi level since December 2019. After three unsuccessful breakout attempts, the price was finally able to overtake this resistance on July 8. The price continued to increase until it reached a high of 7,656 satoshis, and has corrected slightly since. The 50 and 200-day moving averages (MA) have made a bullish cross, a sign that STRAT has already begun an upward trend. After a possible re-test of this same resistance area, the price will likely resume its upward movement.

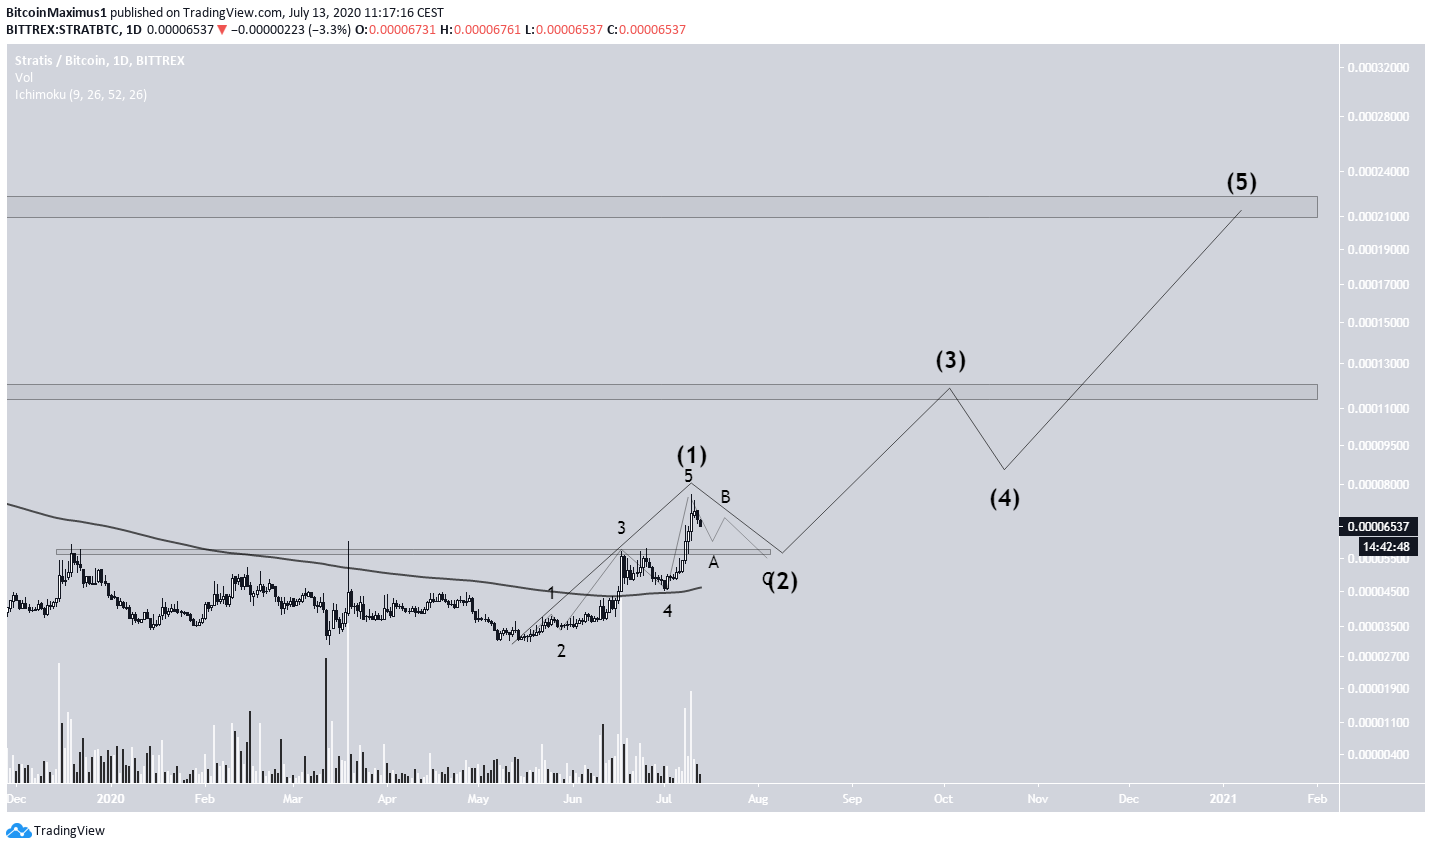
Future Movement
A closer look at the price movement since the upward move began reveals that the price has possibly finished a five-wave Elliott formation. This is visible when drawing an ascending parallel channel connecting wave (2) and (4). After breaking out from the channel, the price dropped to the middle of the channel, completing its fourth wave, before breaking higher once more. Therefore, the price is possibly completing an A-B-C correction, which could end near the 0.5 Fib level at 54,000 satoshis, or slightly lower, at the 0.618 Fib level at 48,500 satoshis.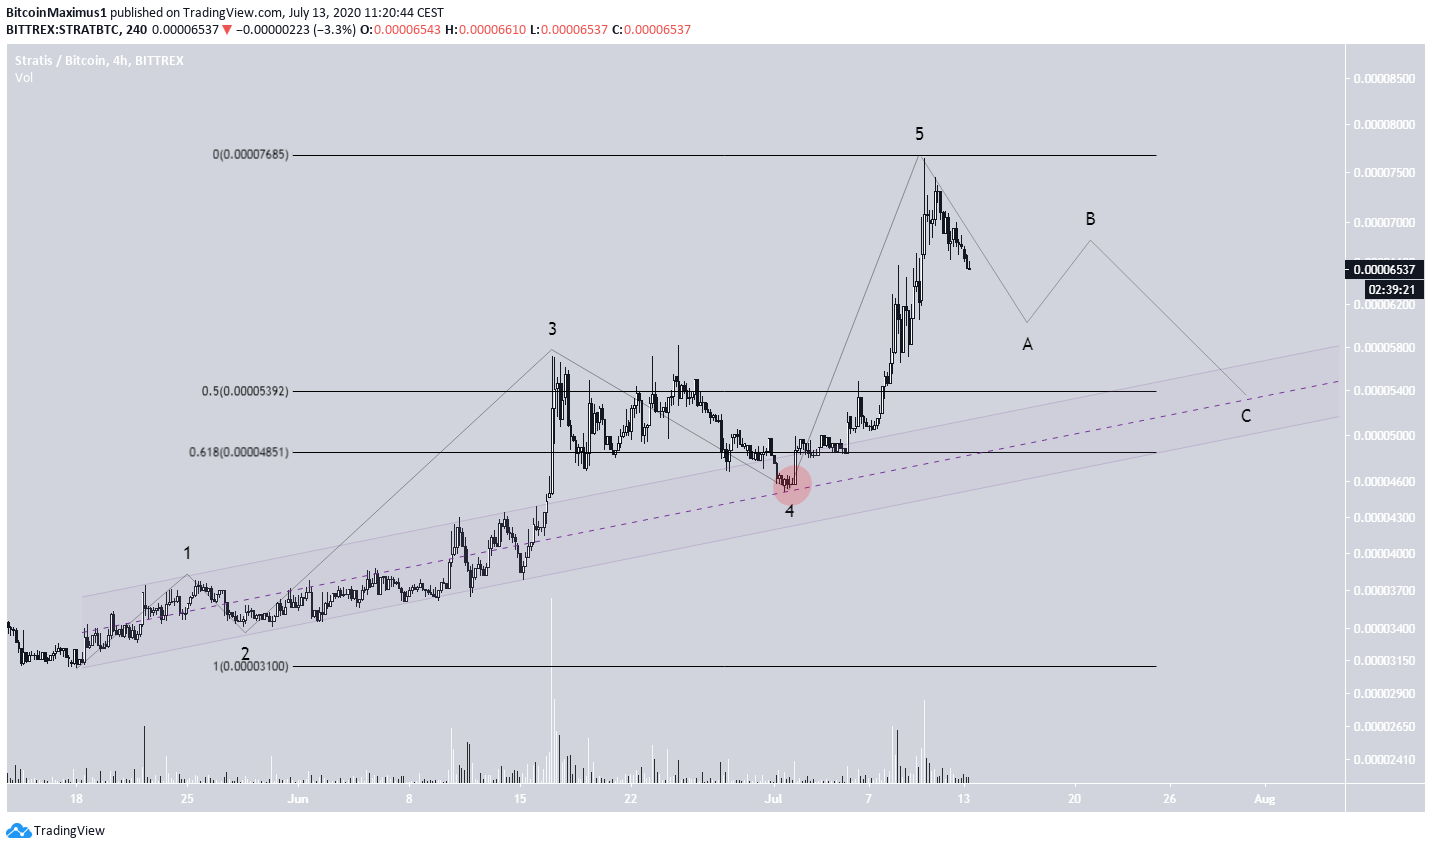
Top crypto projects in the US | April 2024
Trusted
Disclaimer
In line with the Trust Project guidelines, this price analysis article is for informational purposes only and should not be considered financial or investment advice. BeInCrypto is committed to accurate, unbiased reporting, but market conditions are subject to change without notice. Always conduct your own research and consult with a professional before making any financial decisions. Please note that our Terms and Conditions, Privacy Policy, and Disclaimers have been updated.

Valdrin Tahiri
Valdrin discovered cryptocurrencies while he was getting his MSc in Financial Markets from the Barcelona School of Economics. Shortly after graduating, he began writing for several different cryptocurrency related websites as a freelancer before eventually taking on the role of BeInCrypto's Senior Analyst.
(I do not have a discord and will not contact you first there. Beware of scammers)
READ FULL BIO
Sponsored
Sponsored