

On August 4, the Stellar price reached a high of 773 satoshis. A gradual decrease followed. On August 8, XLM reached a low of 602 satoshis. It has been increasing since.
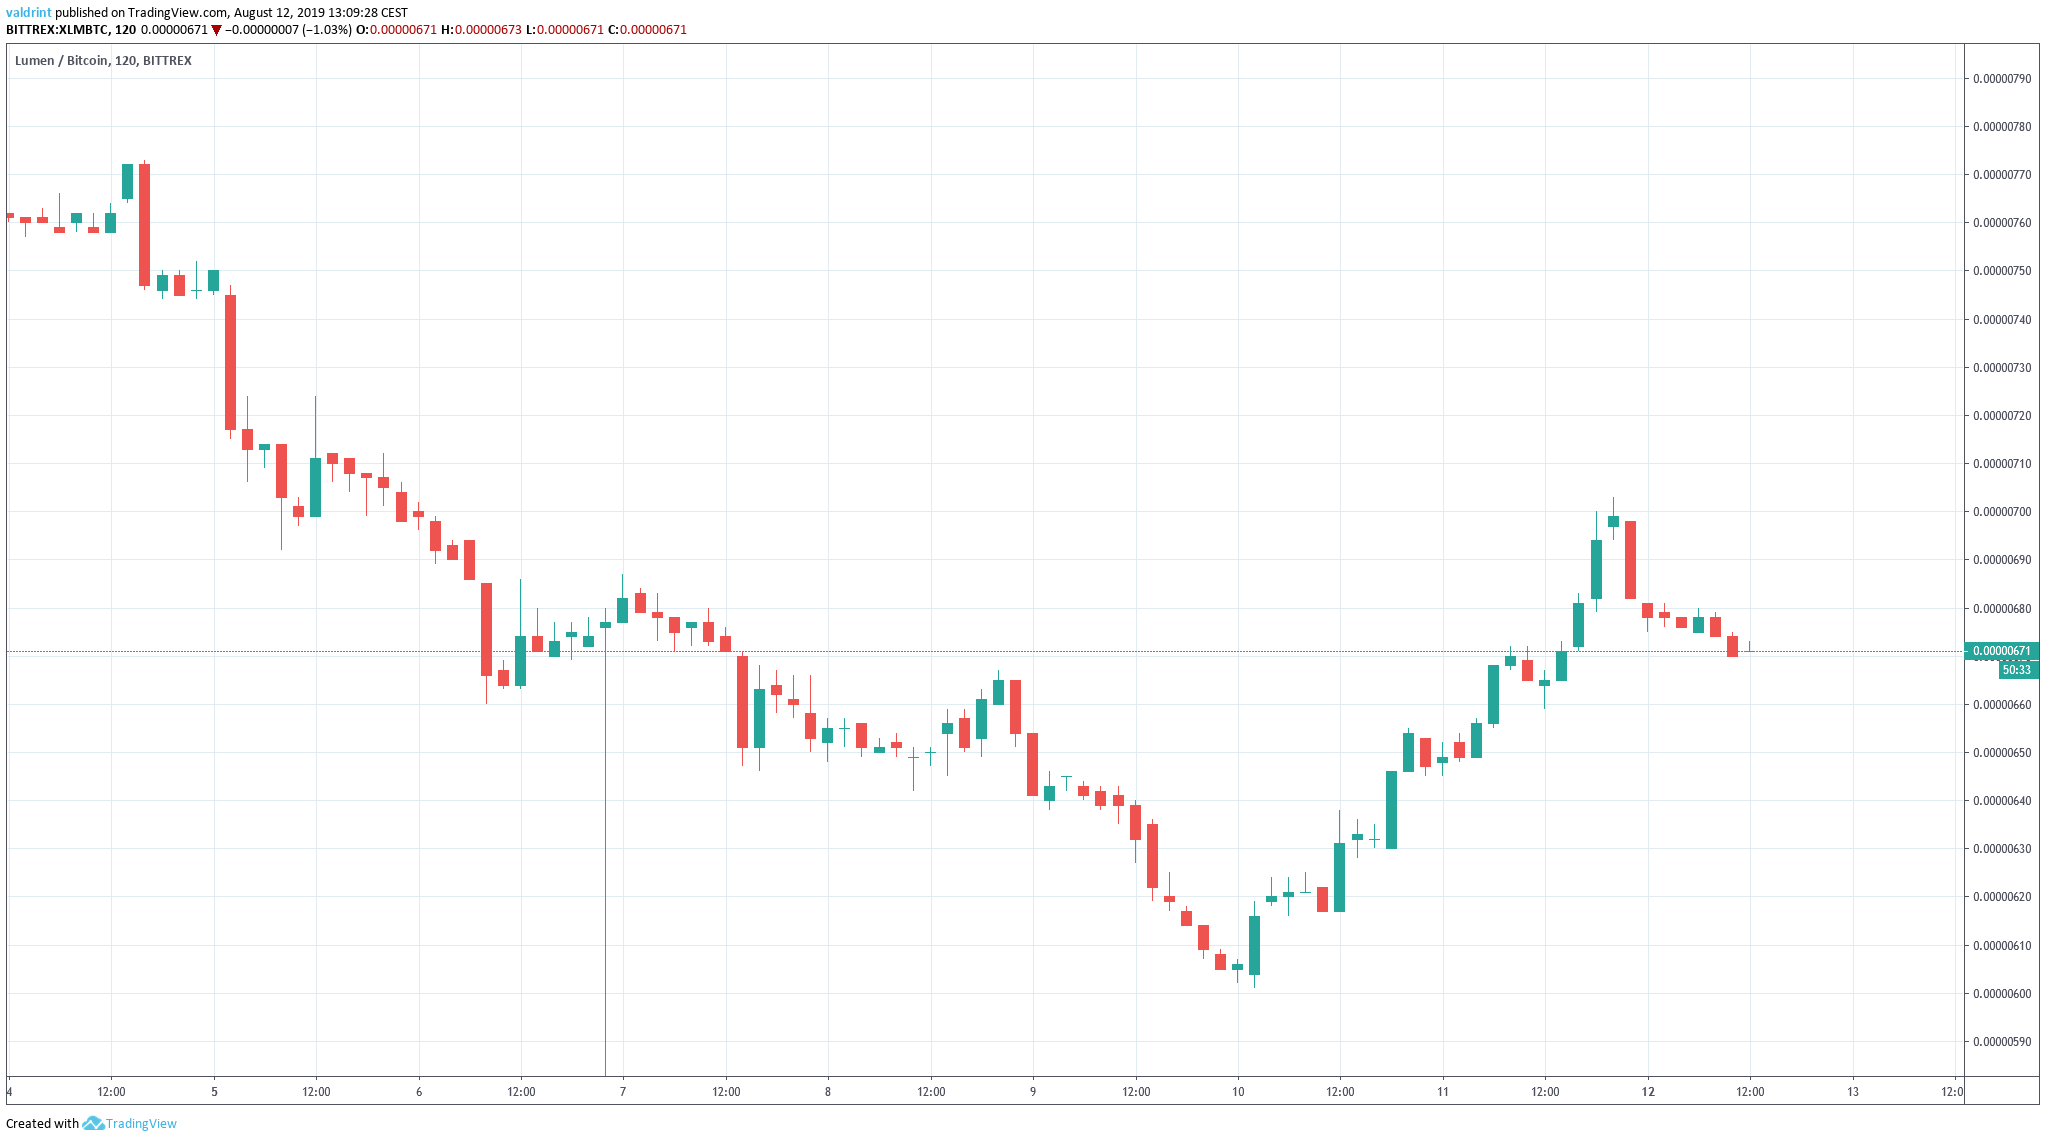 How long will this increase continue for XLM? Continue reading if you are interested in finding out.
For our previous analysis, click here.
If you would like to trade Stellar (XLM) on Binance, click here to sign up for the popular altcoin exchange!
How long will this increase continue for XLM? Continue reading if you are interested in finding out.
For our previous analysis, click here.
If you would like to trade Stellar (XLM) on Binance, click here to sign up for the popular altcoin exchange!
Stellar Price: Trends and Highlights for August 12
- XLM/BTC is trading inside a descending wedge,
- The RSI & MACD have developed bullish divergence.
- There is support at 600 and 380 satoshis.
- There is resistance at 900 and 1300 satoshis.
Long-Term XLM Price Support
A look at the weekly time-frame shows that XLM has been decreasing since November 2018. It also gives us two support areas. Once the XLM price reaches them, it could initiate a reversal.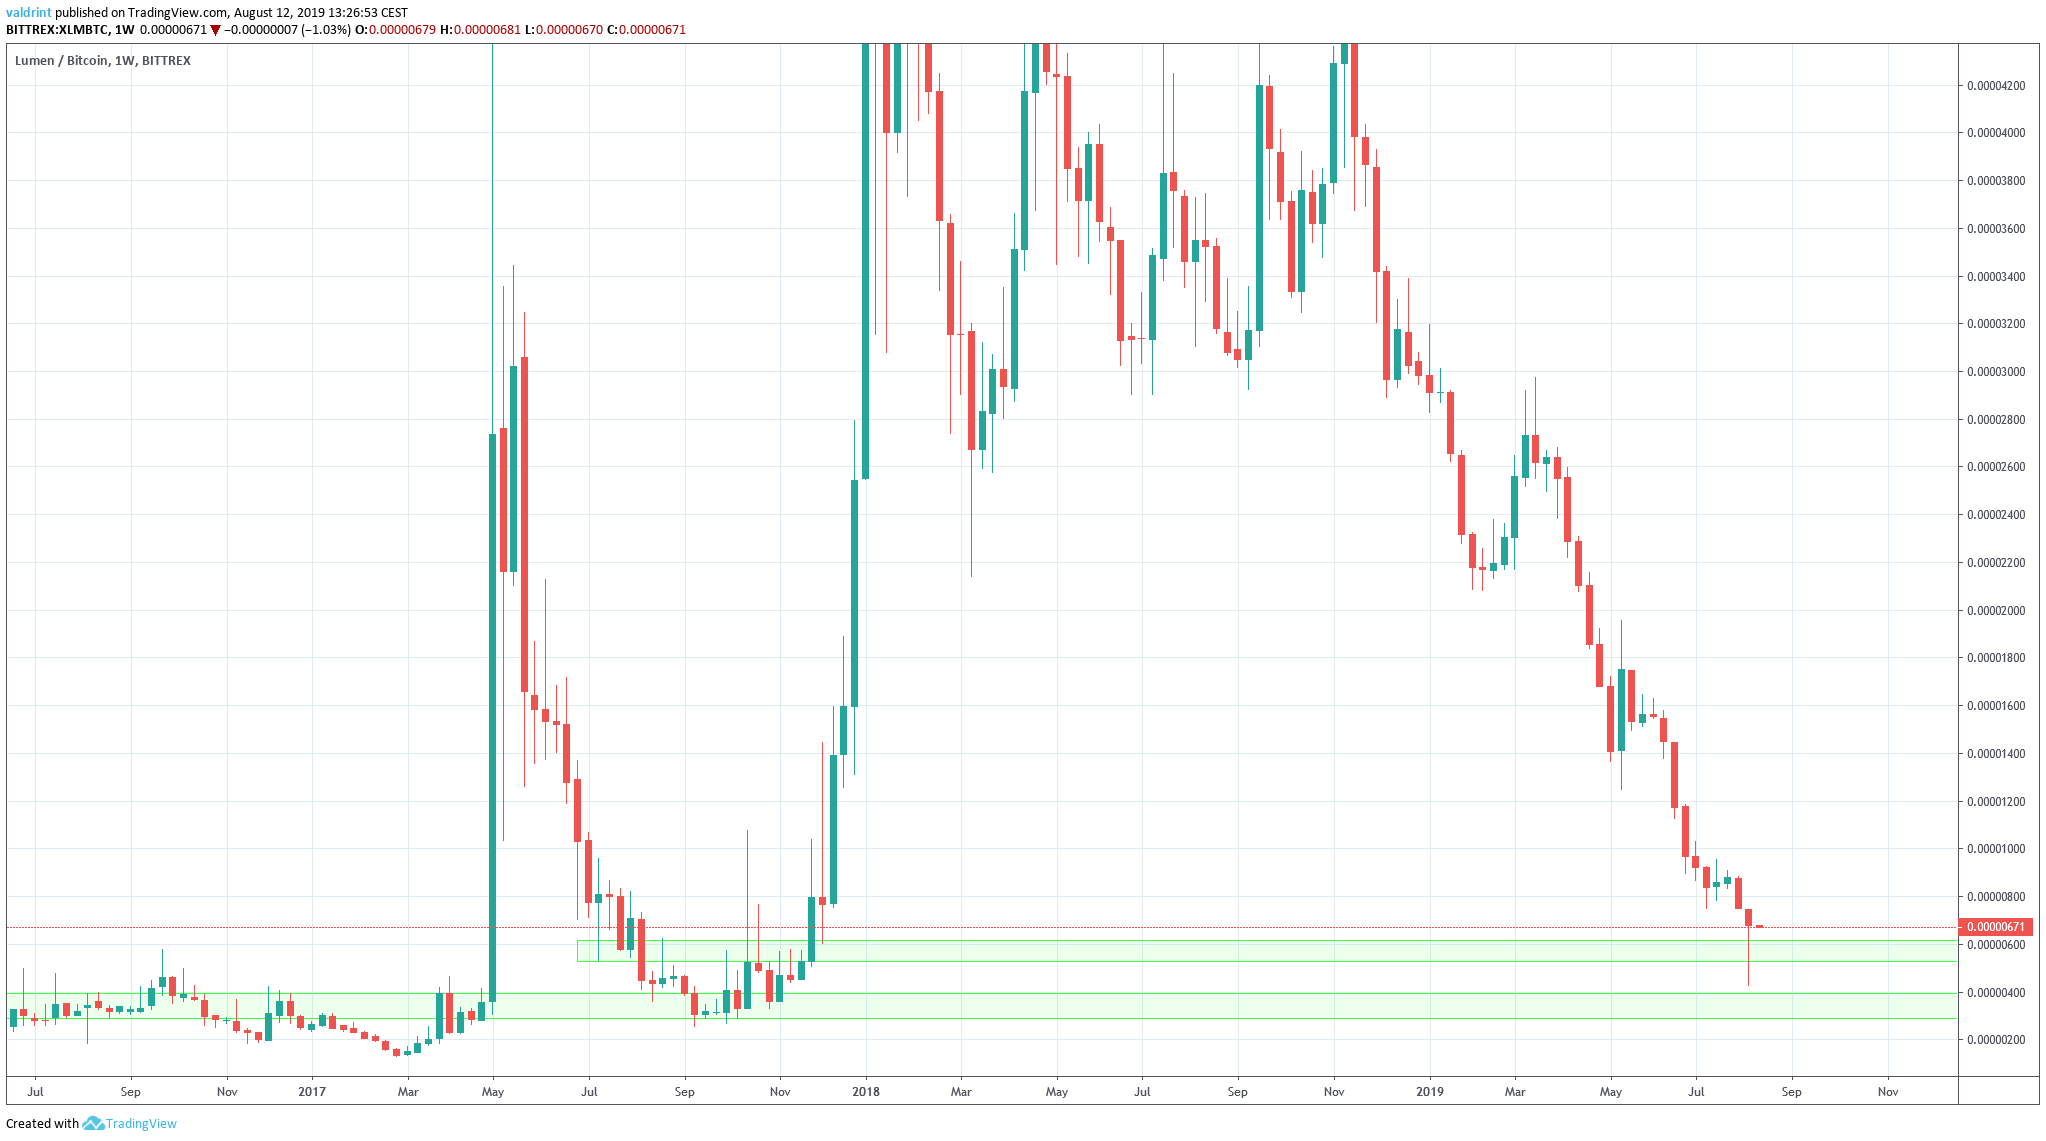 The support areas are found at 600 and 380 satoshis, respectively.
The XLM price has reached the first one but not the second.
This suggests that XLM is in a suitable place for the beginning of an uptrend.
The support areas are found at 600 and 380 satoshis, respectively.
The XLM price has reached the first one but not the second.
This suggests that XLM is in a suitable place for the beginning of an uptrend.
Descending Wedge
A look at the daily time-frame shows that XLM has been trading inside a descending wedge since February. The descending wedge is considered a bullish pattern, making a price breakout more likely.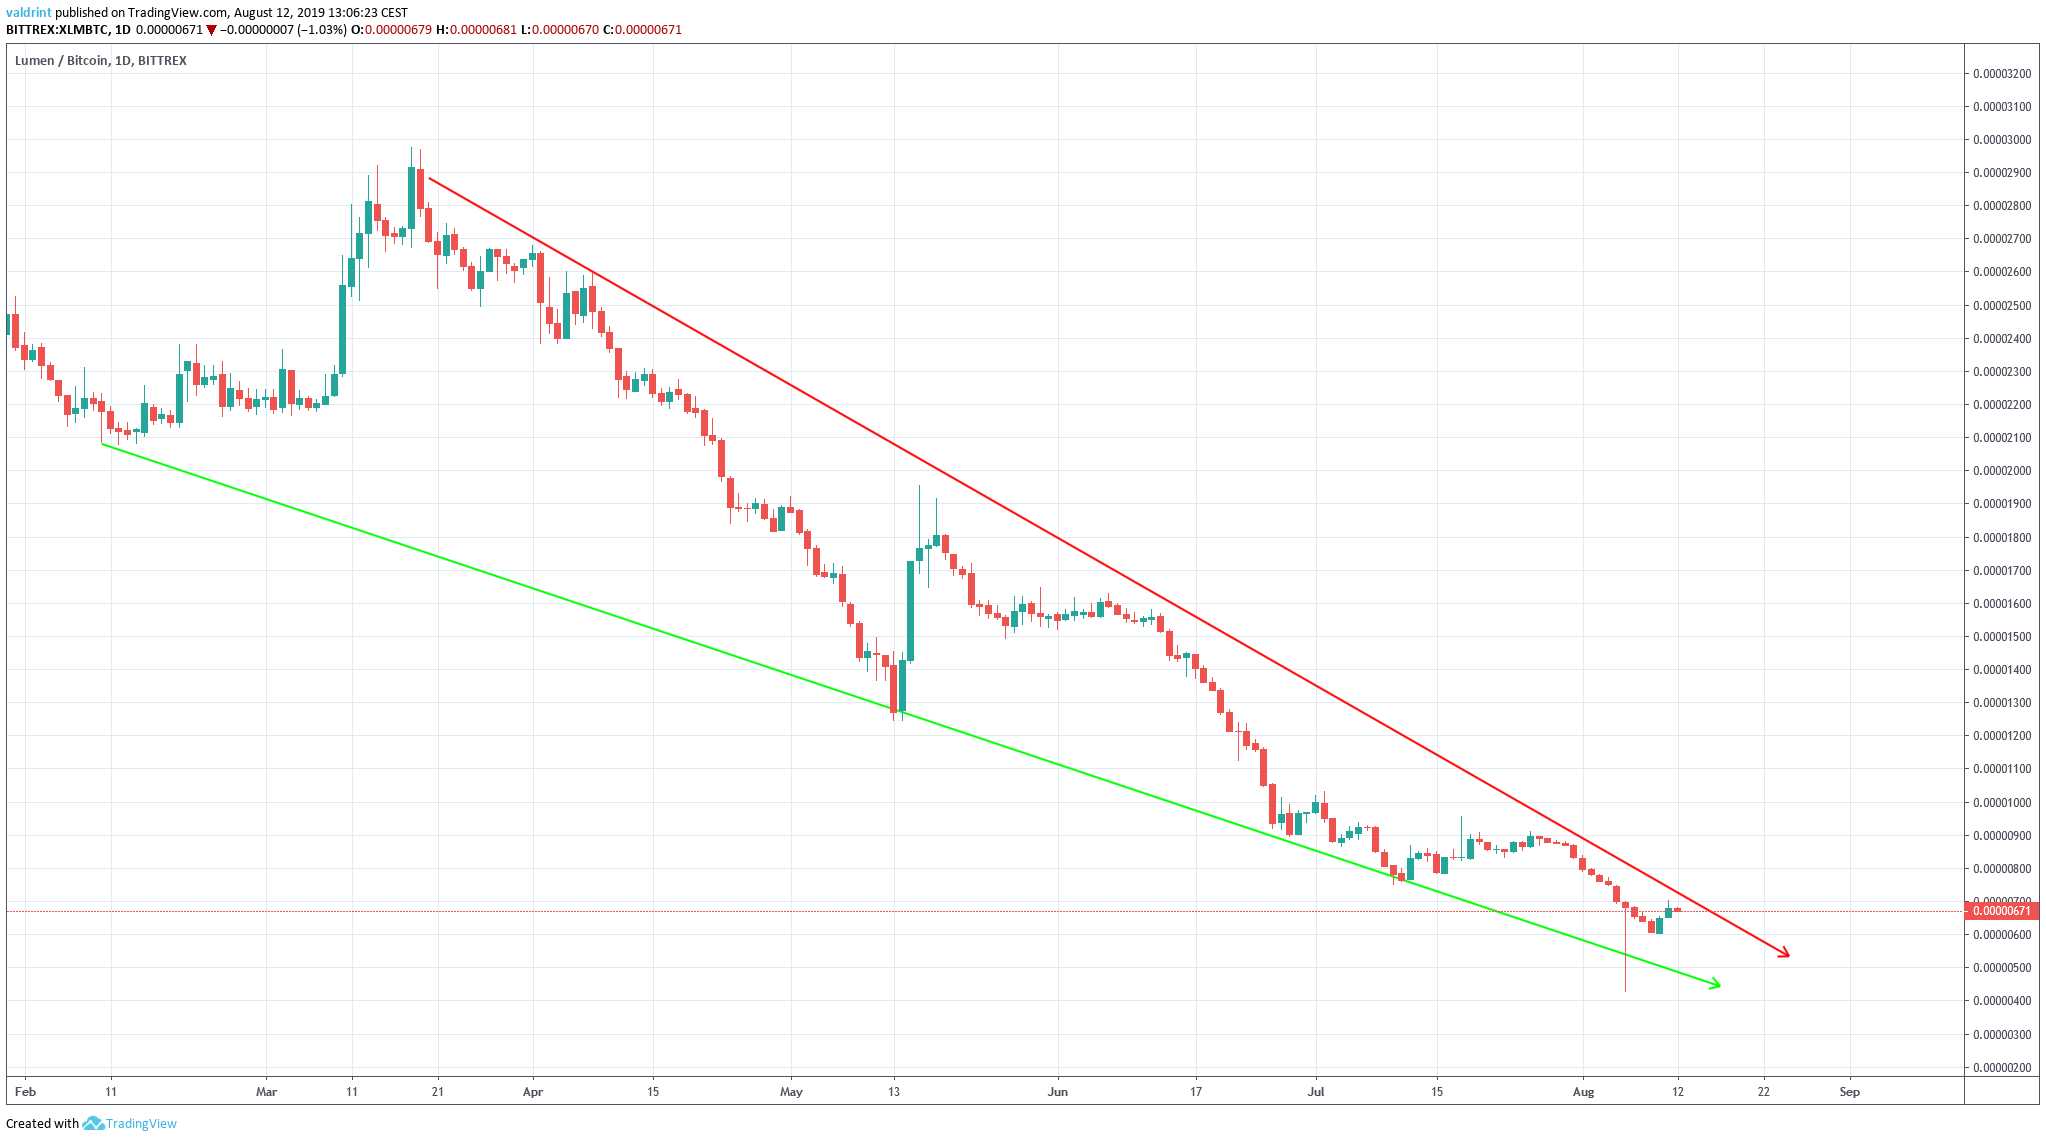 Both the resistance and support lines have been touched several times.
Additionally, XLM is rapidly approaching the projected end of the wedge — at which point a decisive move should occur.
Besides the fact that the descending wedge is a bullish pattern, another bullish sign is given by the massive lower wick of August 6.
Both the resistance and support lines have been touched several times.
Additionally, XLM is rapidly approaching the projected end of the wedge — at which point a decisive move should occur.
Besides the fact that the descending wedge is a bullish pattern, another bullish sign is given by the massive lower wick of August 6.
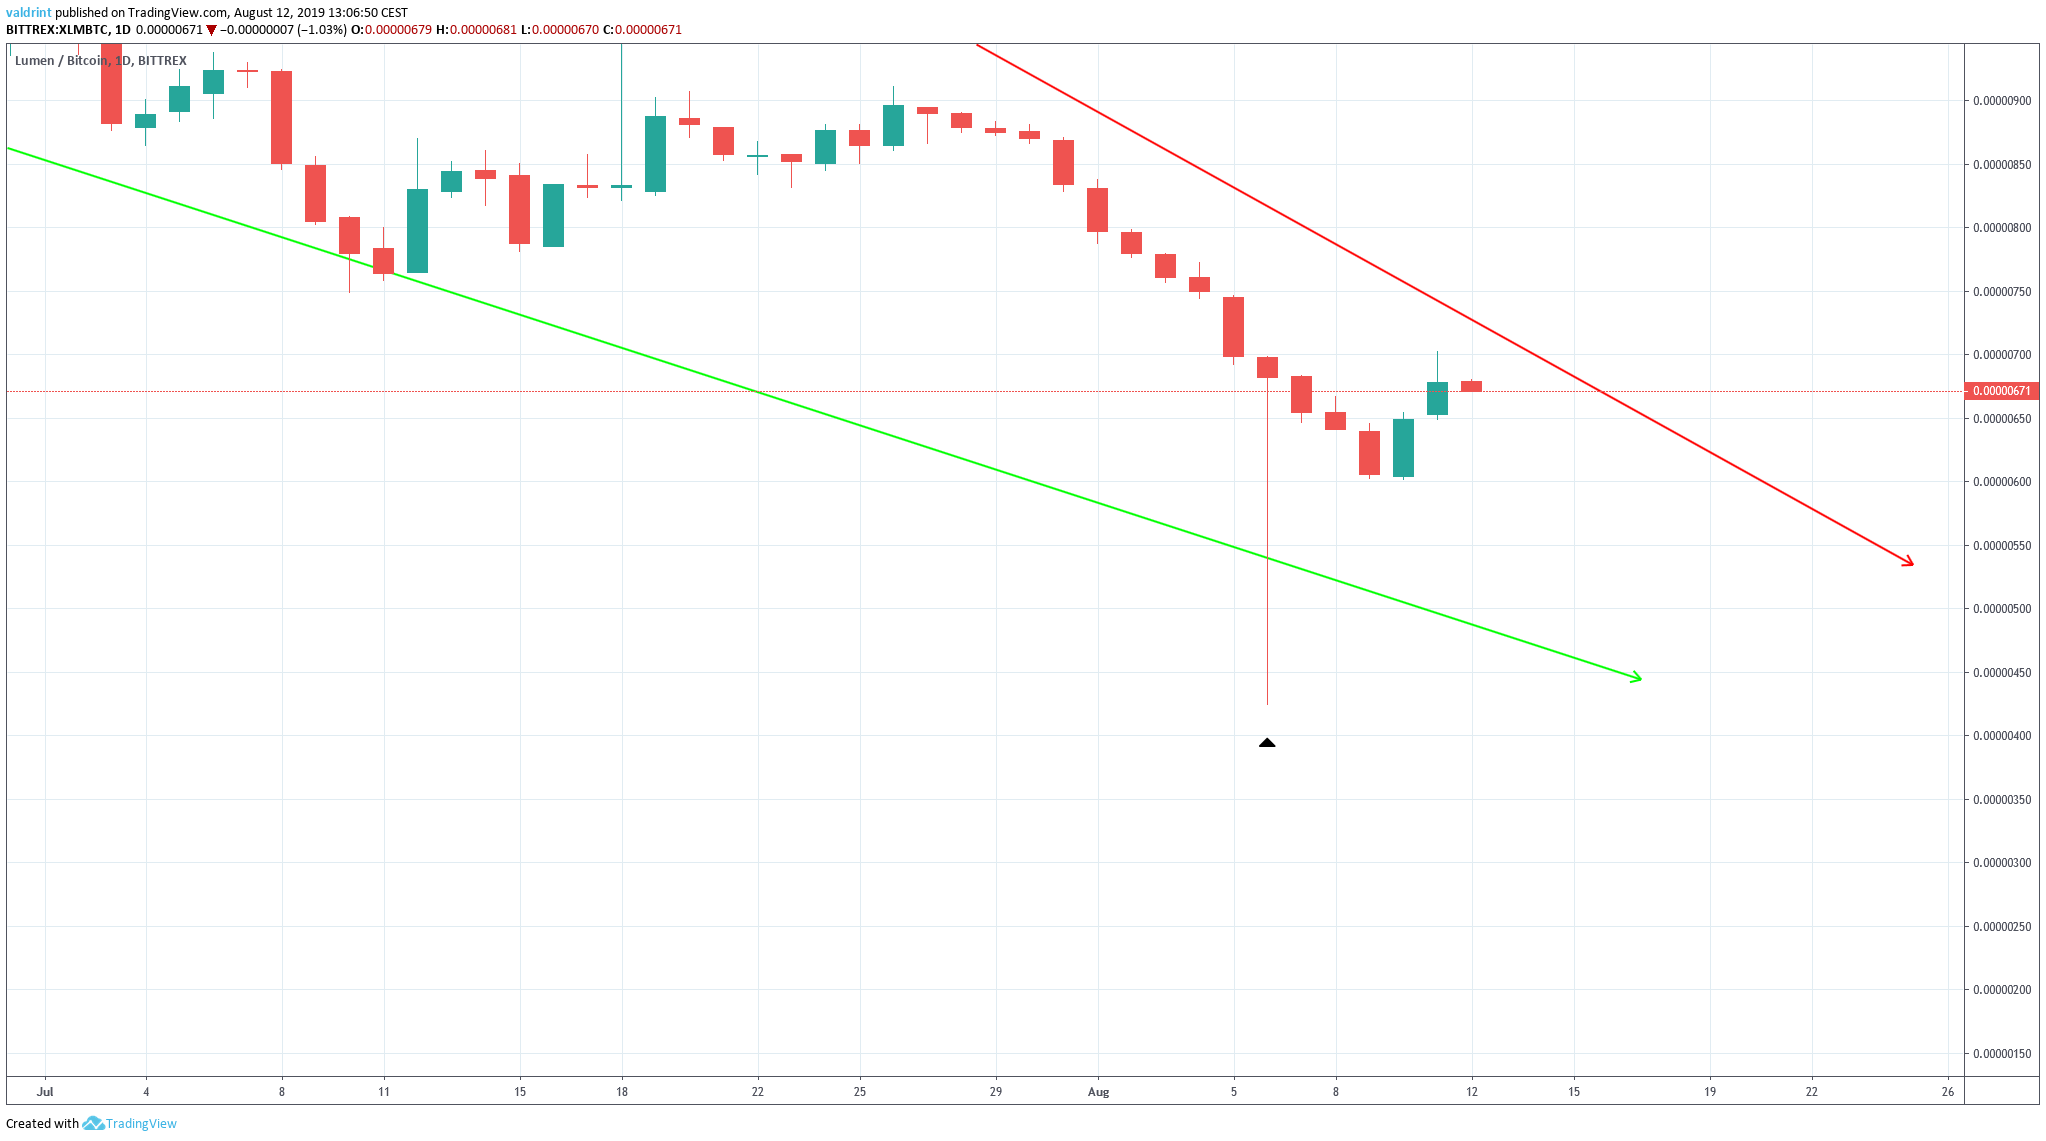 This is a sign of significant buying pressure.
Since it is not present in every exchange, it could just be an anomaly.
However, the RSI and MACD also suggest that a breakout will soon occur.
This is a sign of significant buying pressure.
Since it is not present in every exchange, it could just be an anomaly.
However, the RSI and MACD also suggest that a breakout will soon occur.
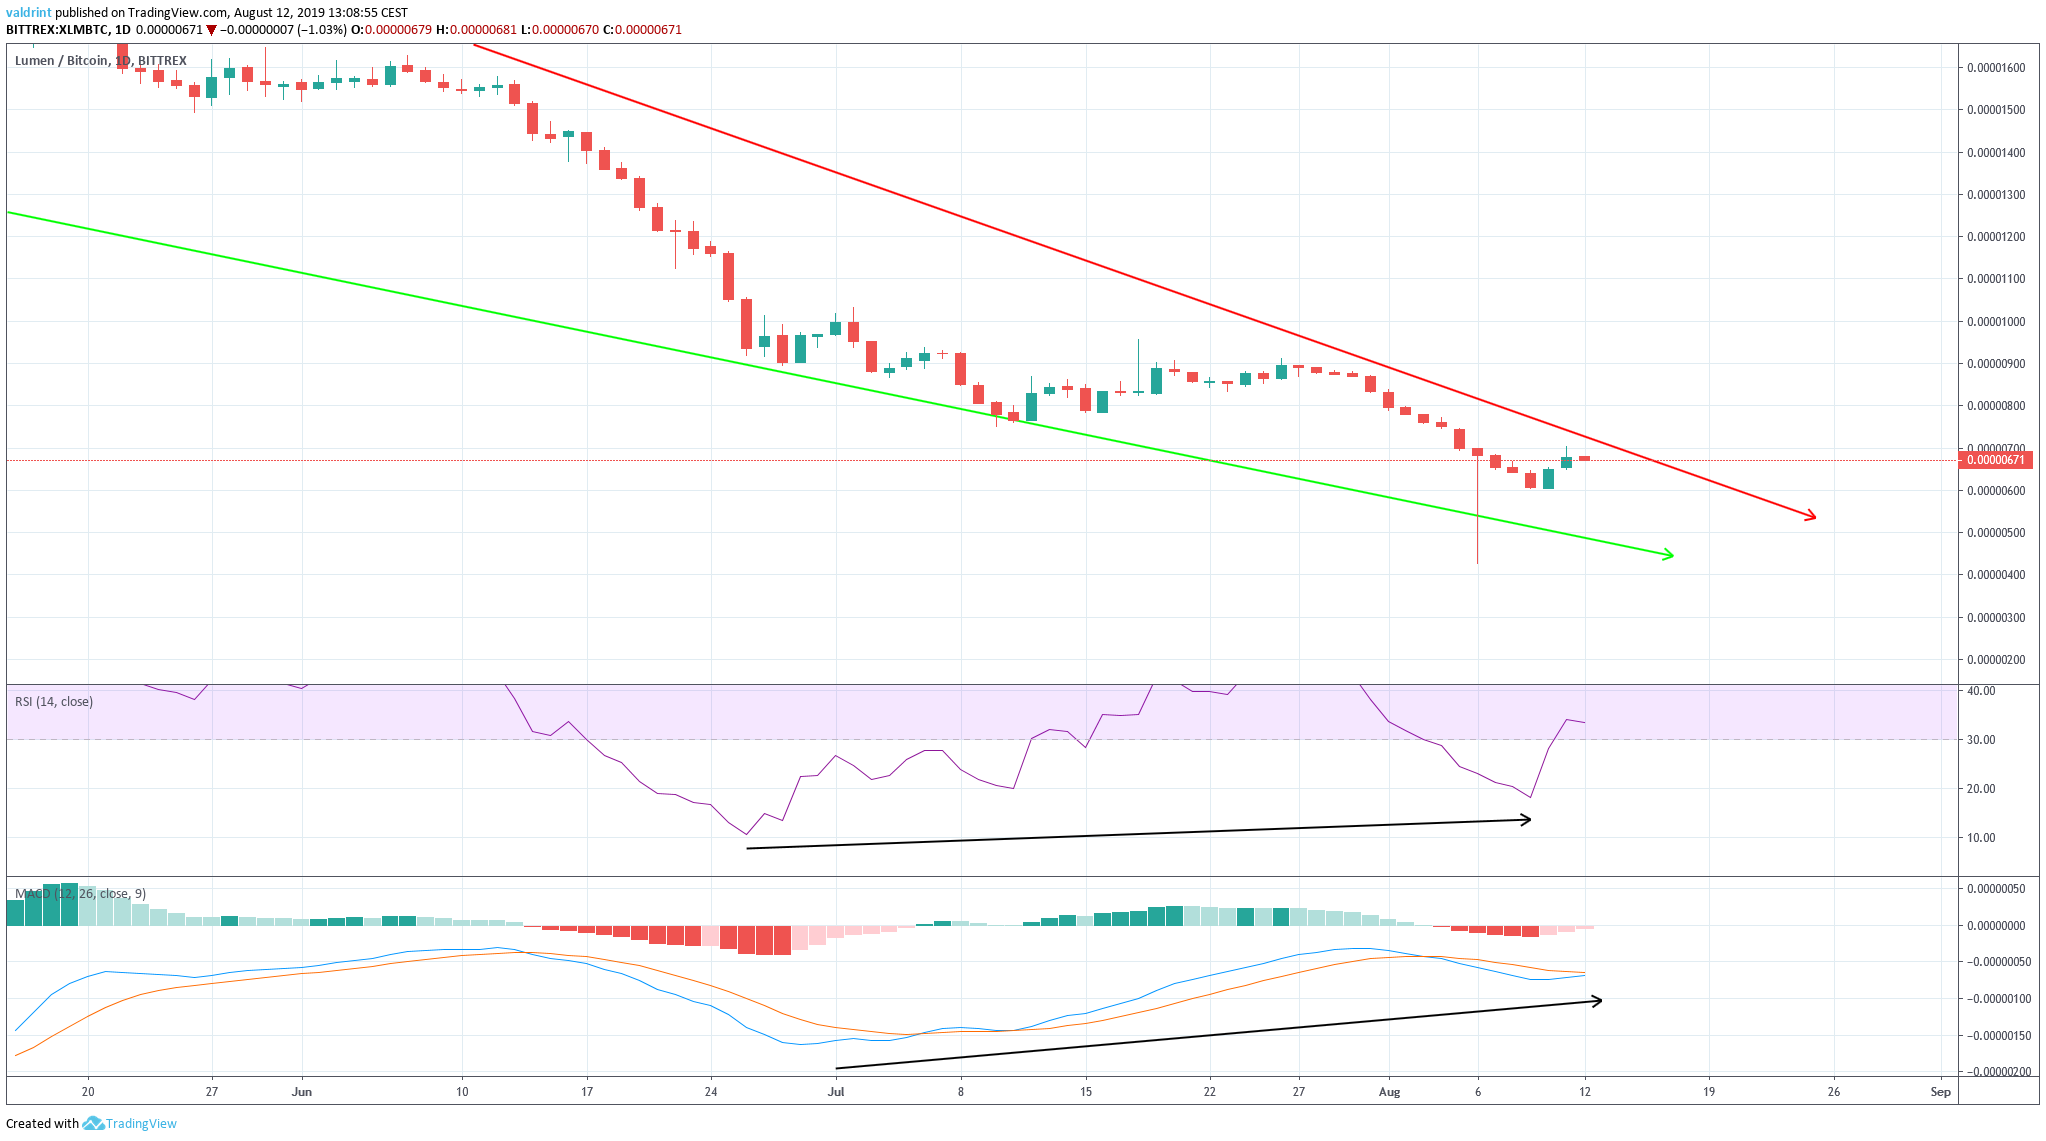 Both have been generating significant bullish divergence since the beginning of July.
Therefore, we believe that the XLM price is likely to break out.
If it does, where will it go next?
Both have been generating significant bullish divergence since the beginning of July.
Therefore, we believe that the XLM price is likely to break out.
If it does, where will it go next?
Future Movement
If a breakout occurs, two resistance areas are outlined below: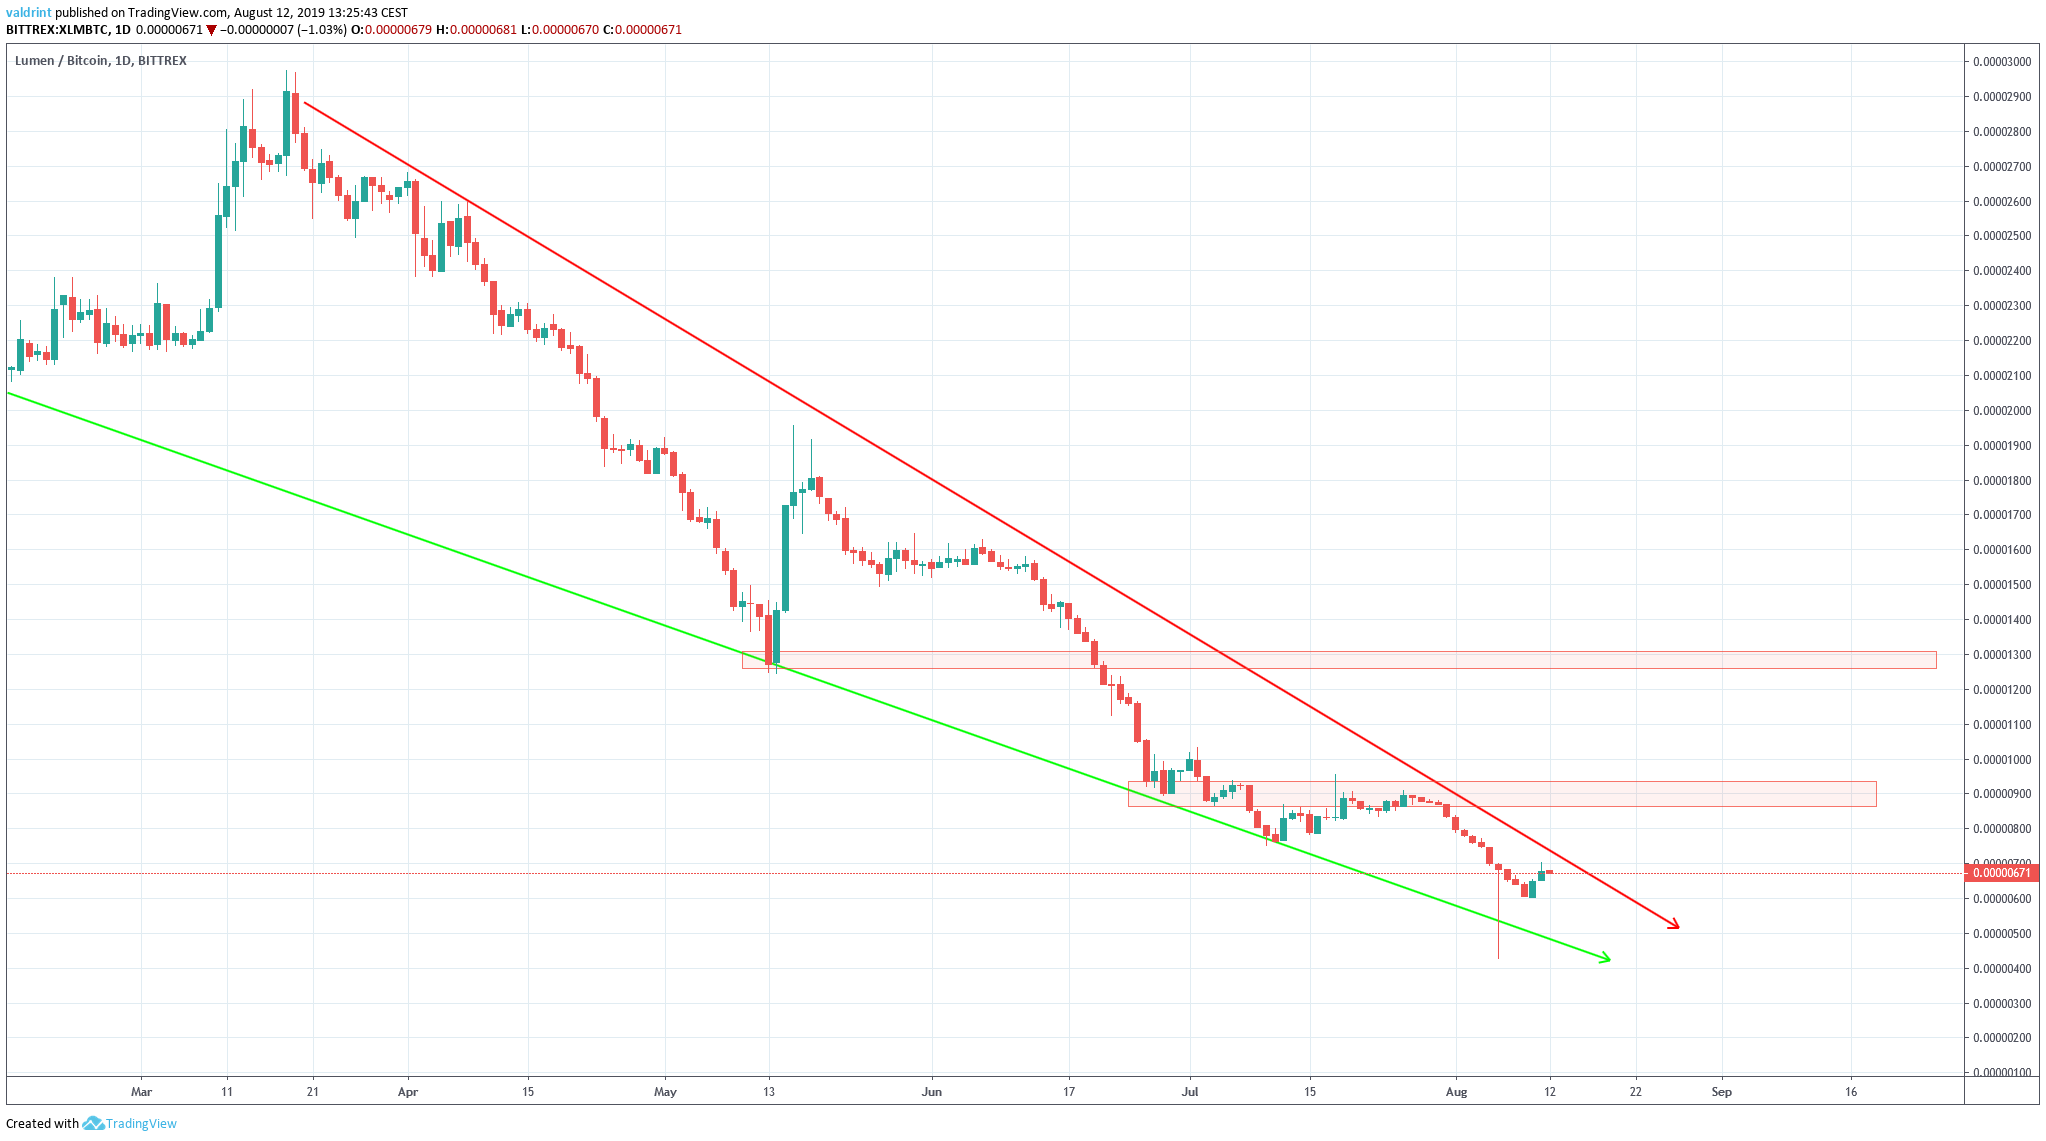 They are found at 900 and 1300 satoshis.
According to our analysis, it is likely to reach at least one of these areas.
They are found at 900 and 1300 satoshis.
According to our analysis, it is likely to reach at least one of these areas.
Summary
The XLM price is trading inside a long-term descending wedge. According to our analysis, it is likely to break out and reach at least one of the resistance areas outlined above. Do you think the XLM price will begin an upward move? Let us know in the comments below.
Disclaimer: This article is not trading advice and should not be construed as such. Always consult a trained financial professional before investing in cryptocurrencies, as the market is particularly volatile. Images are courtesy of Shutterstock, TradingView.
Top crypto platforms in the US
Disclaimer
In line with the Trust Project guidelines, this price analysis article is for informational purposes only and should not be considered financial or investment advice. BeInCrypto is committed to accurate, unbiased reporting, but market conditions are subject to change without notice. Always conduct your own research and consult with a professional before making any financial decisions. Please note that our Terms and Conditions, Privacy Policy, and Disclaimers have been updated.

Valdrin Tahiri
Valdrin discovered cryptocurrencies while he was getting his MSc in Financial Markets from the Barcelona School of Economics. Shortly after graduating, he began writing for several different cryptocurrency related websites as a freelancer before eventually taking on the role of BeInCrypto's Senior Analyst.
(I do not have a discord and will not contact you first there. Beware of scammers)
READ FULL BIO
Sponsored
Sponsored