
Solana (SOL) price is up 10% on Tuesday, February 4, as it attempts to hold above $200. Its market cap has recovered back above $100 billion. Despite this rebound, trading volume has dropped by roughly 40%, now sitting at $8.9 billion over the same period.
Meanwhile, SOL whale activity is showing signs of recovery after a recent decline, and key trend indicators remain undecided on the asset’s next move. Whether Solana can sustain its momentum or face renewed downside pressure will depend on how it interacts with critical resistance and support levels in the coming days.
Solana Whales Are Recovering From A Recent Fall From Its All-Time High
The number of Solana whales – addresses holding at least 10,000 SOL – has rebounded to 5,120, up from 5,096 just four days ago.
While it remains below the all-time high of 5,167 recorded on January 25, the recent increase suggests continued accumulation by large holders. This comes after a rapid surge from 5,054 on January 17, highlighting strong interest from big players in the market.
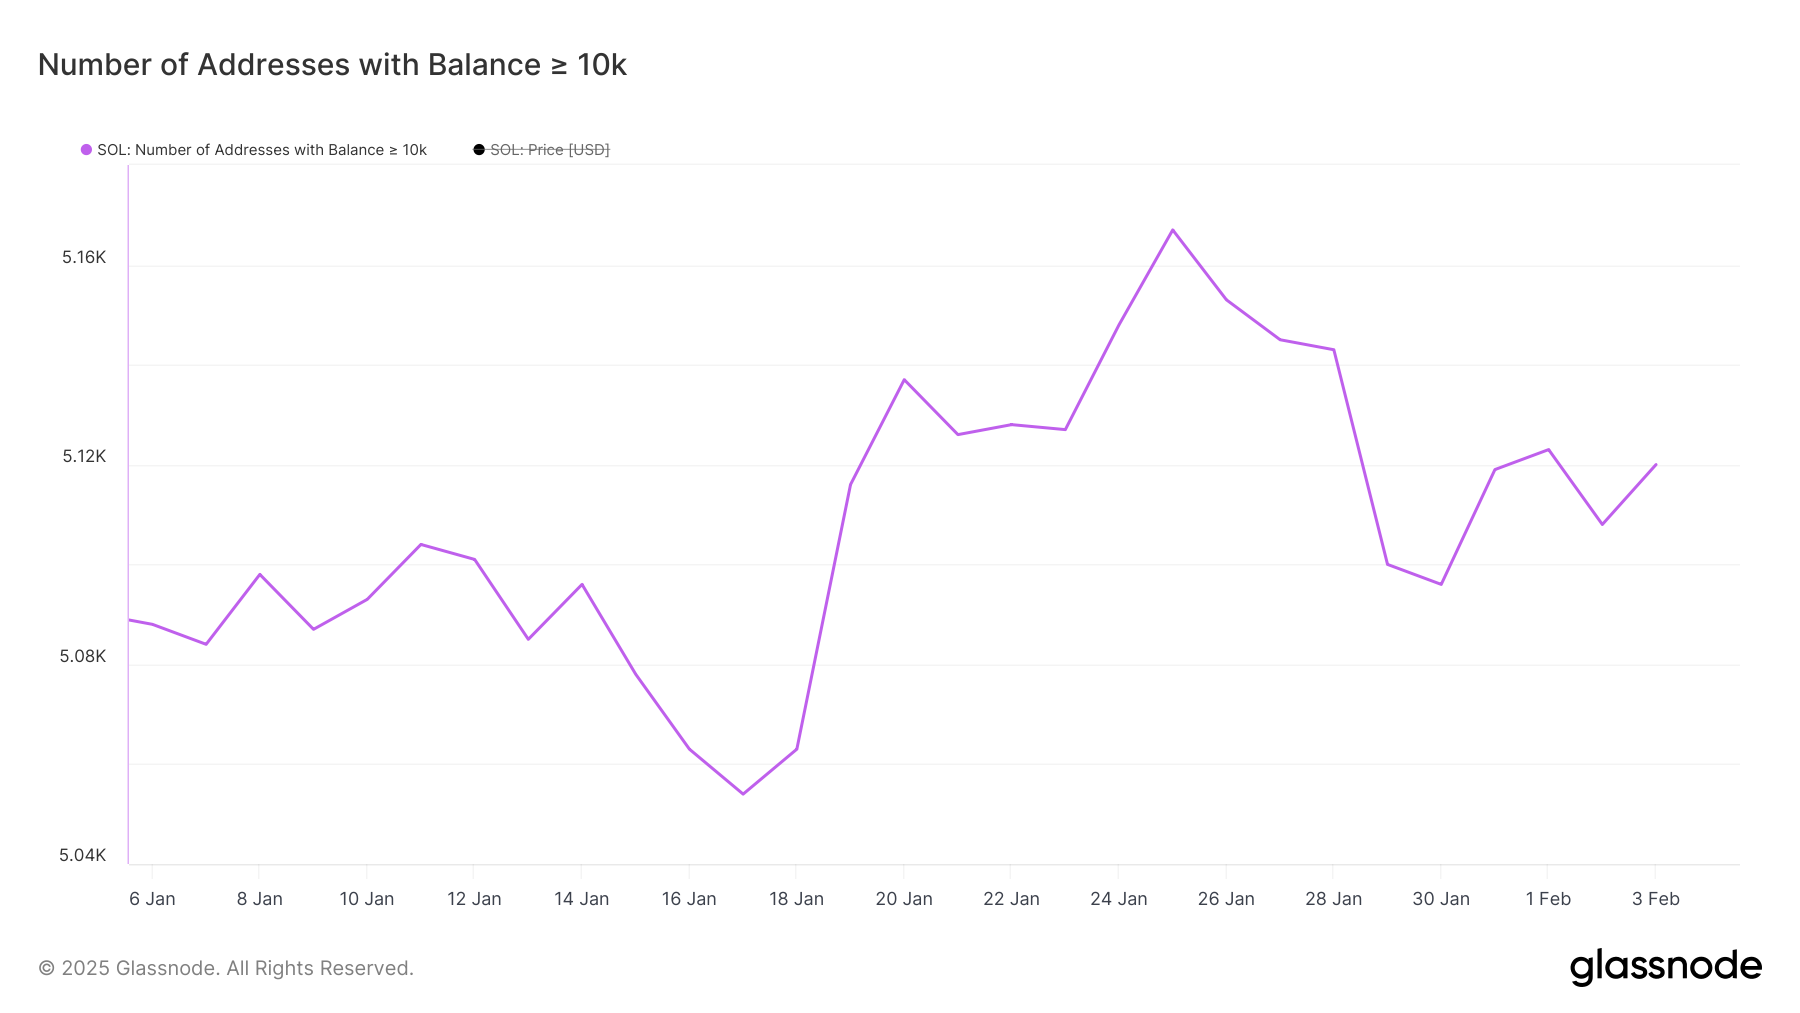
Tracking SOL whales is crucial because their buying and selling activity can significantly impact price trends. Large holders often signal confidence in the asset, and their accumulation can indicate bullish sentiment.
While the number is slightly below its peak, the fact that it is recovering suggests that major investors are still engaged, which could support SOL price stability or even future upward momentum.
Solana is Experiencing a Weak Downtrend Trend
Solana’s DMI chart shows its ADX at 33.5, which is a rise from 10.5 just four days ago. While it peaked at 36.2 a day ago, its current level still indicates a strengthening trend.
The ADX (Average Directional Index) measures trend strength, with values above 25 suggesting a strong trend and above 50 indicating an extremely strong one. The recent increase signals growing momentum, but the direction of the trend remains uncertain.
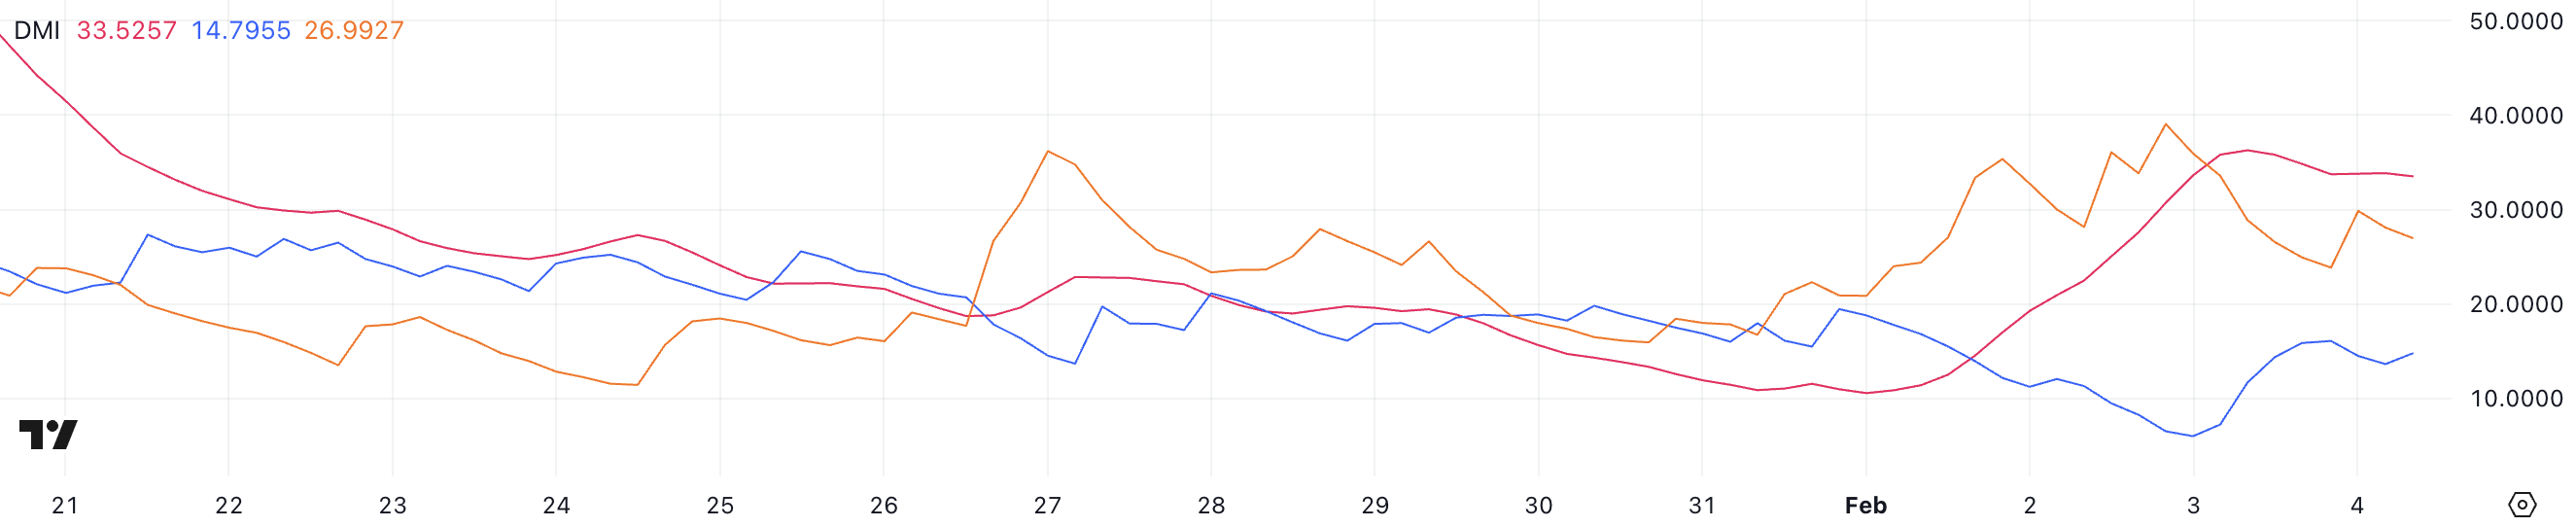
Currently, Solana +DI is at 14.7, up from 6 a day ago, while -DI has dropped to 26.99 from 39 two days ago. The +DI represents bullish strength, while the -DI reflects bearish pressure.
Although bearish momentum is weakening, bullish momentum is still relatively low, meaning the trend remains undefined. If +DI continues rising and crosses above -DI, it could signal a shift toward an upward trend, but for now, the market remains indecisive.
SOL Price Prediction: Will Solana Stay Above $200?
The price of Solana is currently trading between $222.8 and $191, with its EMA lines showing short-term moving averages below the long-term ones.
However, the downtrend isn’t that strong anymore, leaving the trend direction uncertain. SOL price is in a key range where a breakout in either direction could define the next major move.
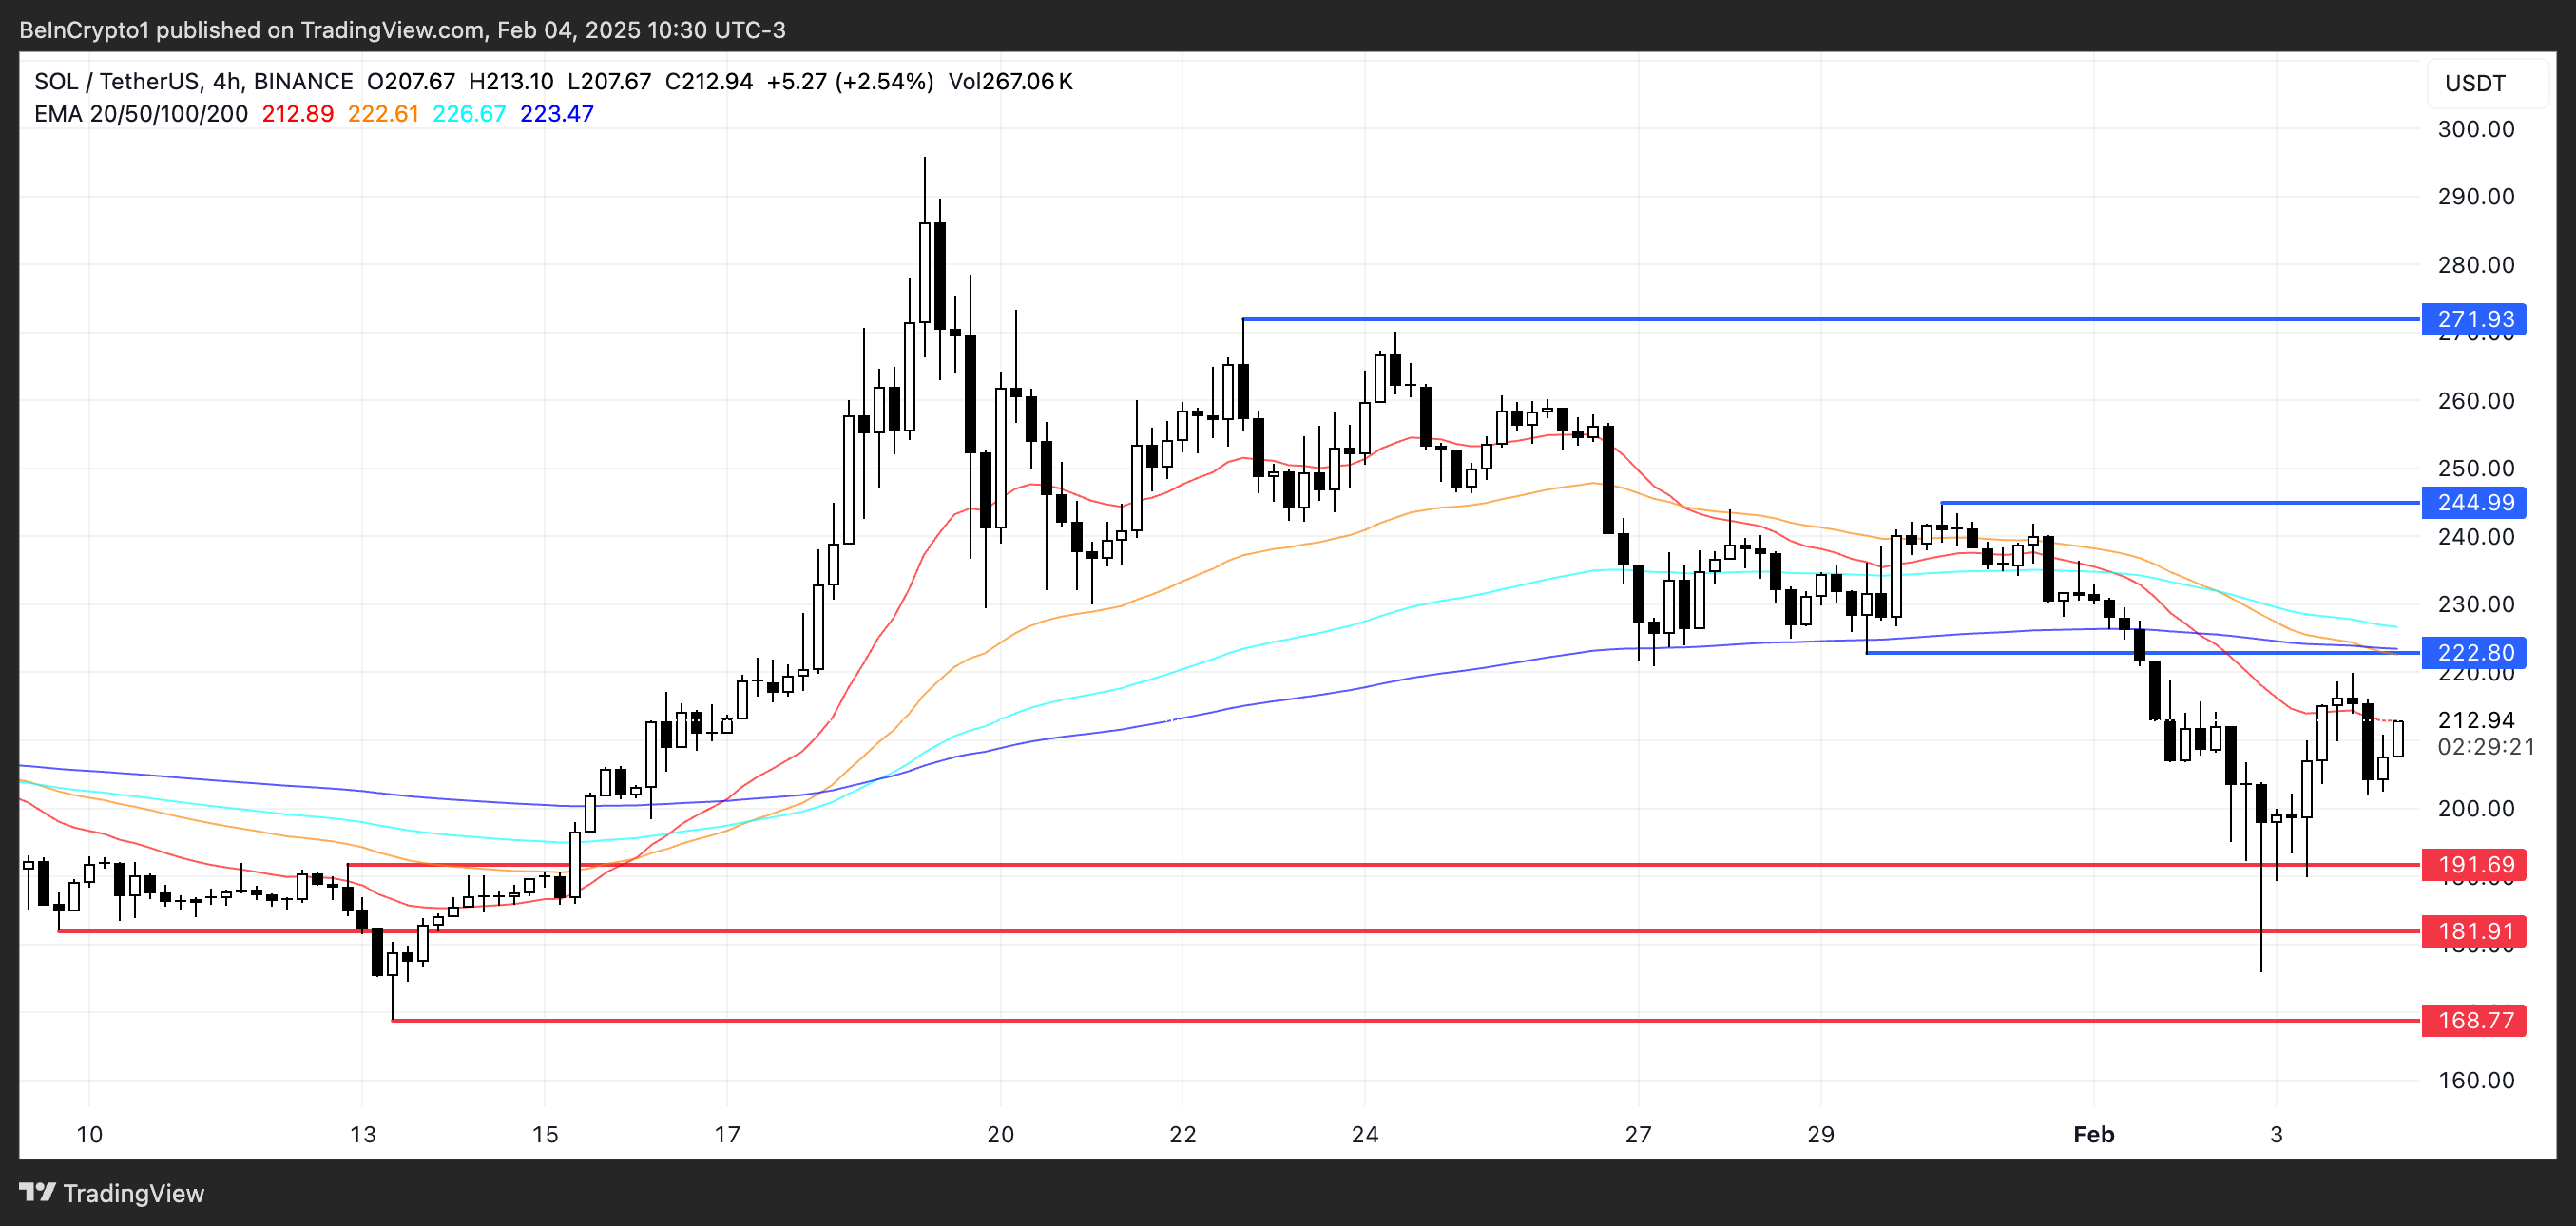
If SOL price regains its uptrend and breaks the $222.8 resistance, it could climb toward $244.99, with a strong rally potentially pushing it back to $271.
On the other hand, if a downtrend forms and support at $191.69 is lost, the next target would be $181.91, with further downside possibly taking it as low as $168.77.
