


Solana’s price has fallen below the critical $200 threshold. This decline mirrors the broader market downturn triggered by Bitcoin’s drop below $100,000.
The falling demand is evident from the consistent outflows from SOL’s spot markets, which have surpassed $365 million over the past three days.
Solana Records Steady Spot Outflows
SOL shares a strong positive correlation with Bitcoin and has faced increased selling pressure as traders react to BTC’s weakness. Since the leading coin fell below the $100,000 price mark on February 1, SOL spot traders have reduced their exposure to the altcoin.
This is reflected by the consistent outflows from SOL’s spot markets in the past three days, which have totaled $367 million per Coinglass.
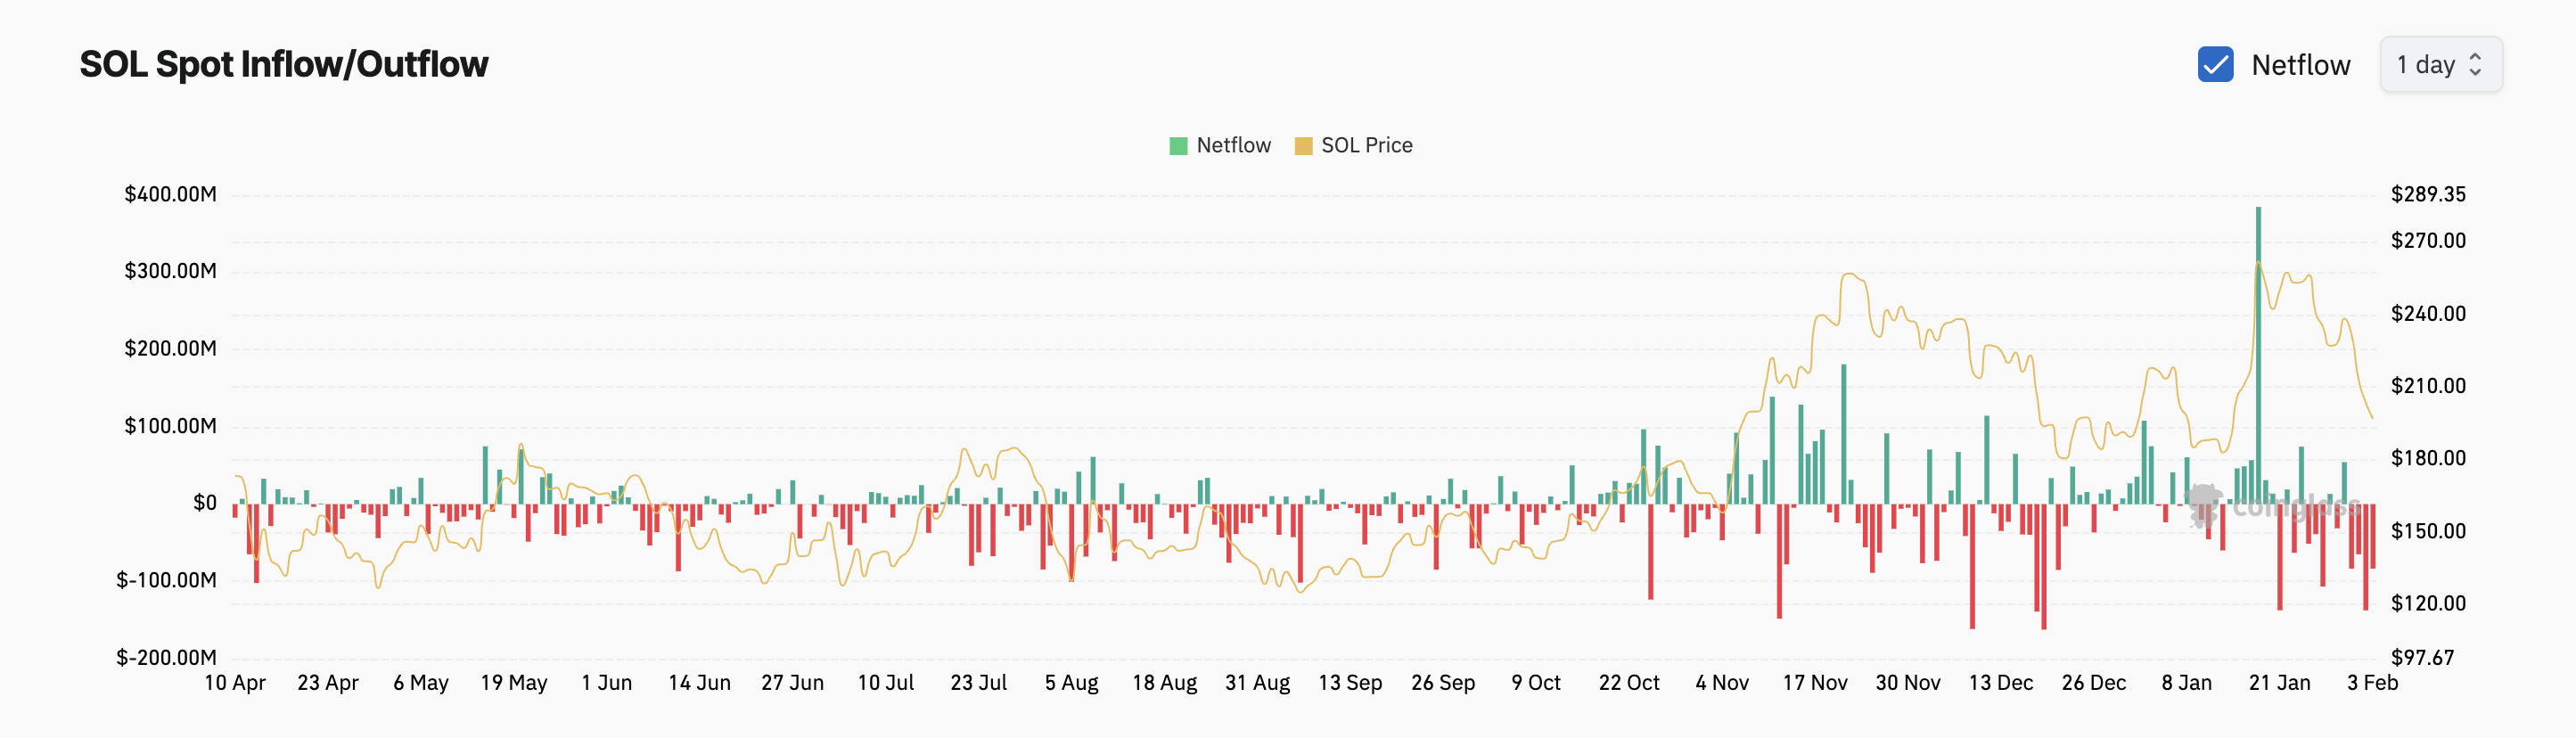
When an asset experiences steady outflows from its spot market, more traders are selling or withdrawing the asset than buying it. This indicates a decrease in demand and signals a bearish sentiment towards the asset.
Notably, SOL’s long/short ratio on Monday morning confirms this bearish sentiment. At press time, it stands below one at 0.93.
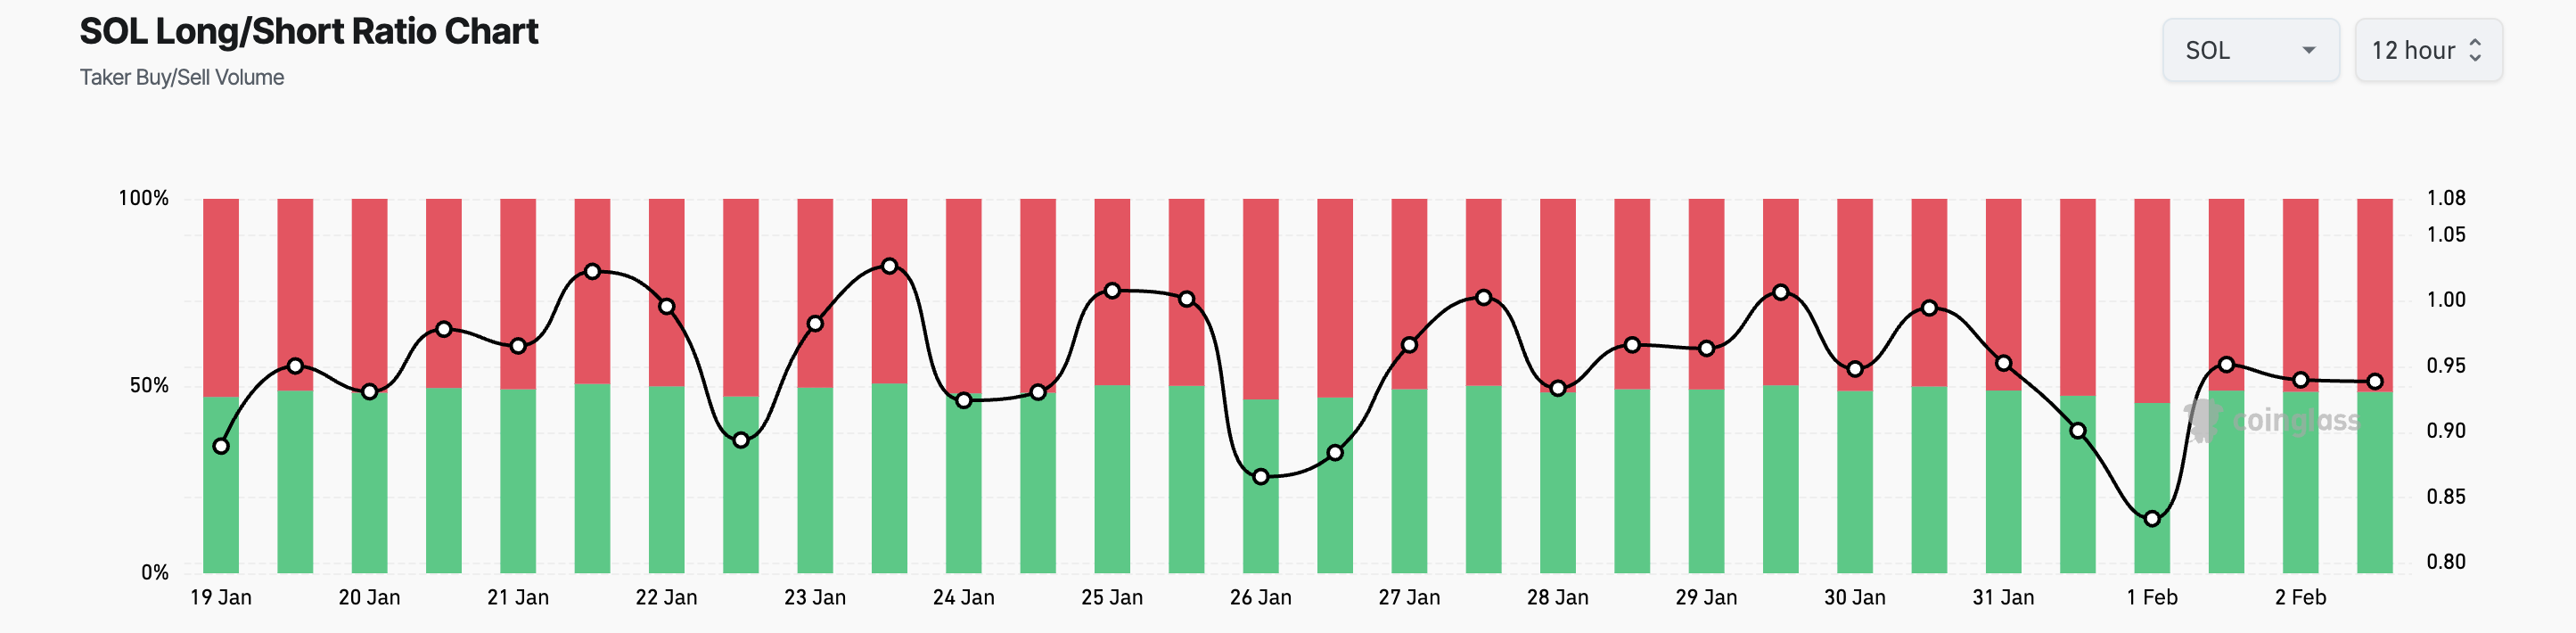
This ratio compares the number of long positions, bets that the price will rise, to short positions, bets that the price will fall, in a market. As with SOL, when the ratio is below 1, it indicates that there are more short than long positions, suggesting a bearish sentiment among traders.
SOL Price Prediction: Bearish Indicator Suggests Possible Decline to New Lows
On the price chart, SOL’s Chaikin Money Flow (CMF) is at the zero line, reflecting the strong selloffs among traders. CMF momentum indicator measures money flow into and out of an asset.
When an asset’s CMF falls below zero, it experiences negative money flow. This indicates more selling pressure than buying interest over a specified period. If this trend continues, SOL’s price could fall to $187.71.
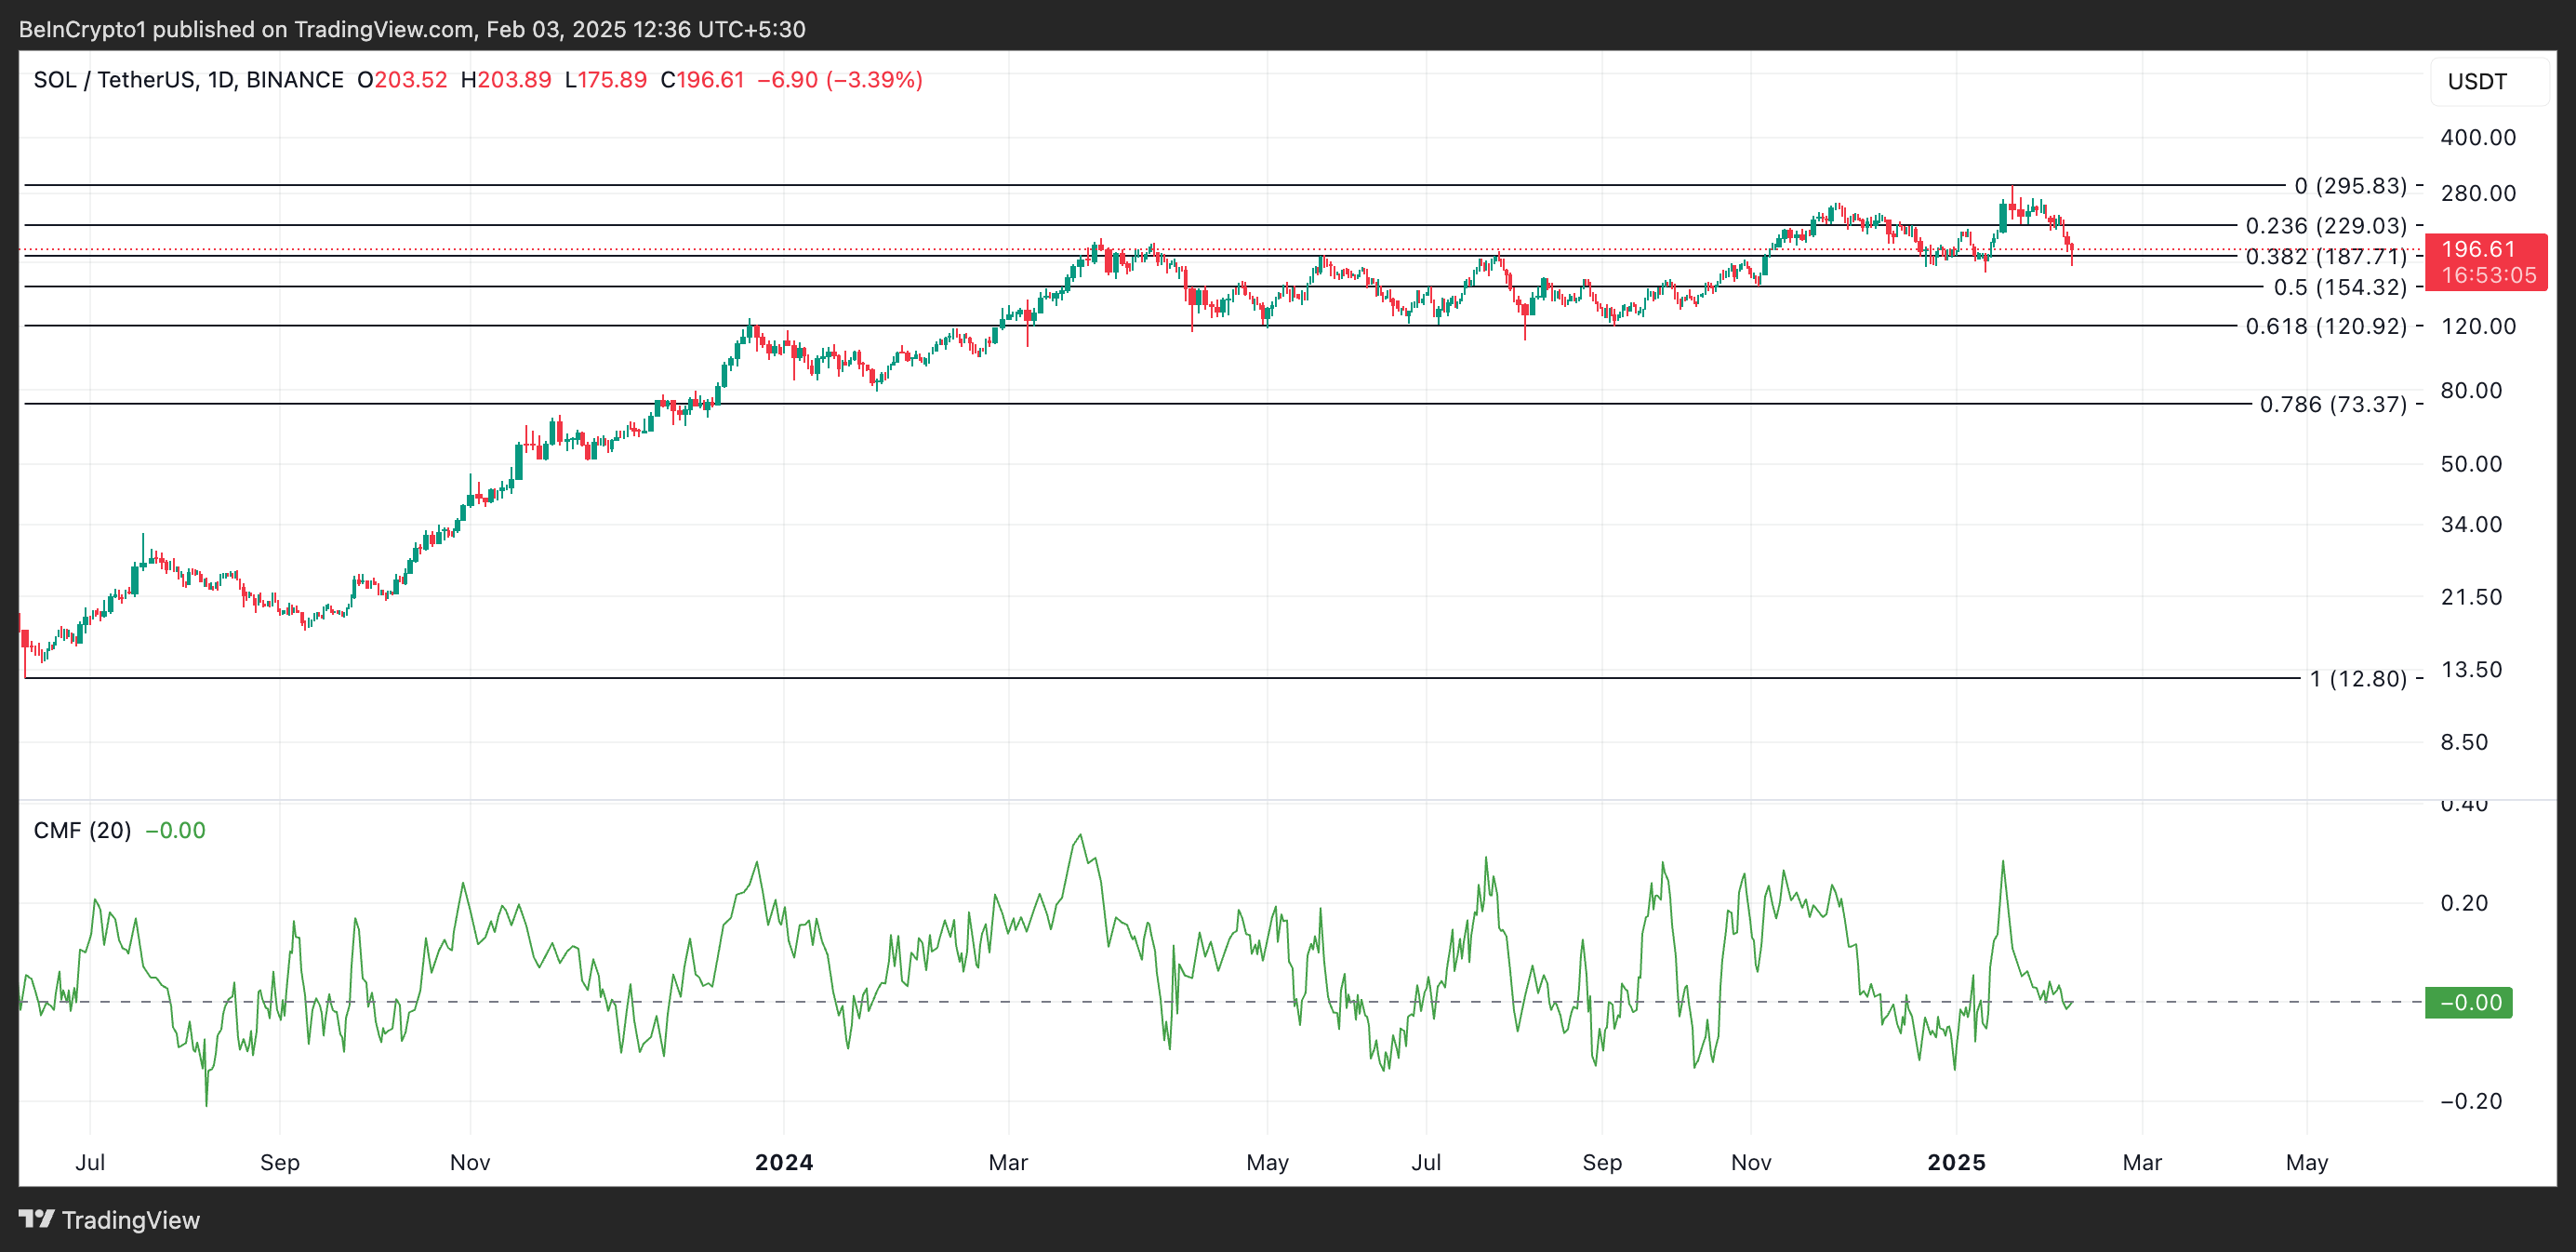
On the other hand, a resurgence in the coin’s demand will invalidate this bullish projection. In that scenario, SOL’s price could rise to $229.03.



