
Solana (SOL) has created bullish patterns in both the weekly and daily time frames. If the patterns are confirmed, a considerable bullish reversal could ensue.
The performance of the Solana network in the second quarter of 2022 has been exceptional.
The network has reached an average of roughly 40 million daily transactions. It is outpacing Ethereum in both rate of growth and total number of transactions.
Furthermore, Solana has also posted an exemplary performance based on its social activity.
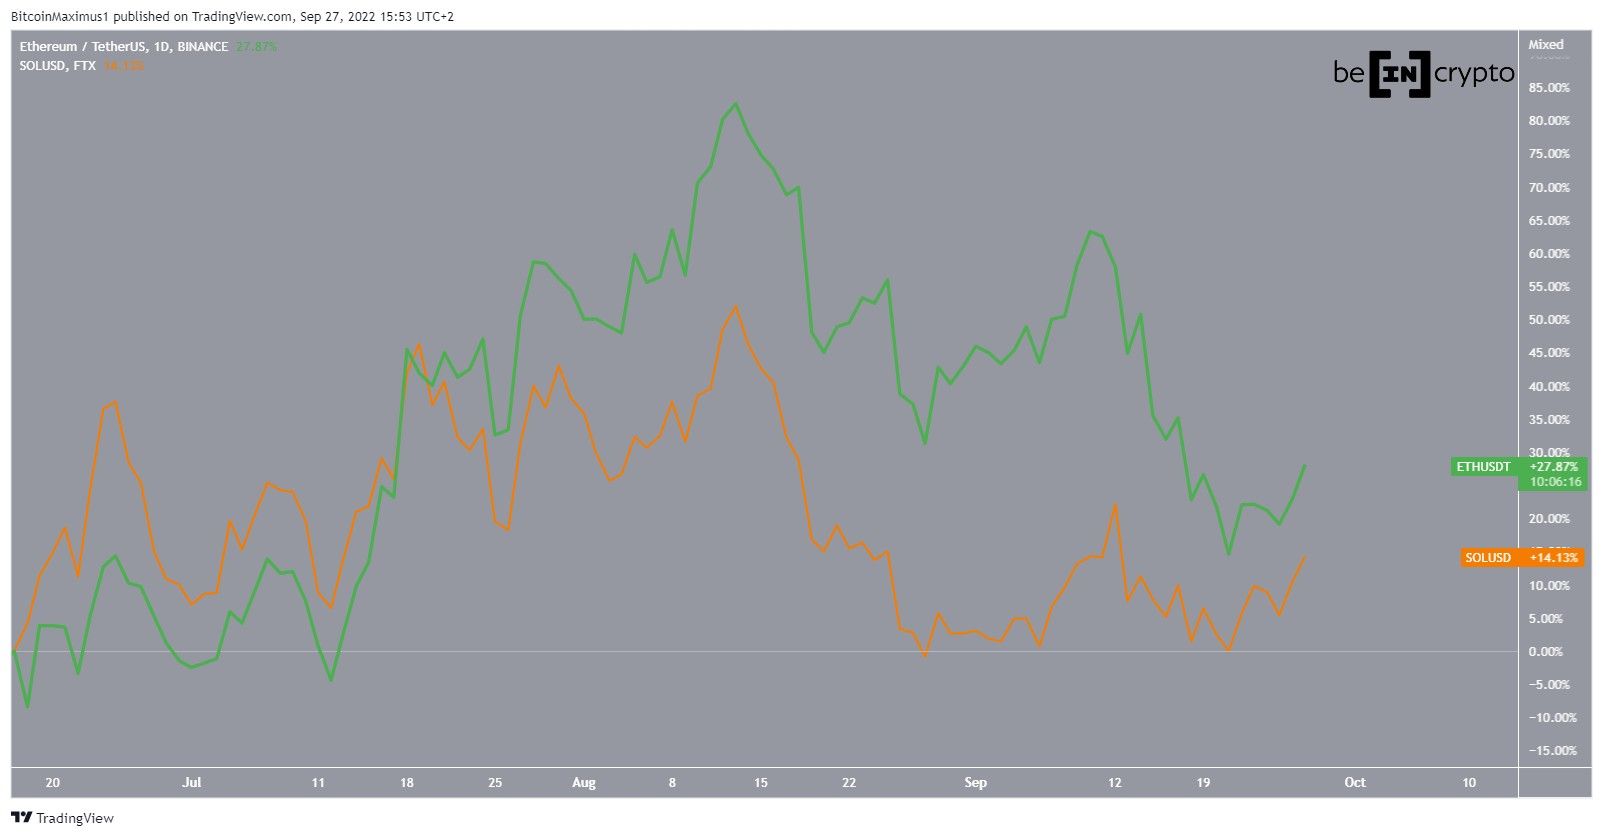
Despite this performance, the price of SOL has lagged behind that of Ethereum (ETH), both based on its rate of increase and actual price.
When comparing the increase of SOL (orange) and ETH (green) since the June lows, the former has increased by 14% while the latter by 28%.
Therefore, despite the comparatively better performance of the Solana network in regard to the number of transactions, the price is still lagging behind that of ETH.
SOL price likely to accelerate
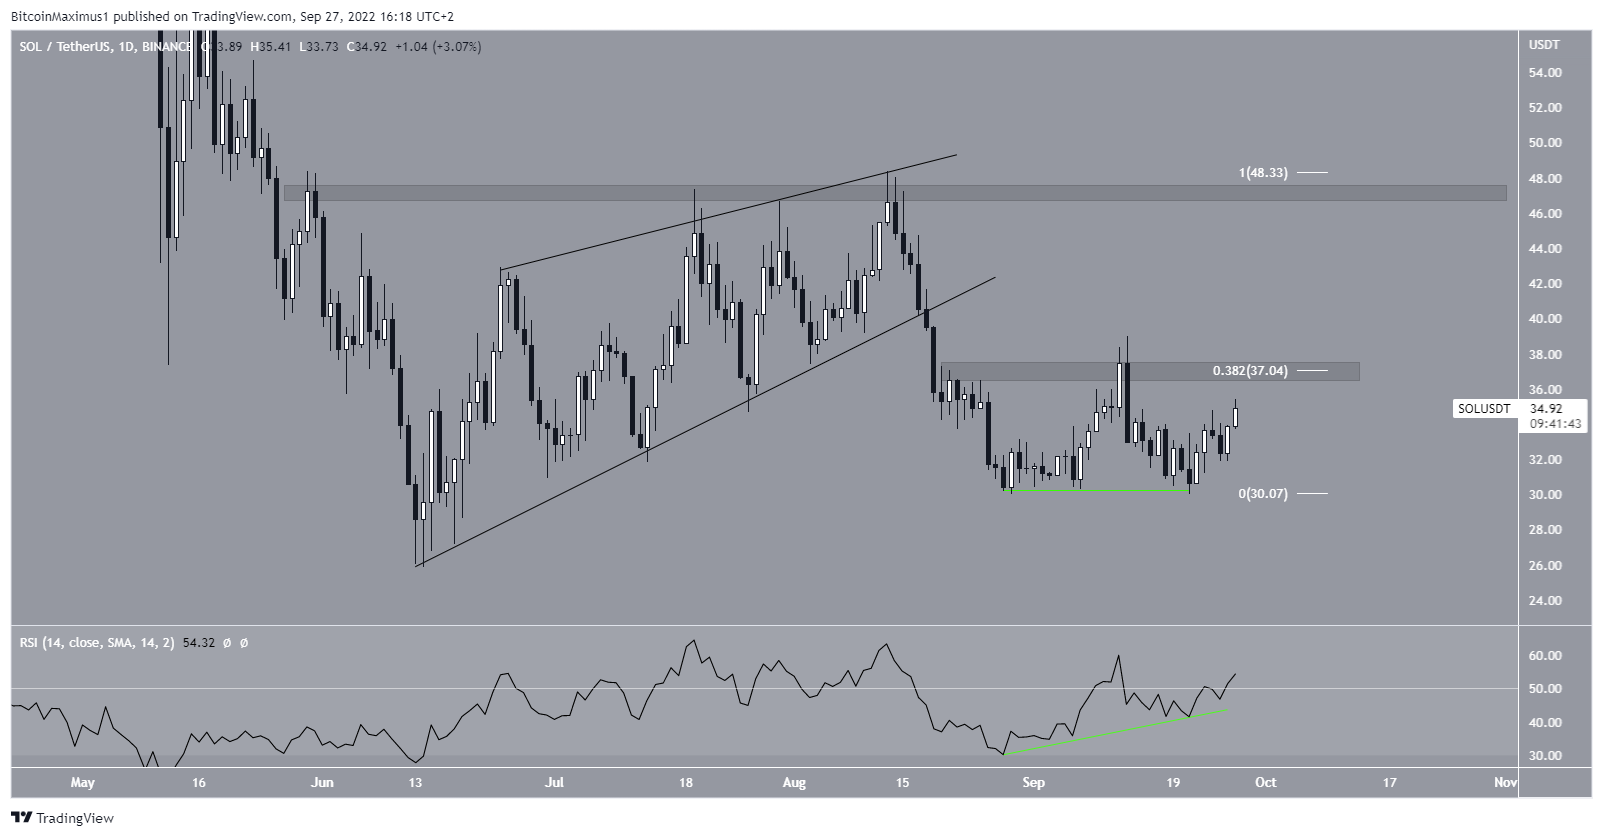
SOL has been falling since breaking down from an ascending wedge on Aug. 18. But, it regained its footing over the past five days and has increased by 16% leading to a high of $35.12.
The increase came after the price created a double bottom pattern, which was combined with bullish divergence (green line) in the daily RSI. Such patterns often lead to upward movements.
If SOL manages to move above the $37 resistance area, the rate of increase would be expected to accelerate. This could potentially take the price towards its Aug. highs at $47.
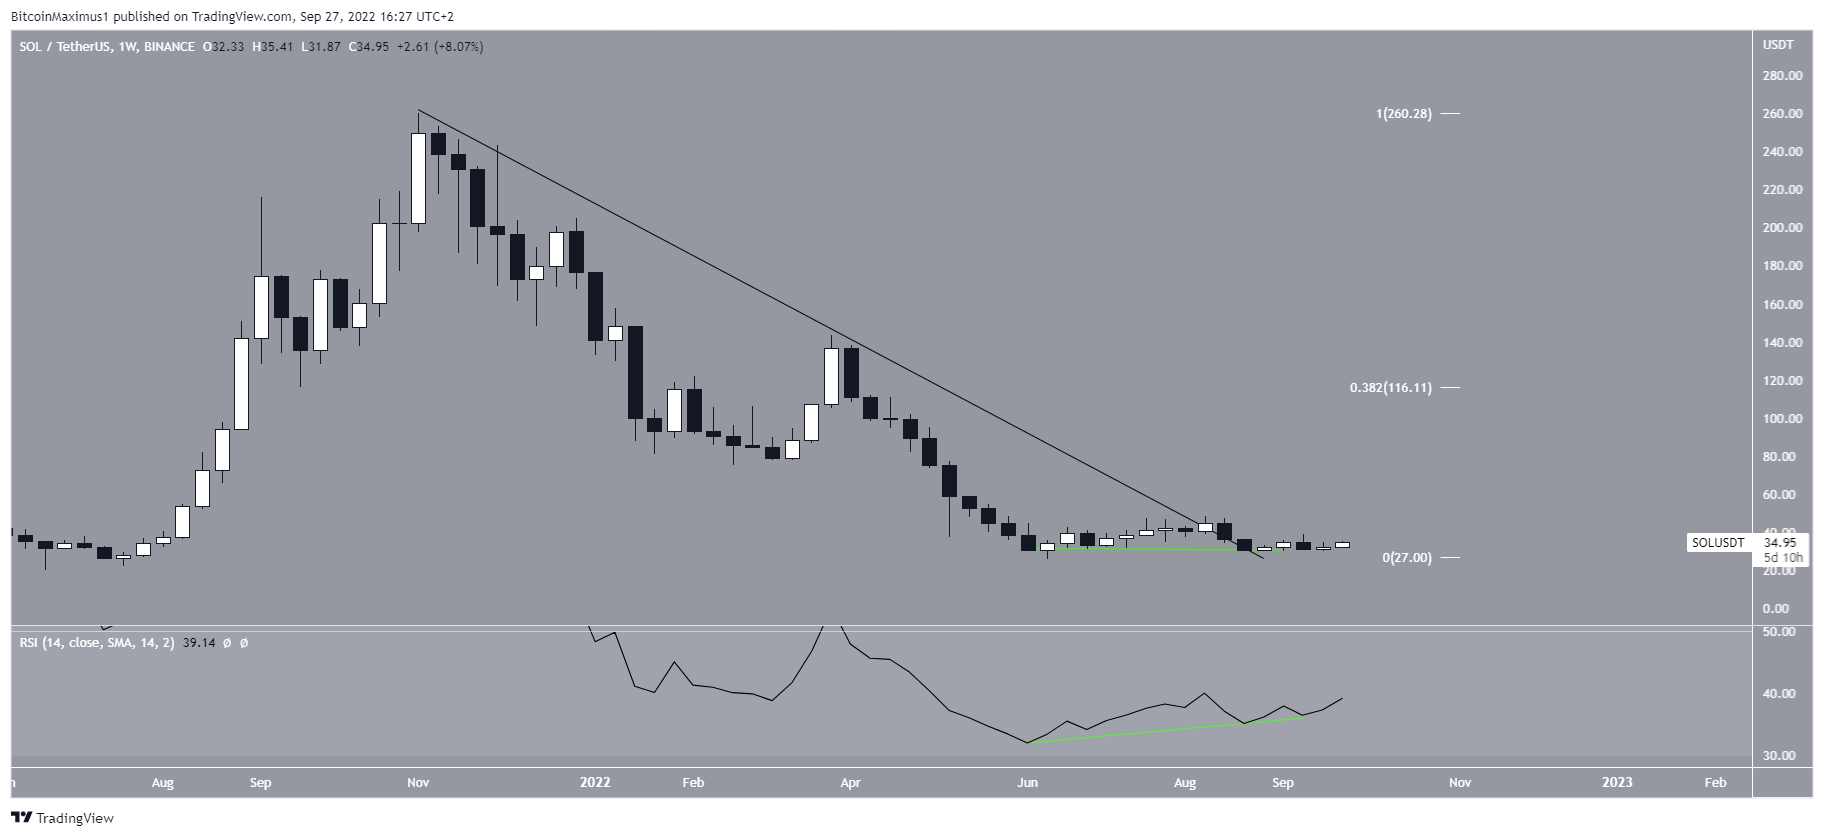
Interestingly, this double bottom pattern is also visible in the weekly time frame in the period between June and Sept. Similarly, the pattern has been combined with bullish divergence in the weekly RSI.
The double bottom would be confirmed with a movement above the Aug. highs of $48.38. If this happens, it will likely lead to an upward movement all the way to the 0.382 Fib retracement resistance level at $116.
For Be[in]Crypto’s latest Bitcoin (BTC) analysis, click here
Disclaimer
In line with the Trust Project guidelines, this price analysis article is for informational purposes only and should not be considered financial or investment advice. BeInCrypto is committed to accurate, unbiased reporting, but market conditions are subject to change without notice. Always conduct your own research and consult with a professional before making any financial decisions. Please note that our Terms and Conditions, Privacy Policy, and Disclaimers have been updated.
