


Due to the massive Solana (SOL) price increase in 2023, the altcoin has nearly flipped the market cap of XRP, the fourth biggest cryptocurrency.
Solana currently has a market cap of $32.9 billion, slightly less than the $33.1 billion of XRP. If SOL surpasses it, it can move toward BNB, which has a market cap of $39 billion.
BNB Bounces From Range Low
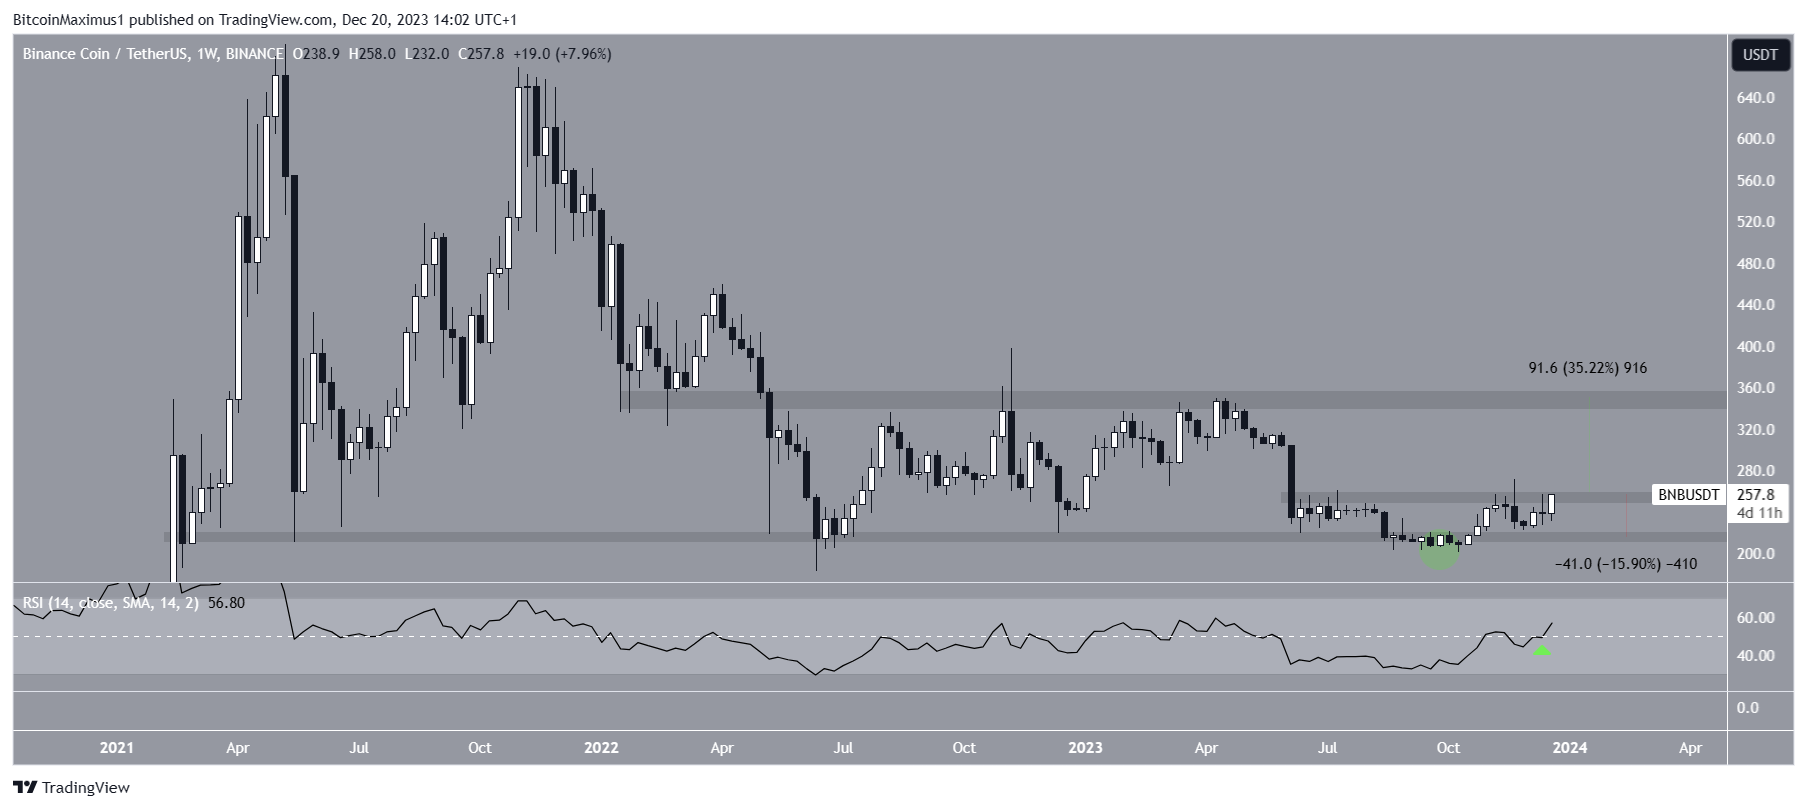
The BNB price has traded in a long-term horizontal range since the start of 2022. While the price has moved above and below these levels several times, it never managed to sustain the movement, falling inside the confines of the range again.
More recently, BNB fell below the range low in October (green circle. However, it reclaimed it shortly afterward and has increased since. The upward movement caused a reclaim of the range low of $215. The BNB price now trades inside an intermediate resistance area.
Traders utilize the RSI as a momentum indicator to assess whether a market is overbought or oversold and whether to accumulate or sell an asset.
If the RSI reading is above 50 and the trend is upward, bulls still have an advantage, but if the reading is below 50, the opposite is true.
The weekly RSI has increased since the low and is above 50 (green icon). This is considered a bullish sign.
If the BNB price continues to increase, it can reach the range high of $350, a 35% upward movement from the current price.
Despite this bullish BNB price prediction, a rejection from the minor resistance of $260 can trigger a 15% drop to the range low of $215.
XRP Risks Being Overtaken by Solana
The XRP price has increased alongside an ascending support trend line since June 2022. More recently, the price bounced at the support trend line in April (green icon), accelerating the rate of increase.
After an unsuccessful breakout, XRP moved and closed above the $0.60 horizontal area in October. Since then, it has consolidated above the area.
The weekly RSI gives a bullish reading since it is above 50 and increasing. If the upward movement continues, XRP can increase by another 40% and reach the next resistance at $0.85.
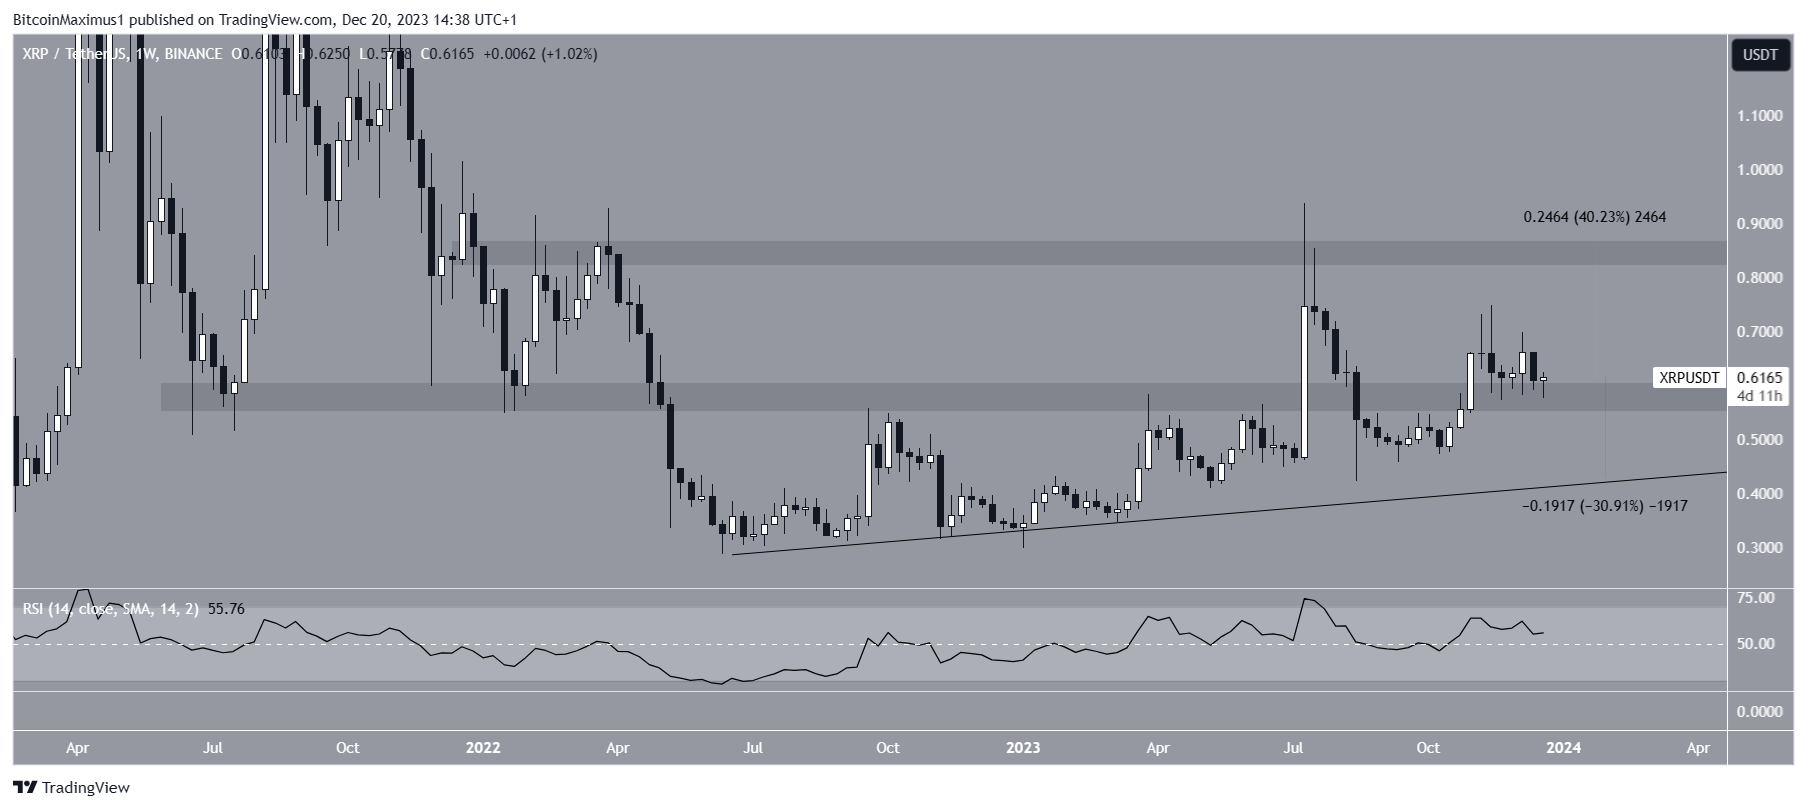
Despite this bullish XRP price prediction, a close below the $0.60 horizontal area will invalidate the breakout. Then, the XRP price will likely fall by 30% to the ascending support trend line at $0.43.
For BeInCrypto‘s latest crypto market analysis, click here


