


Solana’s (SOL) price is making its way out of a bullish pattern, which has set the target at a three-week high.
With the rest of the crypto market slowly turning optimistic about recovery, the altcoin could reach this target, too.
Solana Is an Attractive Investment
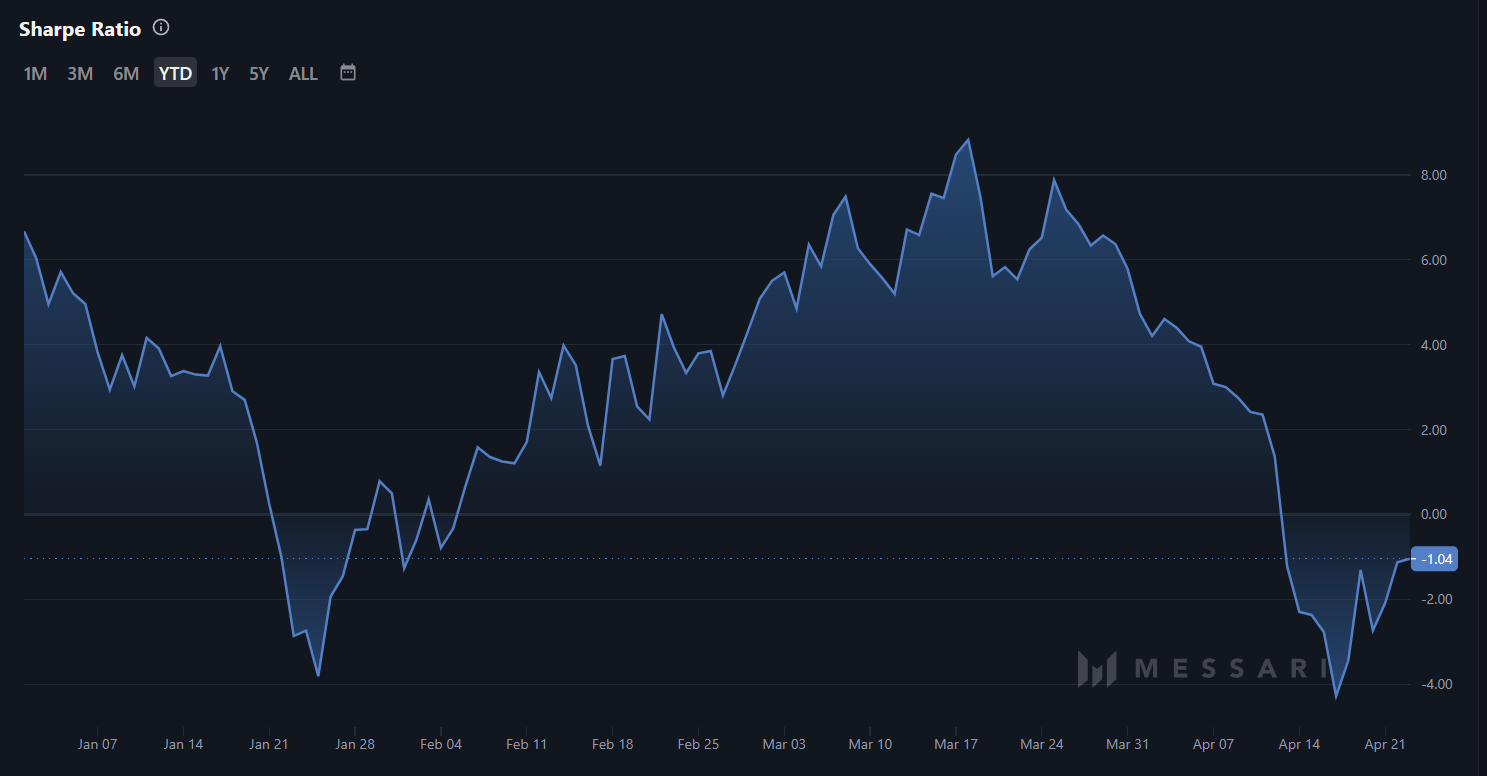
Solana’s price is moving up, and by the looks of it, so are the chances of the altcoin grabbing the attention of new users. This is because SOL, at the moment, is recovering from bearing negative risk rewards to positive.
Evinced by the Sharpe Ratio making its way into the positive zone above the zero line, Solana appears to be an attractive investment. This could bring board investors from other assets and first-timers, given the altcoin has an exceptional reputation in the market.
Read More: How to Buy Solana Meme Coins: A Step-By-Step Guide
Secondly, the broader market cues are also turning bullish. The Relative Strength Index (RSI) proves the same, persisting in the bullish zone above the neutral line, marked at 50.0.
The Relative Strength Index (RSI) is a momentum oscillator that measures the speed and change of price movements. RSI values range from 0 to 100, with levels above 70 indicating overbought conditions and levels below 30 indicating oversold conditions.
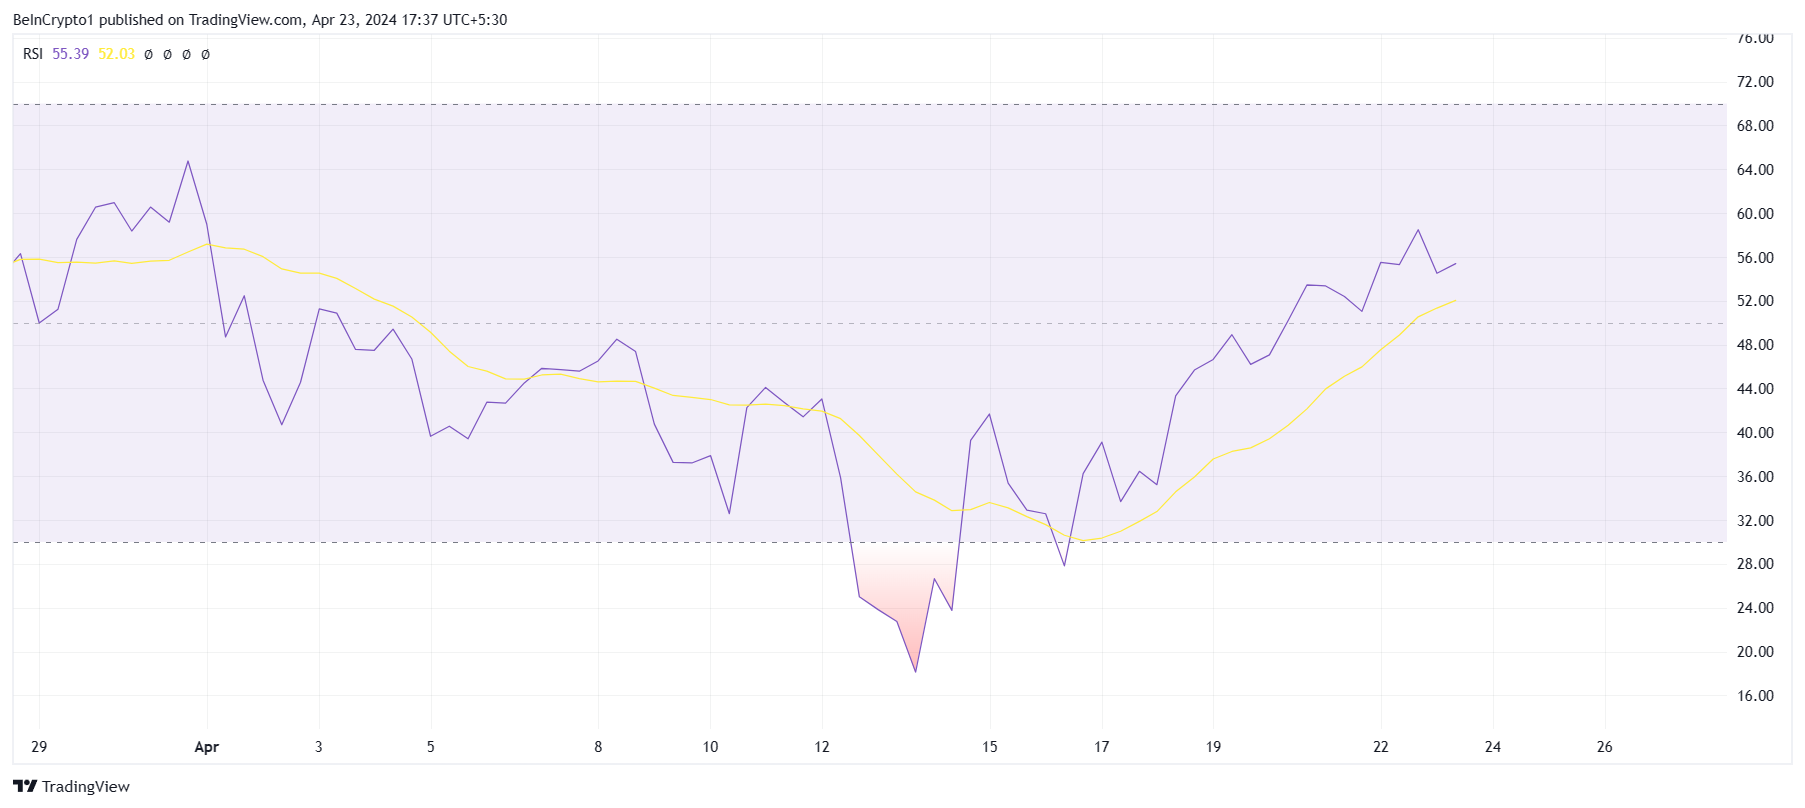
Since the altcoin is far from overbought, SOL has enough room to observe further growth.
SOL Price Prediction: Look Up
Solana’s price, trading at $154 at the time of writing, is breaking out of its ascending triangle pattern. An ascending triangle is a bullish continuation pattern formed by a horizontal resistance line and a rising support line. A potential breakout above the resistance level signals a continuation of the uptrend.
This is also the case with Solana since the altcoin is above the $153 resistance. Per the pattern, the altcoin’s potential target is $191. This is almost 25% above the trading price.
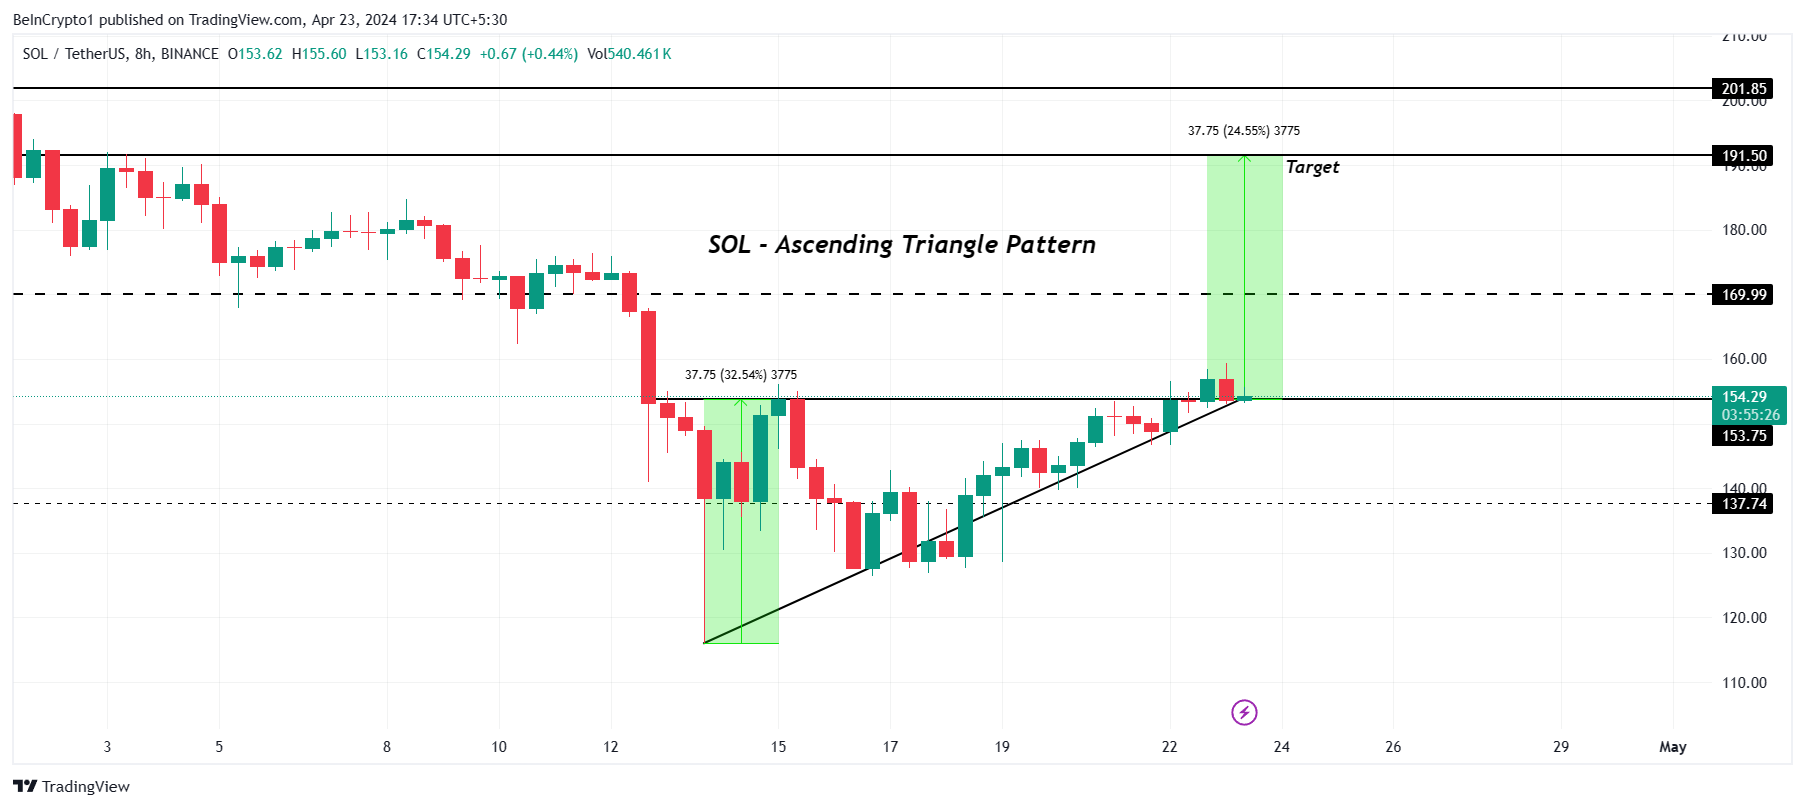
This rally is possible if SOL manages to flip the $169 resistance into support.
Read More: Solana (SOL) Price Prediction 2024/2025/2030
However, if Solana fails to sustain $153 as support and falls through, it could test the $137 line as support. Losing it might invalidate the bullish outcome, resulting in further drawdown.


