


Solana (SOL) is currently undergoing a corrective phase, and there are indications that the price could potentially decline further.
There’s a possibility that SOL might reach around $130 as part of this correction, BeInCrypto analyzes the price charts.
Solana’s Price Rebounds from 50-Day EMA
The day before yesterday, Solana reached the 50-day EMA support at the 0.382 Fib level, approximately at $160, and rebounded strongly. Currently, the SOL price faces significant Fib resistances around $180 and $195.
Moreover, the Moving Average Convergence Divergence (MACD) histogram has shown bullish momentum over the past three days. However, the MACD lines are bearishly crossed, and the Relative Strength Index (RSI) remains neutral.
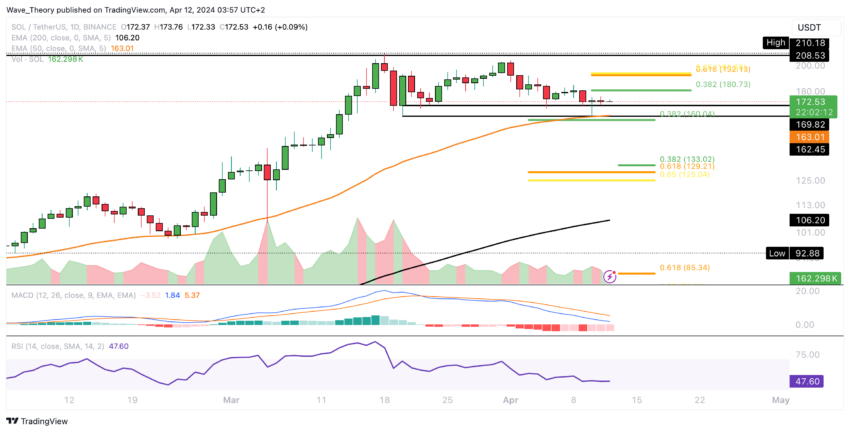
In addition, the EMAs maintain a golden crossover, indicating a bullish trend in the short to medium term. Nonetheless, the corrective phase will only conclude if Solana surpasses the golden ratio of around $195.
Solana’s 4H Chart Alert: Is a Death Cross on the Horizon?
In the 4-hour chart, the MACD lines are in a bullish crossover, while the histogram fluctuates between bullish and bearish movements.
Read More: How to Buy Solana Meme Coins: A Step-By-Step Guide
At the same time, the RSI is hovering in neutral territory, and the EMAs maintain a golden crossover. However, they are approaching closely, potentially leading to a Death Cross.
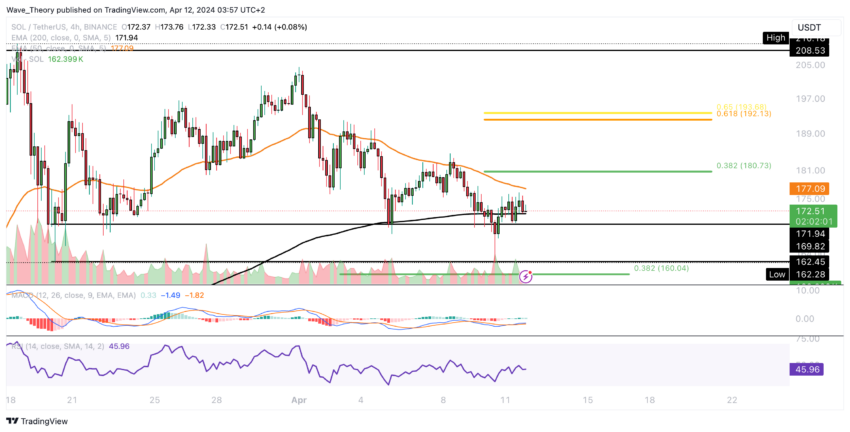
Such a development would affirm a short-term bearish trend.
Solana’s Tough Week: Price Dips Over 20%
Since our cautionary note on a potential correction in Solana when its price hovered around $190, it has indeed experienced a decline of over 20% from its weekly peak of approximately $205.
Consequently, the MACD histogram has shown a bearish trend since the previous week. Despite this, the MACD lines maintain their bullish crossover while the RSI gradually transitions from overbought territories to a neutral stance.
Presently, robust Fibonacci supports are observed around $160 and $130. In the event of a severe correction, Solana could potentially retreat to the golden ratio support near $85.
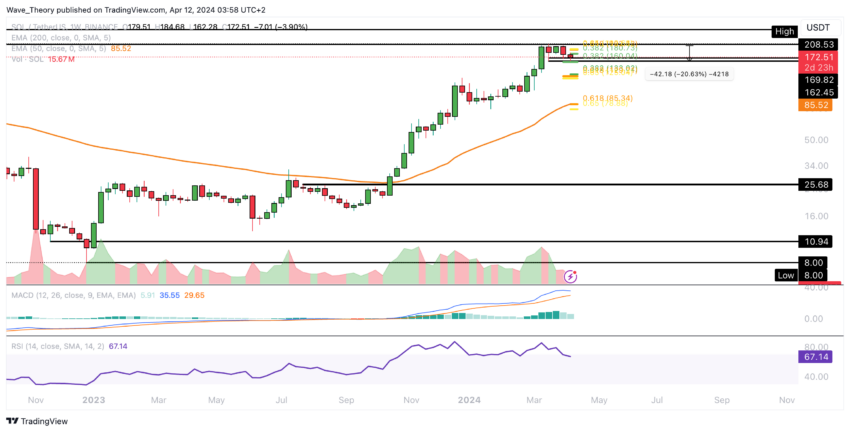
At this level, the 50-week EMA serves as an additional pillar of support. It’s worth noting that such a pronounced correction wouldn’t invalidate the overall bullish trend, as significant volatility is characteristic of the cryptocurrency realm. Therefore, it remains a plausible scenario.
MACD Histogram Signals Downturn in Coming Month
The MACD histogram may exhibit a bearish trend in the current month. Presently, the MACD retains its predominantly bullish stance, as evidenced by the bullish crossover of the MACD lines and the upward trajectory of the histogram.
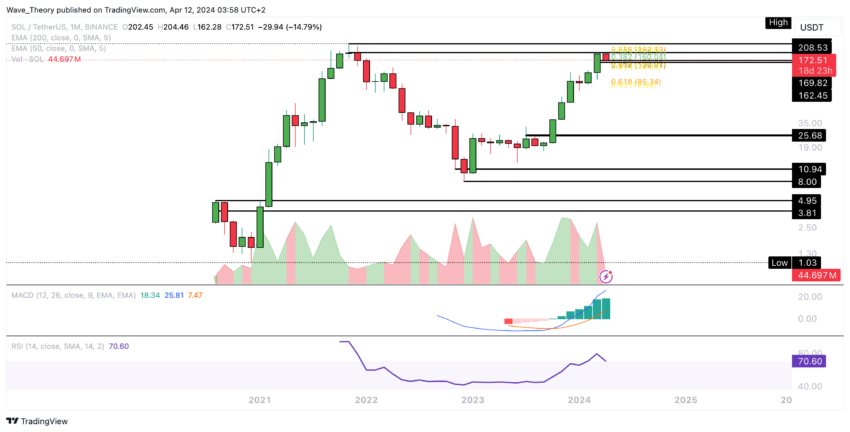
Furthermore, the RSI is progressively transitioning from overbought levels towards neutral territory.
Solana vs. Bitcoin: Anticipating a Bullish Bounce at Fibonacci Support
A notably distinct scenario has unfolded concerning Solana’s performance against Bitcoin. Following a bearish divergence observed in the weekly RSI, the Solana price faced a bearish rejection at the Golden Ratio resistance level of around 0.003 BTC.
Read More: Solana (SOL) Price Prediction 2024/2025/2030
This development suggests a potential bullish rebound for Solana, with the possibility of the price bouncing off Fibonacci supports ranging from approximately 0.0021 BTC to 0.0023 BTC, initiating an upward trajectory.
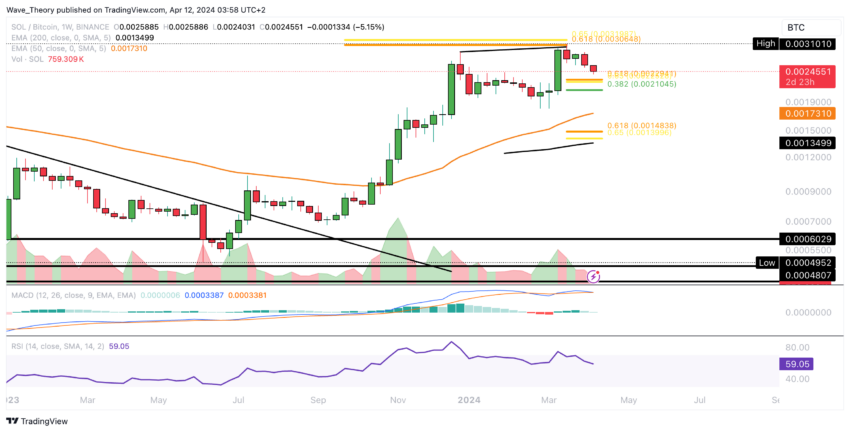
Alternatively, should the price fail to find support within the aforementioned range, significant support is anticipated around 0.00145 BTC. It’s worth noting that the MACD lines are nearing a bearish crossover, accompanied by a bearish downturn in the MACD histogram observed since the previous week.


