

Shiba Inu (SHIB) is approaching the convergence point between resistance and support levels in a neutral pattern. A decisive move is likely to occur in the near future.
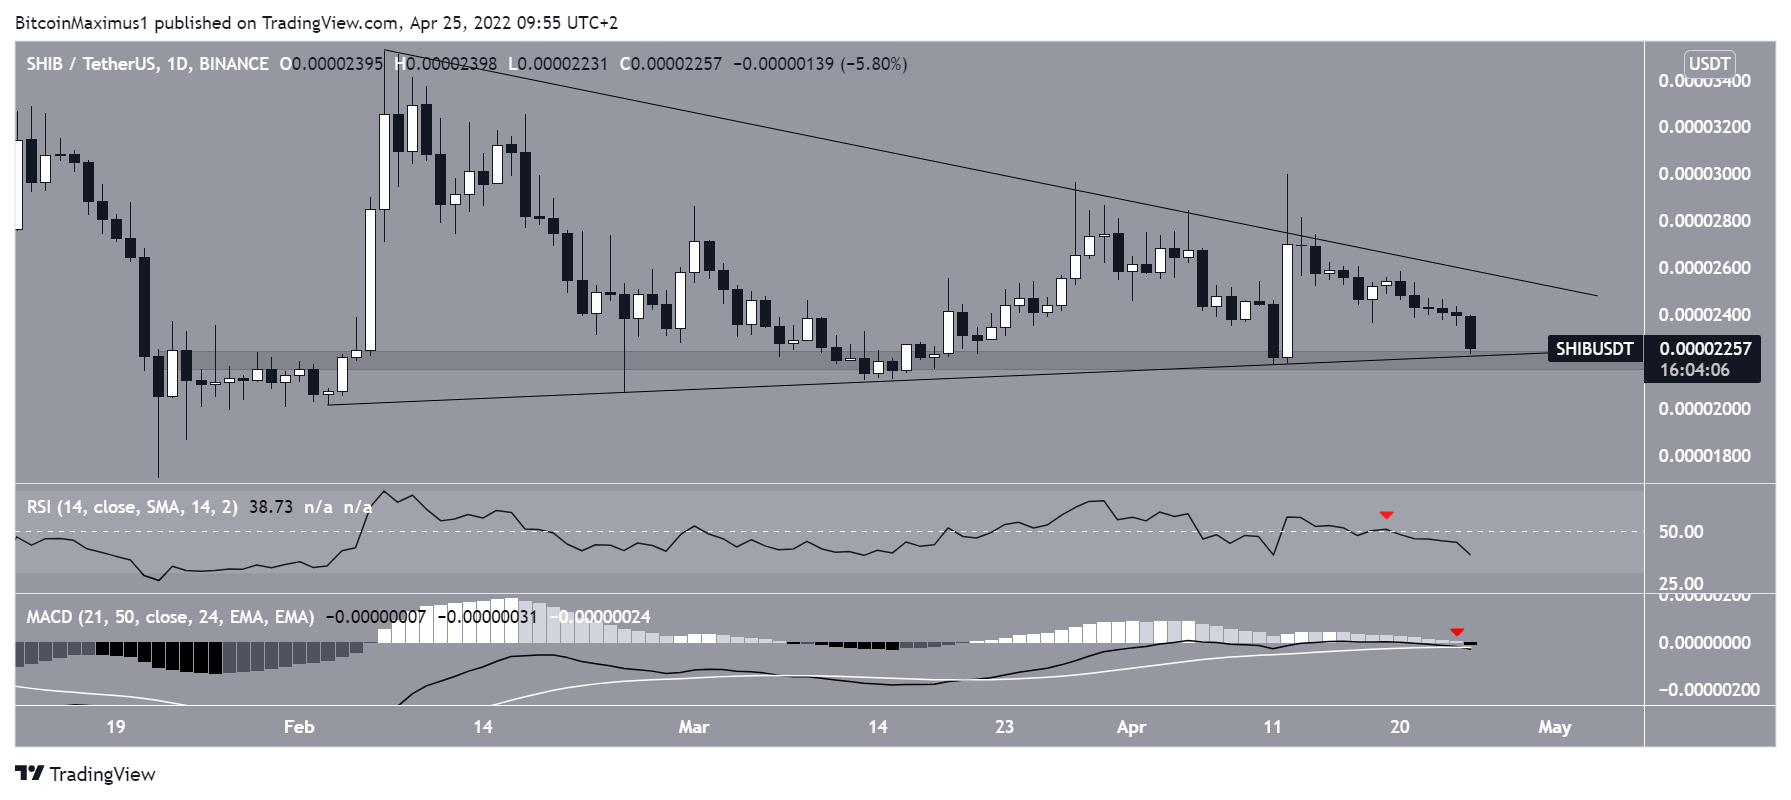
Shiba Inu has been decreasing under a descending resistance line since Feb. 7, 2022. This led to a local low of $0.000020 17 days later. The low served to create a long lower wick (green icon) and create the slope for an ascending support line.
So far, the line has been validated three more times, most recently on April 15. The line also coincides with the $0.000020 horizontal support area, which has been in place since the beginning of February.
When combined with the aforementioned resistance line, the support line creates a symmetrical triangle. This is often considered to be a neutral pattern, meaning that a breakout or breakdown from the pattern is equally possible.

Technical analyst @Murfski_ tweeted a SHIB analysis, stating that it could potentially be accumulating in anticipation of a significant upward move.

Future movement
Technical indicators in the daily time frame are bearish and support a scenario in which SHIB breaks to the downside.
The main reason for this is the decreasing MACD and RSI. The former is negative and just made a bearish cross, while the latter has fallen below 50 (red icons). Both of these are considered bearish signs, supporting the continuation of the downward movement.
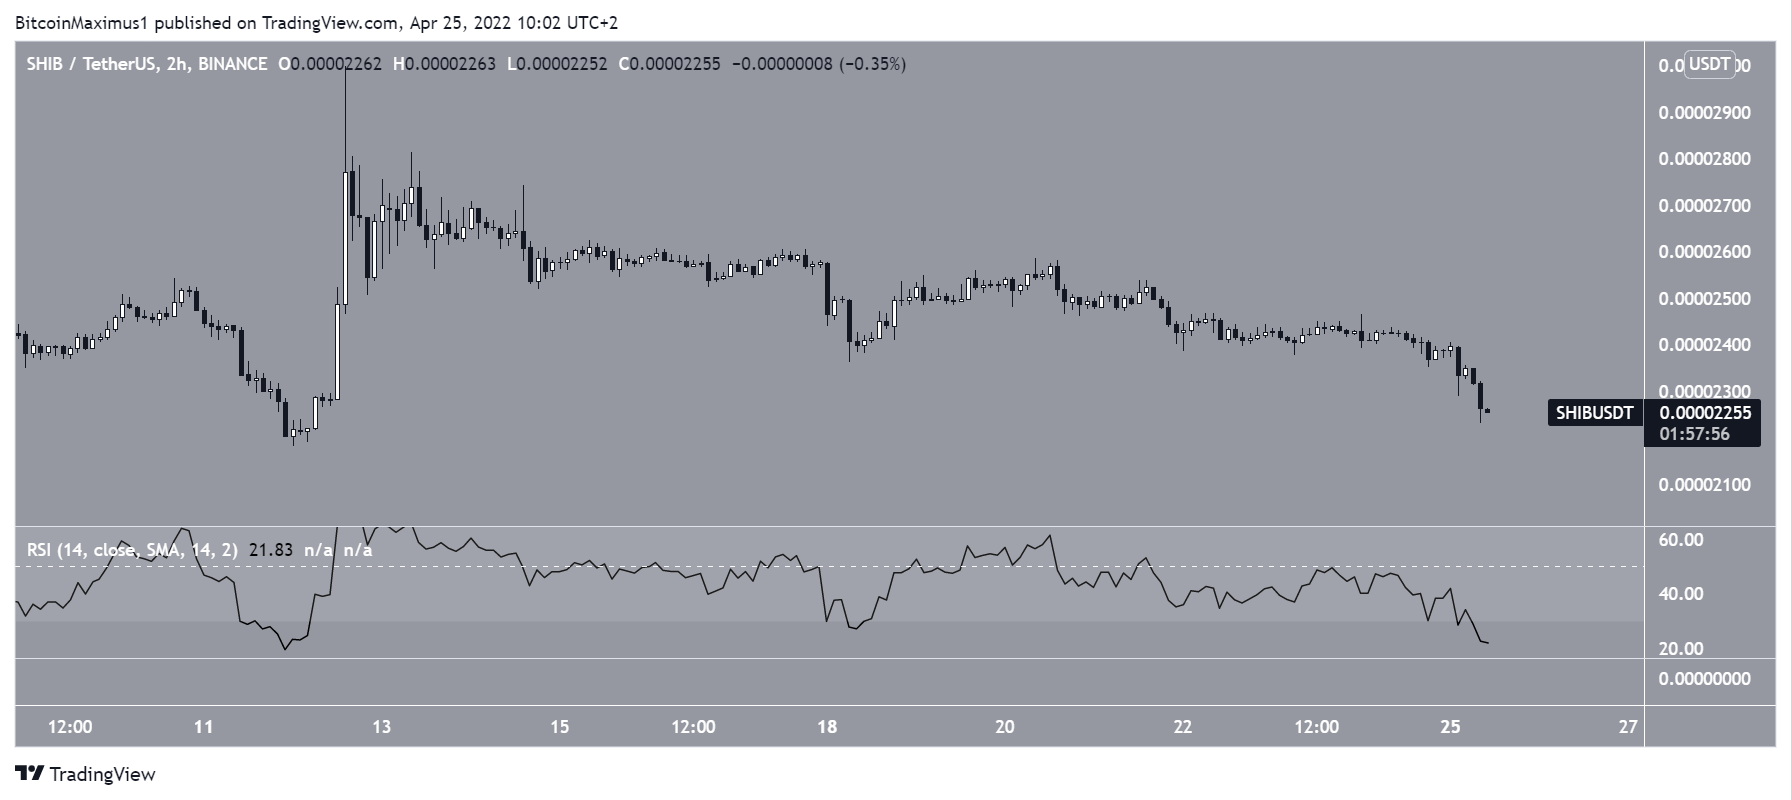
Similarly, there are no bullish signs in the two-hour chart. While the RSI is extremely oversold, there is no bullish divergence in place. Therefore, it seems more likely that SHIB will break down from the triangle.
Potential SHIB breakdown
If a breakdown were to occur, the 0.85 Fib level target, which is the final level prior to a full retracement, would be found at $0.000018, coinciding with the yearly lows.
However, a movement that travels the entire height of the pattern could potentially take SHIB all the way back to $0.0000060. A drop to this level would completely negate the entire upward move that began in October 2021.

For BeInCrypto’s latest Bitcoin (BTC) analysis, click here
Disclaimer
In line with the Trust Project guidelines, this price analysis article is for informational purposes only and should not be considered financial or investment advice. BeInCrypto is committed to accurate, unbiased reporting, but market conditions are subject to change without notice. Always conduct your own research and consult with a professional before making any financial decisions. Please note that our Terms and Conditions, Privacy Policy, and Disclaimers have been updated.
