
Bitcoin (BTC) is trading very close to two long-term support levels but has yet to show any bullish reversal signs.
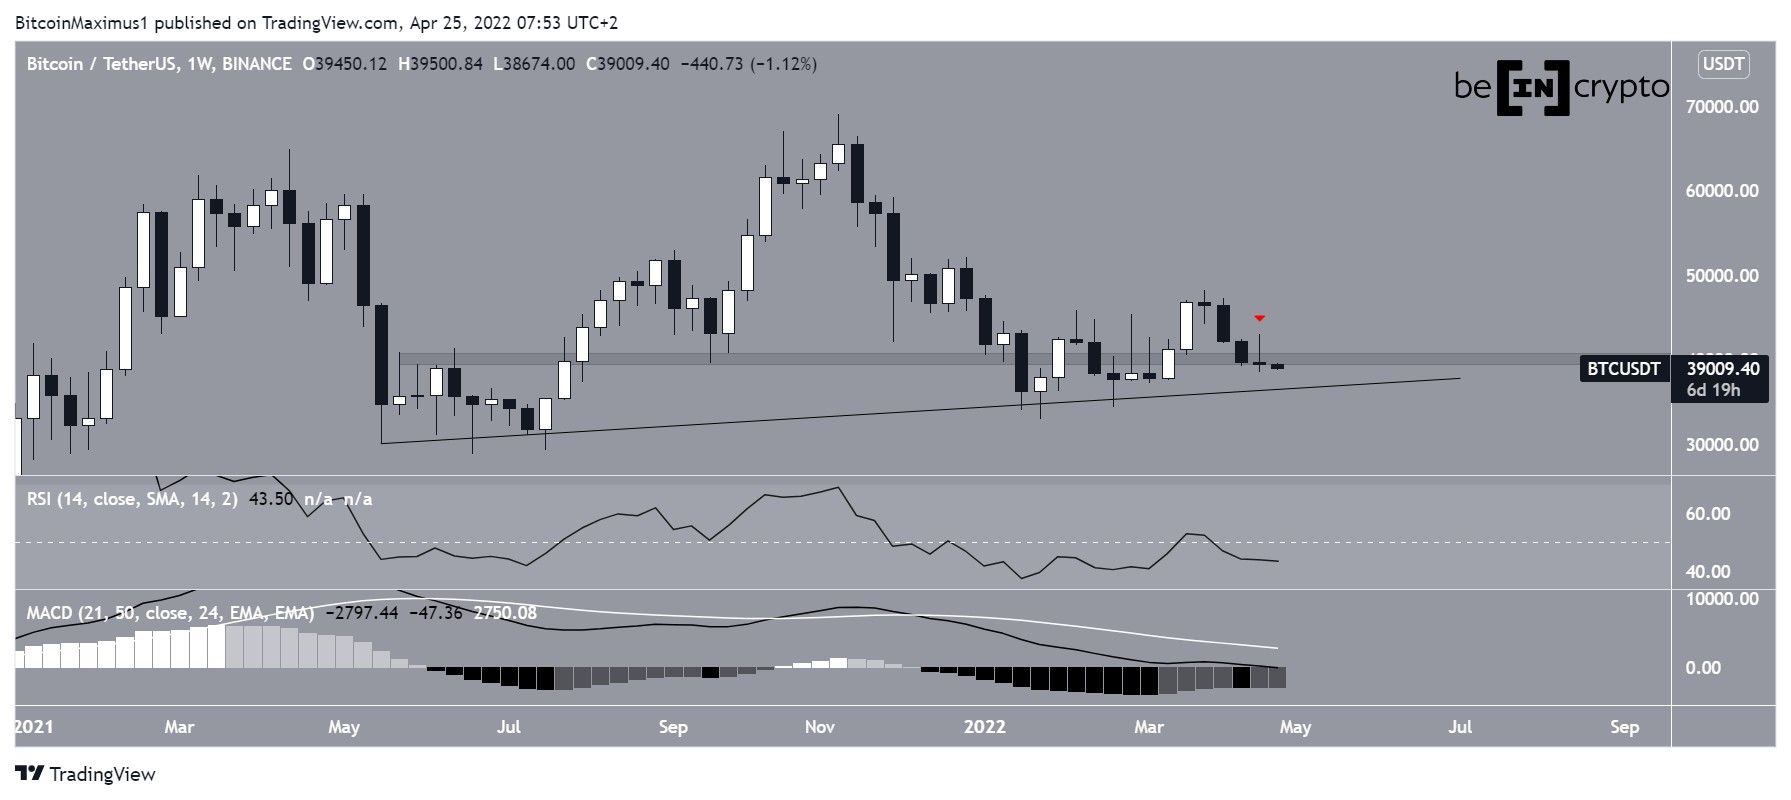
Bitcoin decreased slightly during the week of April 18-24. While the week began with an upward move that led to a local high of $42,976, the price fell during the latter part of the week, creating a long upper wick in the process (red icon). This is considered a sign of selling pressure.
Currently, BTC is trading well below the $43,000 area. This is a crucial long-term level that has intermittently acted as both support and resistance since May 2021.
Both the RSI and MACD are bearish and continue to move downwards. the RIS is below 50 while the MACD is negative.
Despite this, BTC is still trading above an ascending support line that’s been in place since May 2021. The line is currently close to $38,000.
Mixed readings
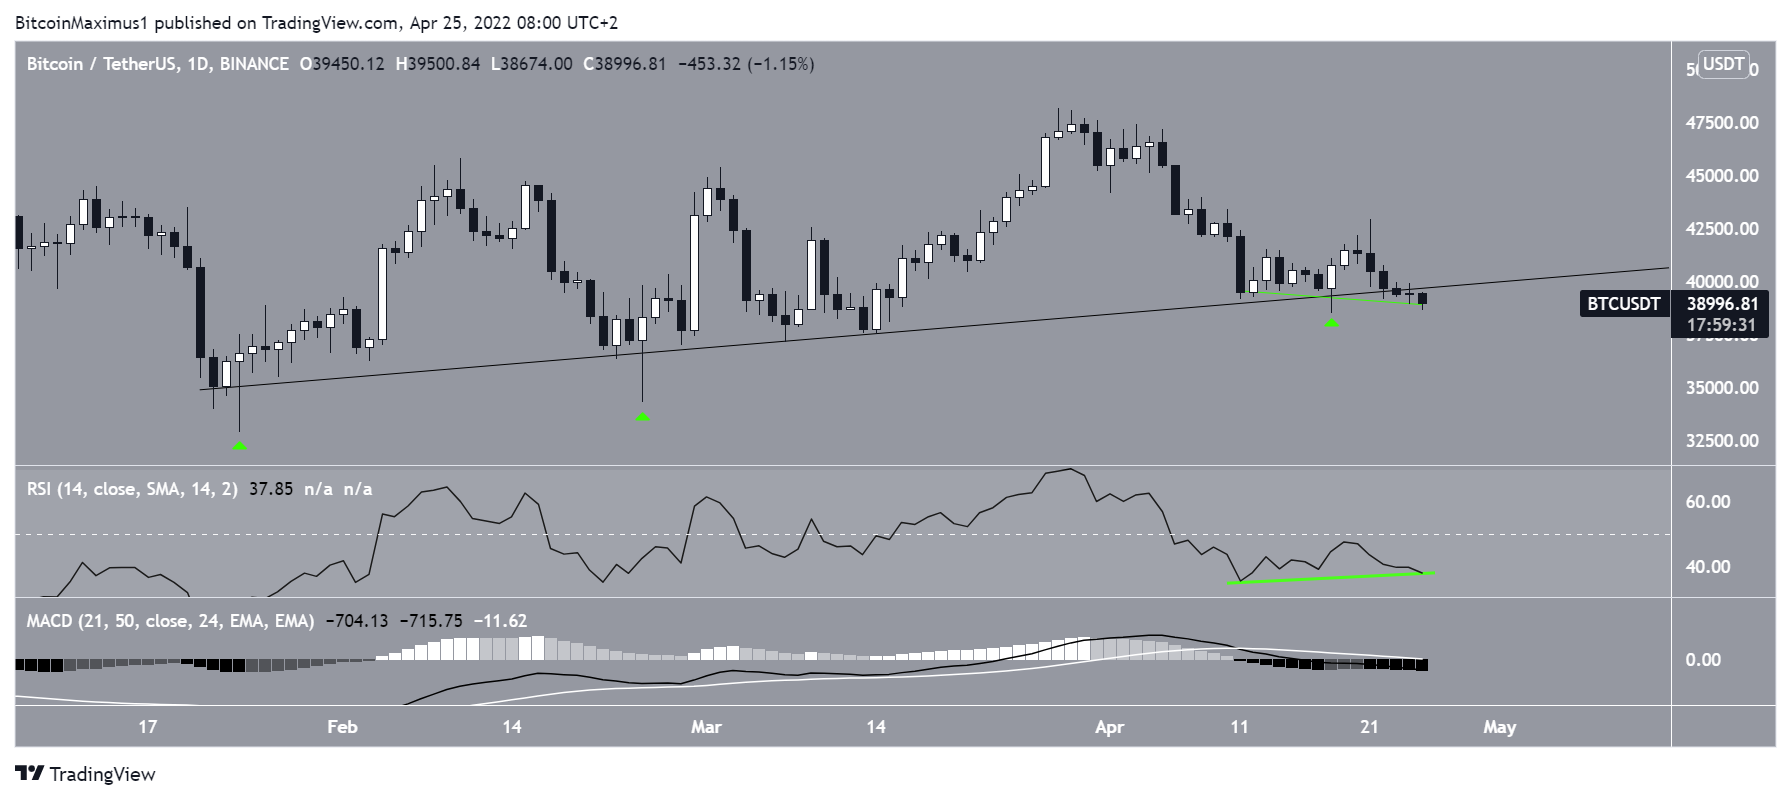
The daily chart provides mixed readings.
BTC had been following an ascending support line since Jan. 24. It validated the line numerous times, even creating a few bullish engulfing candlesticks (green icons).
The price now seems to be in the process of breaking down from the line at a time when the MACD is decreasing and is negative.
However, the RSI is in the process of generating a bullish divergence (green line), this is a signal that often precedes bullish trend reversals.
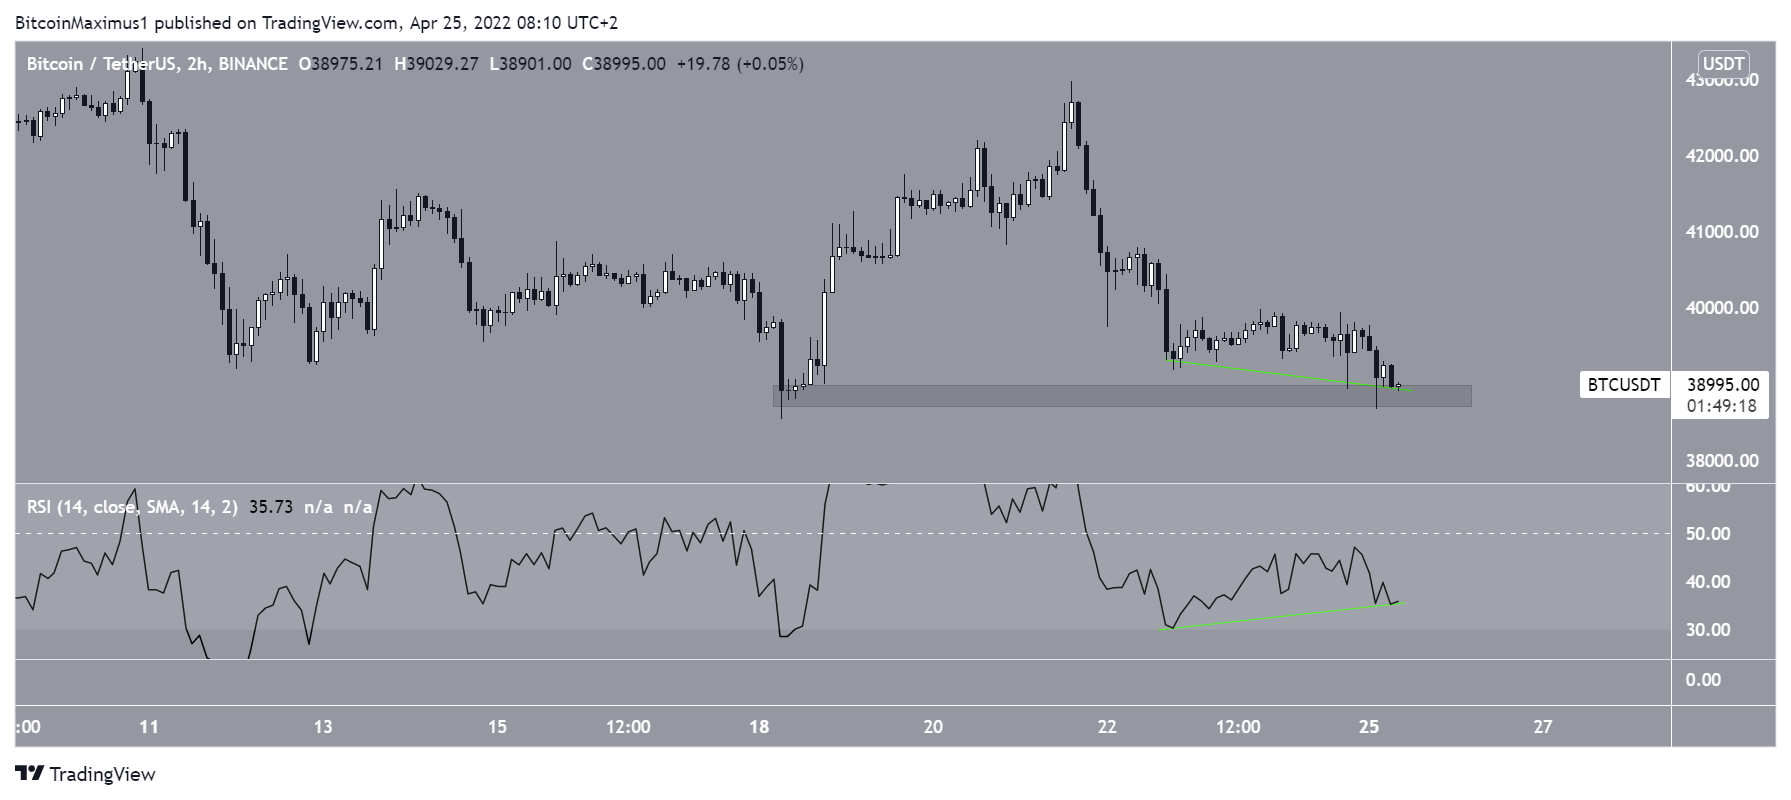
Similar to the daily time frame, the two-hour chart shows a growing bullish divergence in the RSI (green lines). Besides that, there are no other bullish signs in place.
BTC is now at serious risk of falling firmly below the $38,800 area. If this occurs, it may lead to a rapid drop to retest support levels between $30,000 and $33,000.
BTC wave count analysis
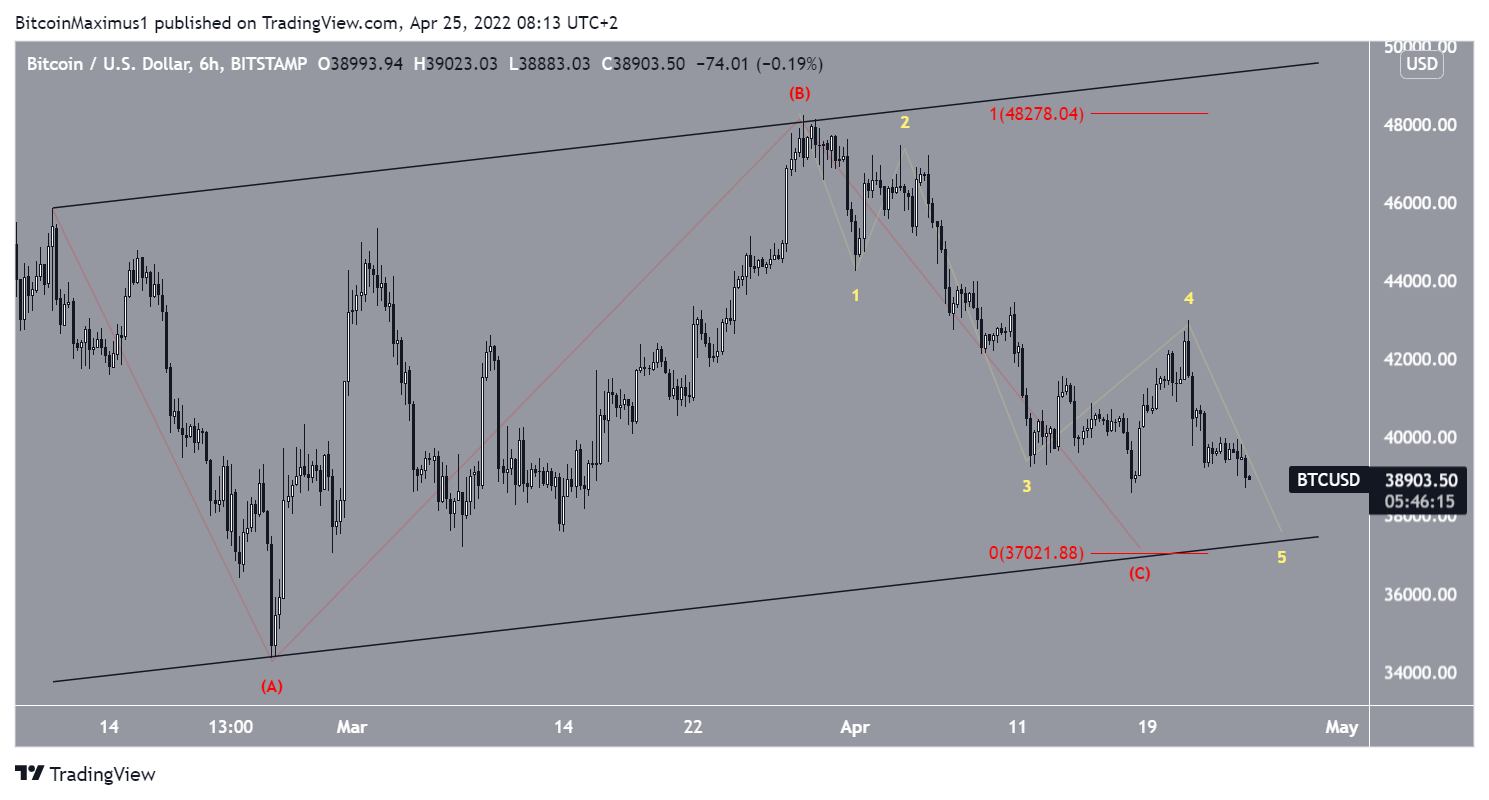
The wave count suggests that since Feb. 10, BTC has been decreasing in what could be an A-B-C corrective structure (red). If correct, it’s currently in the C wave. The sub-wave count is shown in yellow in the chart below.
Giving waves A and C a 1:1 ratio would lead to a low of $37,000. This would also reach the support line of the ascending parallel channel.
The long-term wave count suggests that a significant upward move would be likely once this wave is complete.
For BeInCrypto’s previous Bitcoin (BTC) analysis, click here
