
Shiba Inu (SHIB) price has likely completed its relief rally and is in the final wave of its correction. A breakdown from the short-term channel would confirm this.
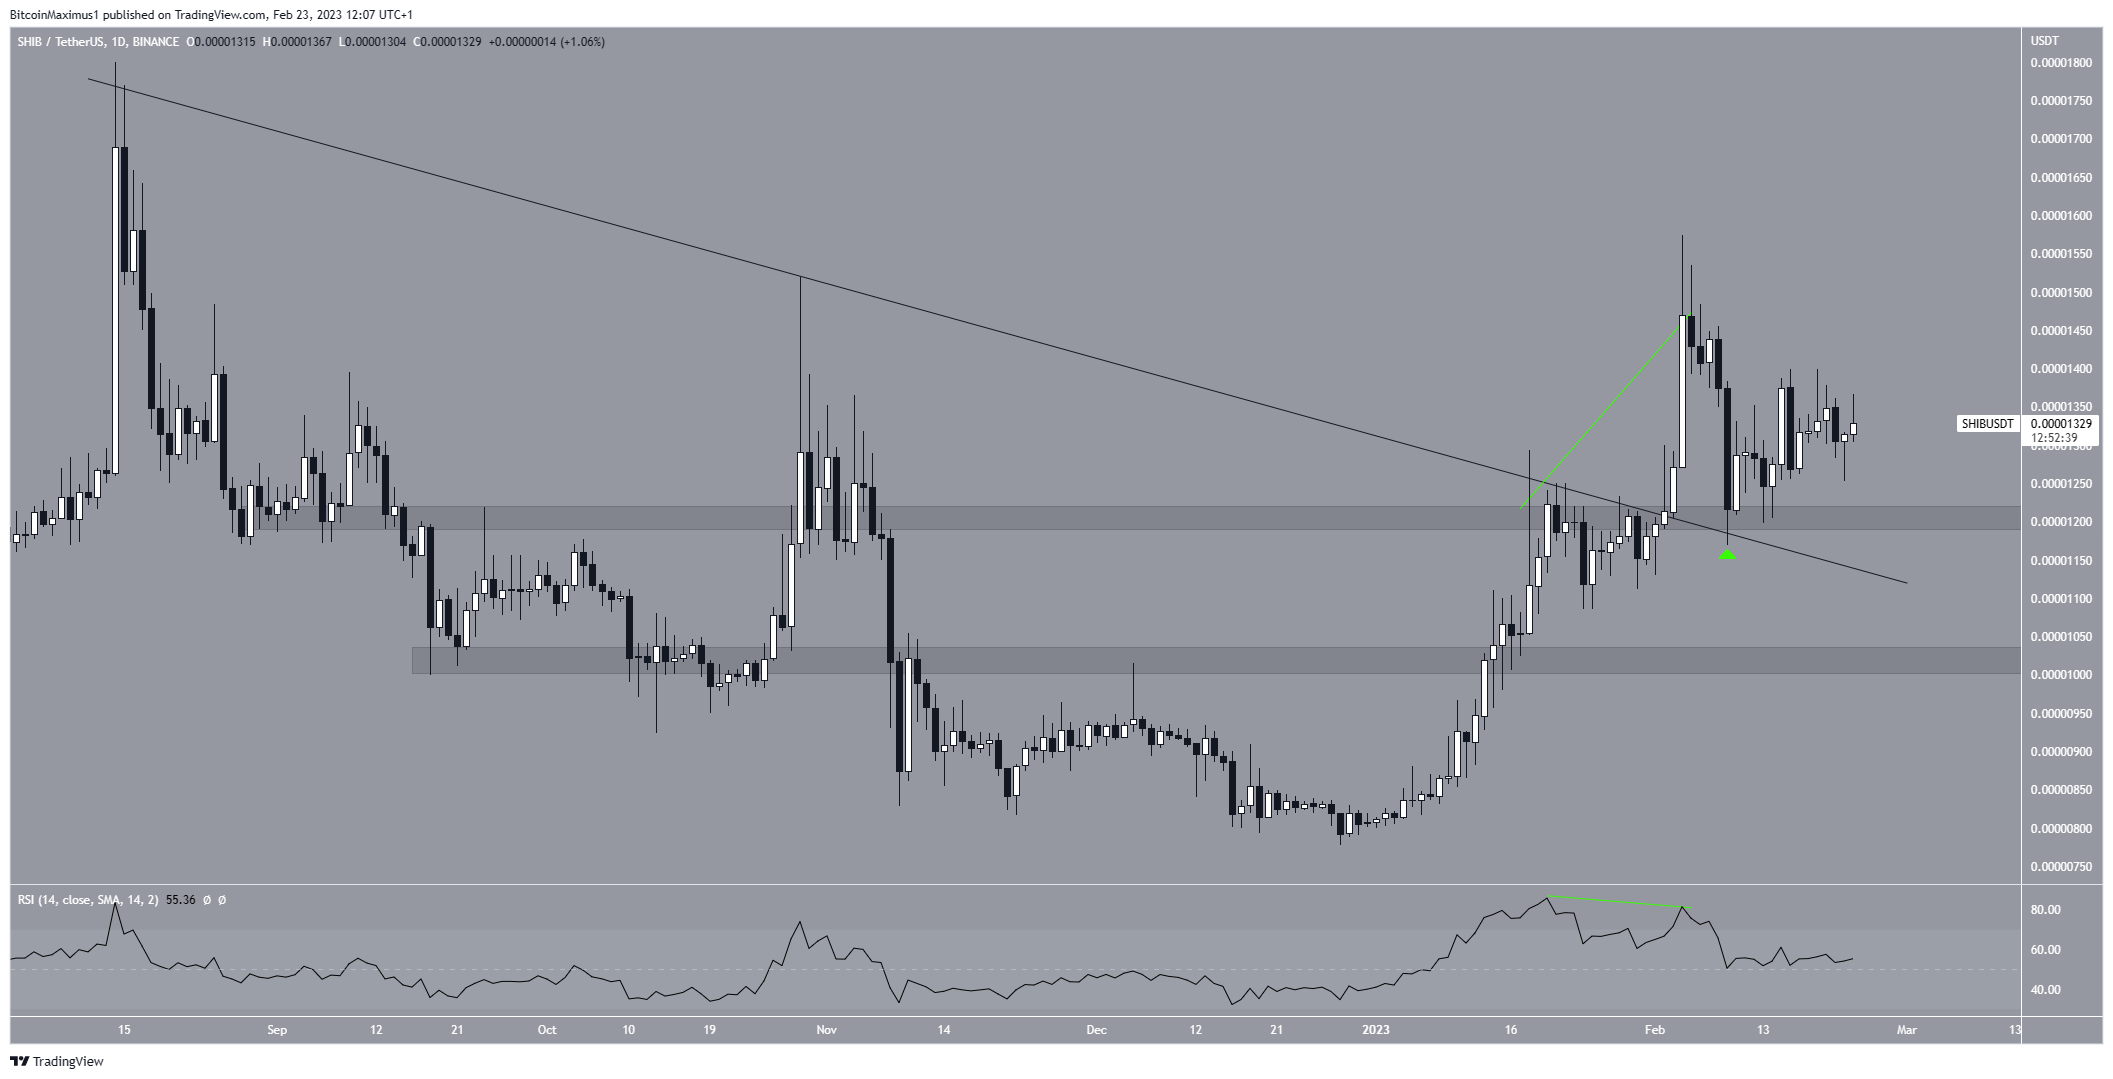
The SHIB price has decreased since Feb. 4, when it peaked at $0.0000157. The drop was initiated by a bearish divergence in the daily RSI (green line).
The price recovered after the decrease and is currently trading above $0.0000120 support level. This is a key level since it has served as both resistance and support intermittently over the last six months. Furthermore, the daily RSI is at 50, revealing a neutral trend.
As a result, whether the Shiba Inu price closes below $0.0000120 or bounces may determine the future trend. A close below it could lead to a fall toward $0.0000102, while a bounce could lead to highs near $0.0000157.
To decide which will occur, a look at a shorter time frame price history is required.
Shiba Inu (SHIB) Price Wave Count Supports Drop
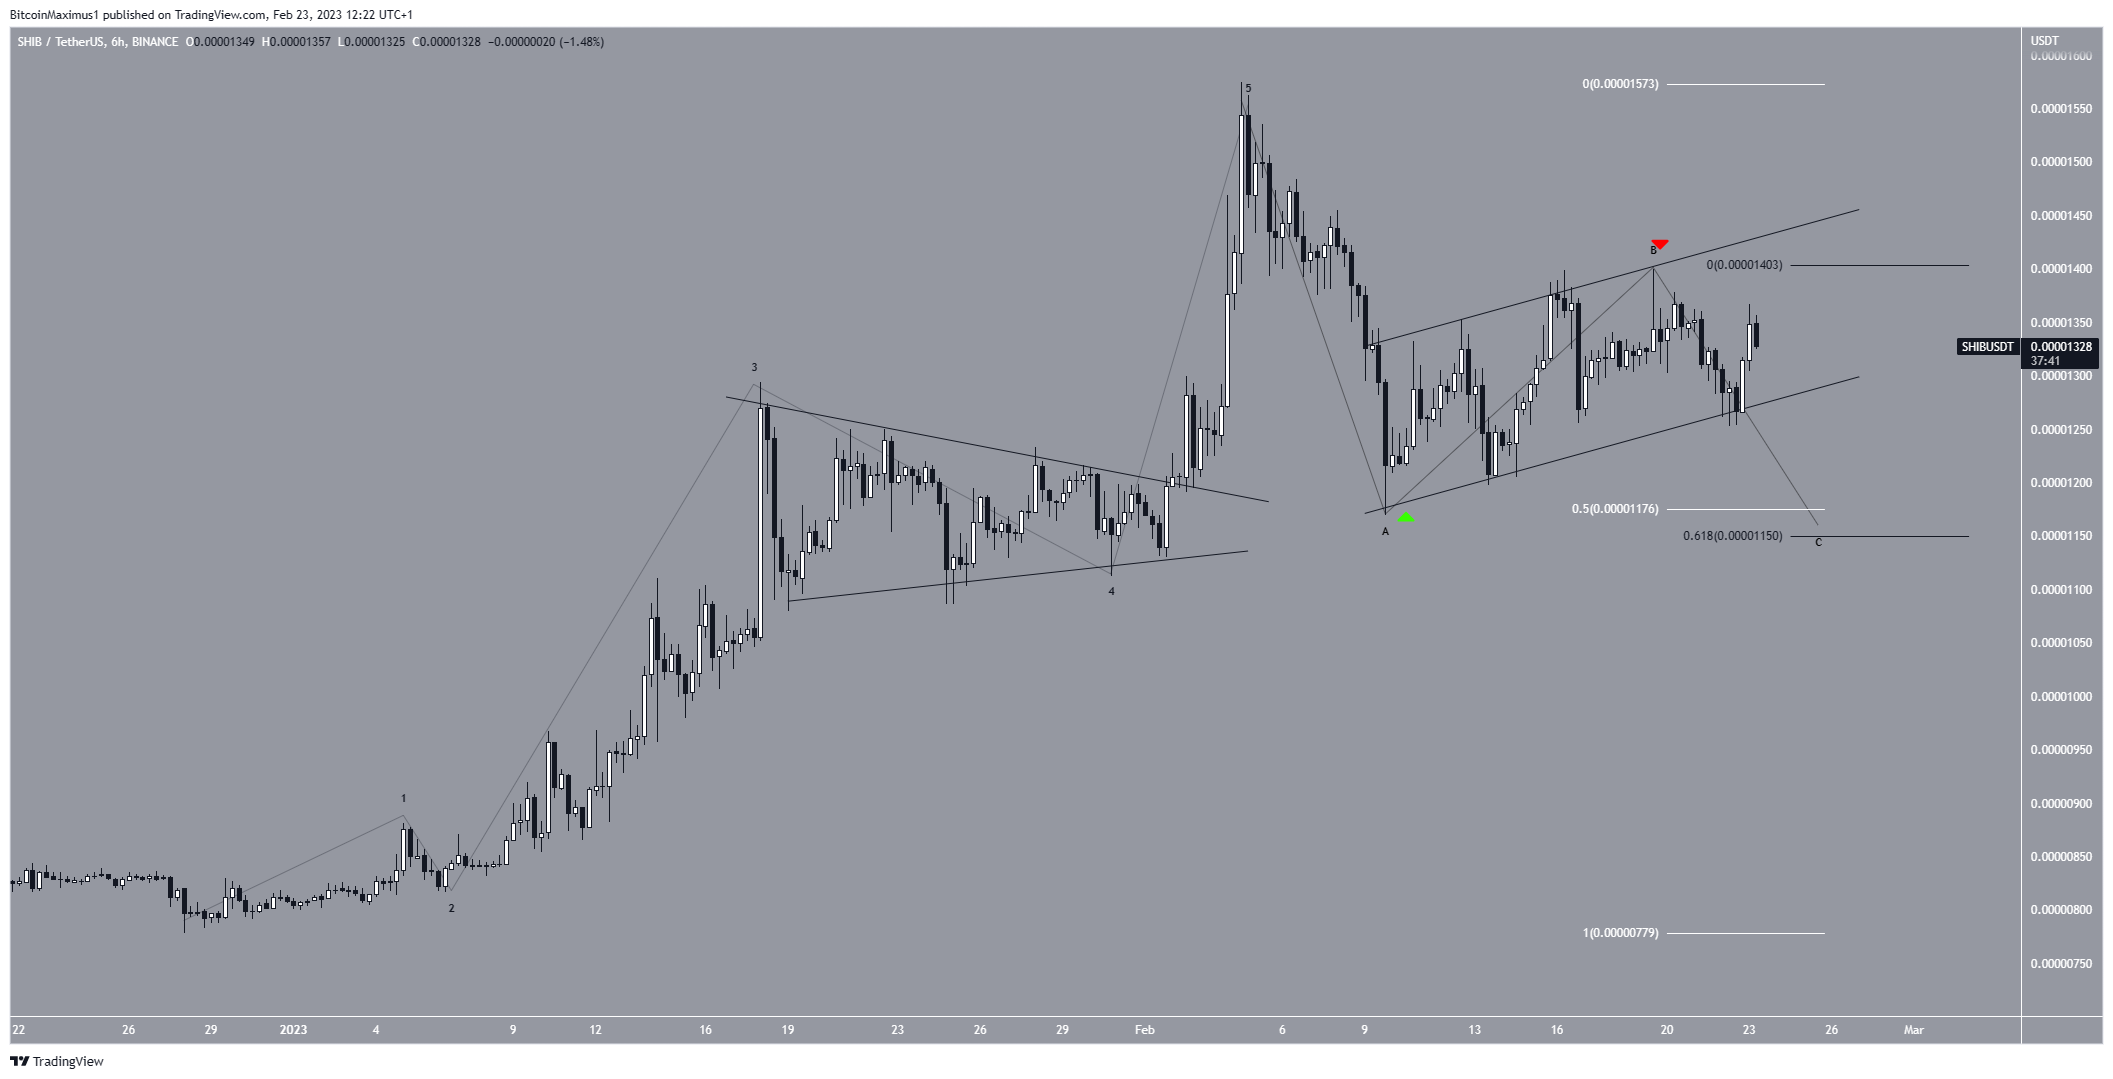
The technical analysis for the six-hour time frame implies that the price will fall. The Shiba Inu token price finalized a five-wave upward movement, reaching a high of $0.0000157. This wave count is characterized by the triangle that forms wave four and the ensuing sharp decrease.
After the high, the SHIB price fell to $0.0000117 before bouncing. The low created a long lower wick (green icon), confirming support at the 0.5 Fib retracement level (white). Because it also corresponds to the previously defined horizontal support area, this is an important support level. As a result, it was most likely the bottom of the corrective A wave.
If the count is correct, the SHIB token price is now in the middle of the C wave of an A-B-C corrective structure. The entire correction could end at the 0.5 Fib retracement support level of $0.0000118. This would also give waves A:C a 1:0.618 ratio, relatively common in such corrections. Following the correction, the Shiba Inu price could begin another upward movement.
If the price of Shiba Inu fell below the yearly lows of $0.0000077, this bullish forecast would be rendered invalid. Shiba’s price could fall to $0.0000050 in that case.
A drop below it, however, would jeopardize the upward movement due to the strong support area at $0.0000102.
To conclude, the most likely SHIB price forecast is a breakdown from the channel and decrease toward the $0.0000115-$0.0000118 area. A breakout from the channel would negate this bearish forecast. Instead, it could lead to a new yearly high close to $0.0000180.
For BeInCrypto’s latest crypto market analysis, click here.
