


The Shiba Inu (SHIB) price has broken out from a long-term resistance line and shows signs of a completed correction.
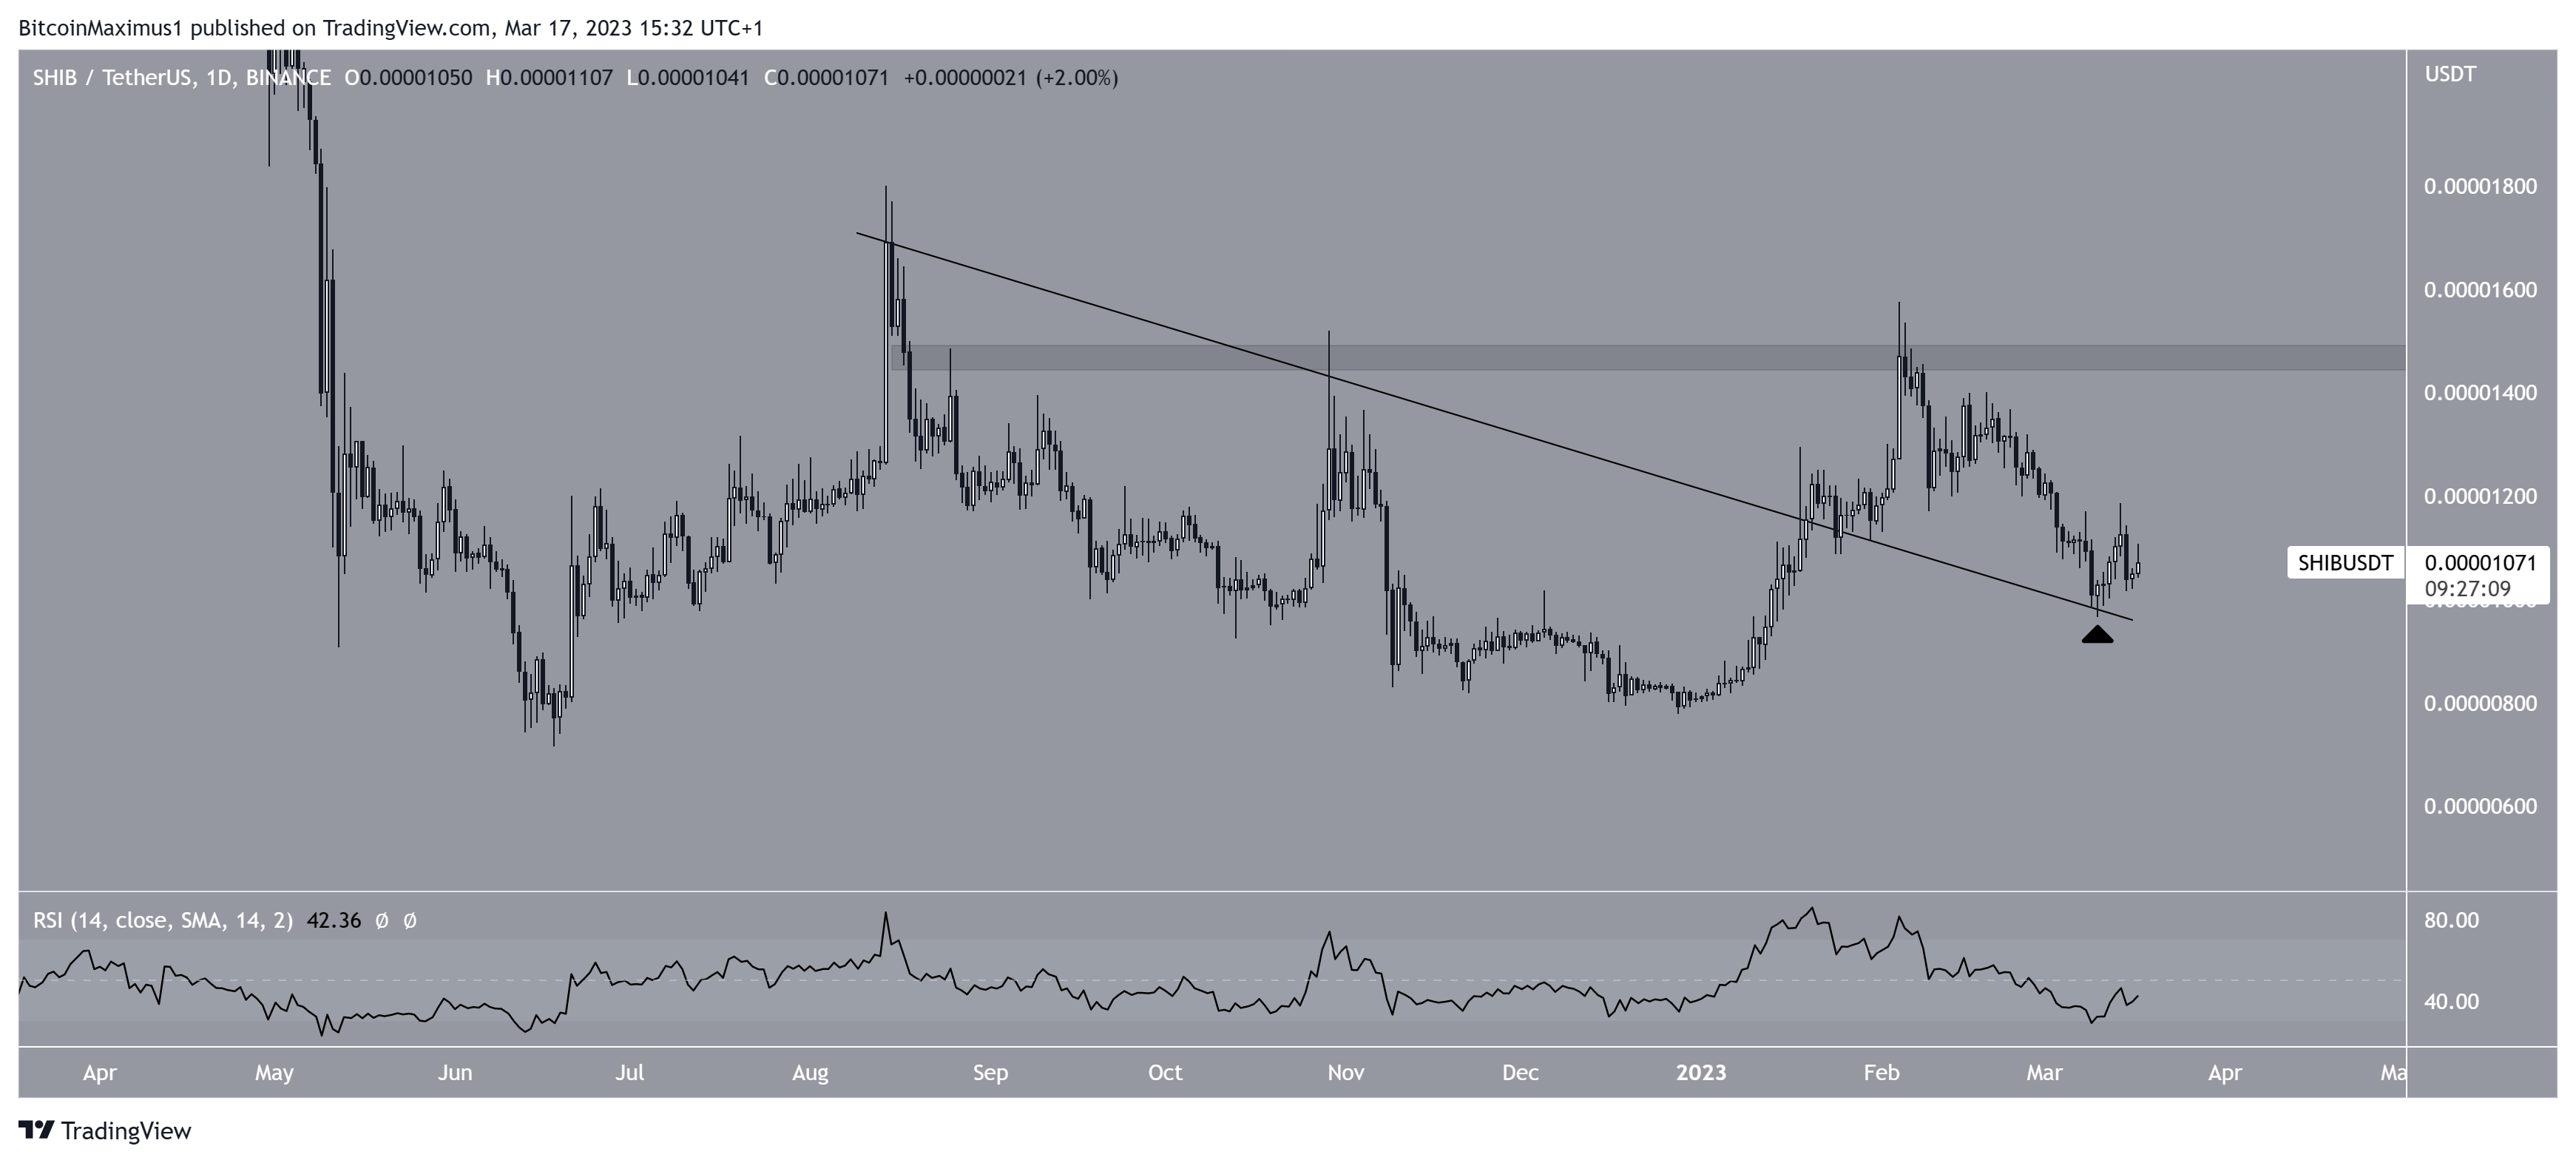
The Shiba Inu coin price broke out from a descending resistance line in the end of January. Afterward, it reached a new yearly high of $0.0000154 before falling. The decrease caused a validation of the line as support on May 7 (black icon). While the price has bounced since, the daily RSI is still below 50. Therefore, it is not clear that the trend is bullish.
If the increase continues, the price of Shiba Inu could reach the $0.0000147 resistance area. However, if it falls below the descending resistance line, it will confirm that the trend is bearish. In that case, the downward movement could accelerate toward the next closest support at $0.00000850.
Is Shiba Inu (SHIB) Price Correction Complete?
The technical analysis from the six-hour time frame suggests that the entire SHIB price correction may be complete. The reason is the wave count. SHIB completed a five-wave upward movement beginning in January and decreased in an A-B-C structure afterward. Waves A:C had an exactly 1:1 ratio.
Moreover, the overlap between the current high and the wave A low (red line) indicates that the correction is complete. A breakout from the short-term descending resistance line and reclaim of the 0.618 Fib (white) support would confirm this. However, if the SHIB token price fails to break out, a fall to the $0.00000850 support could follow.
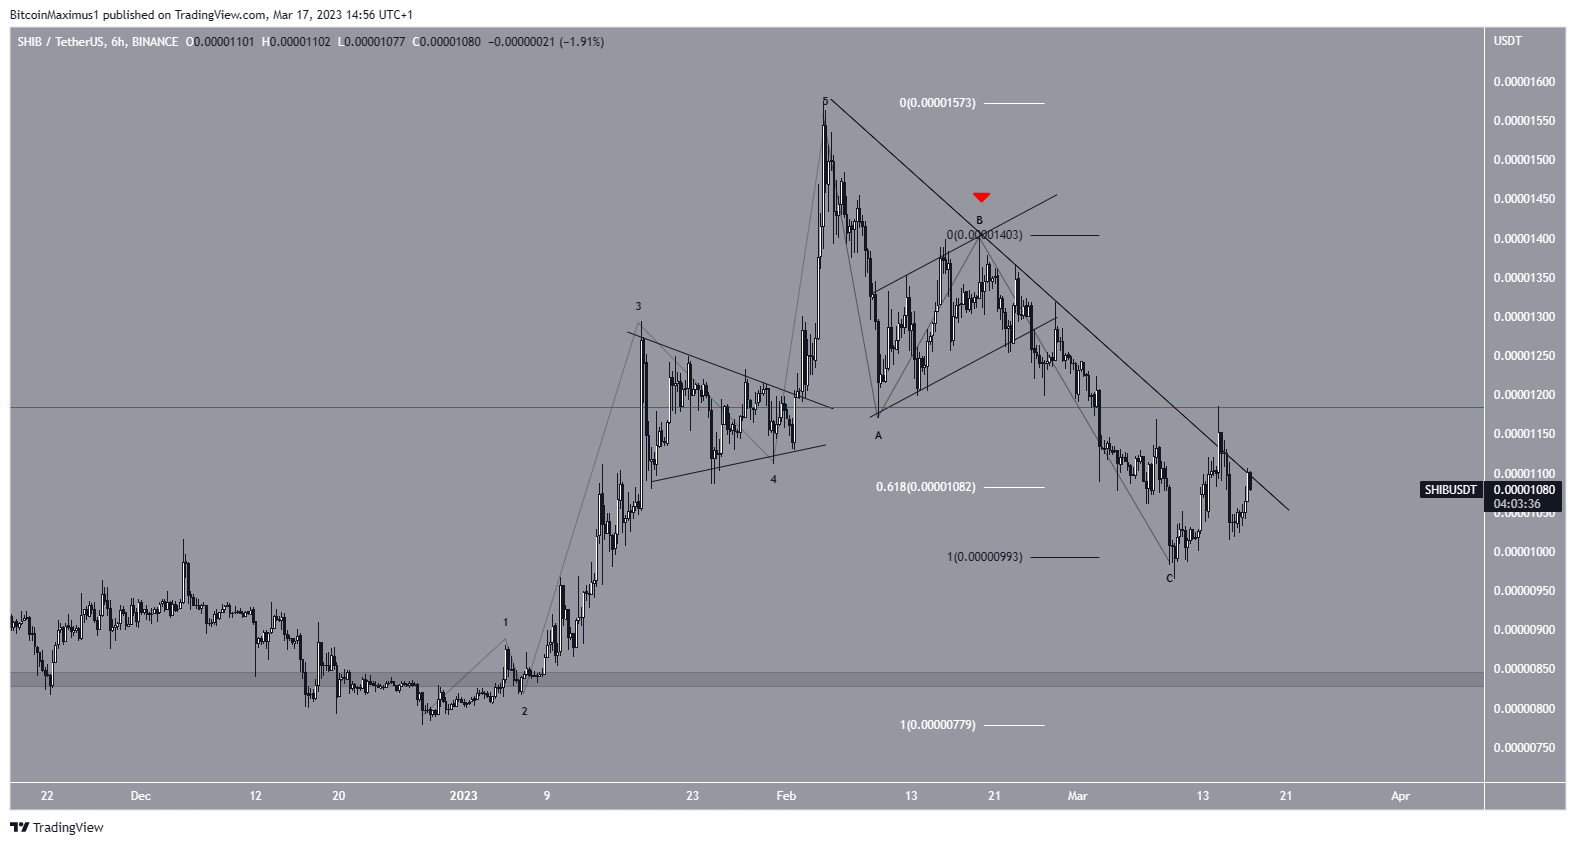
To conclude, it is possible that the SHIB price completed an A-B-C correction and will increase toward at least $0.0000160. However, if it fails to break out from the descending resistance line, a fall to the $0.00000850 support area could follow.



