


The Shiba Inu (SHIB) price is due for a relief rally before another drop completes the entire correction.
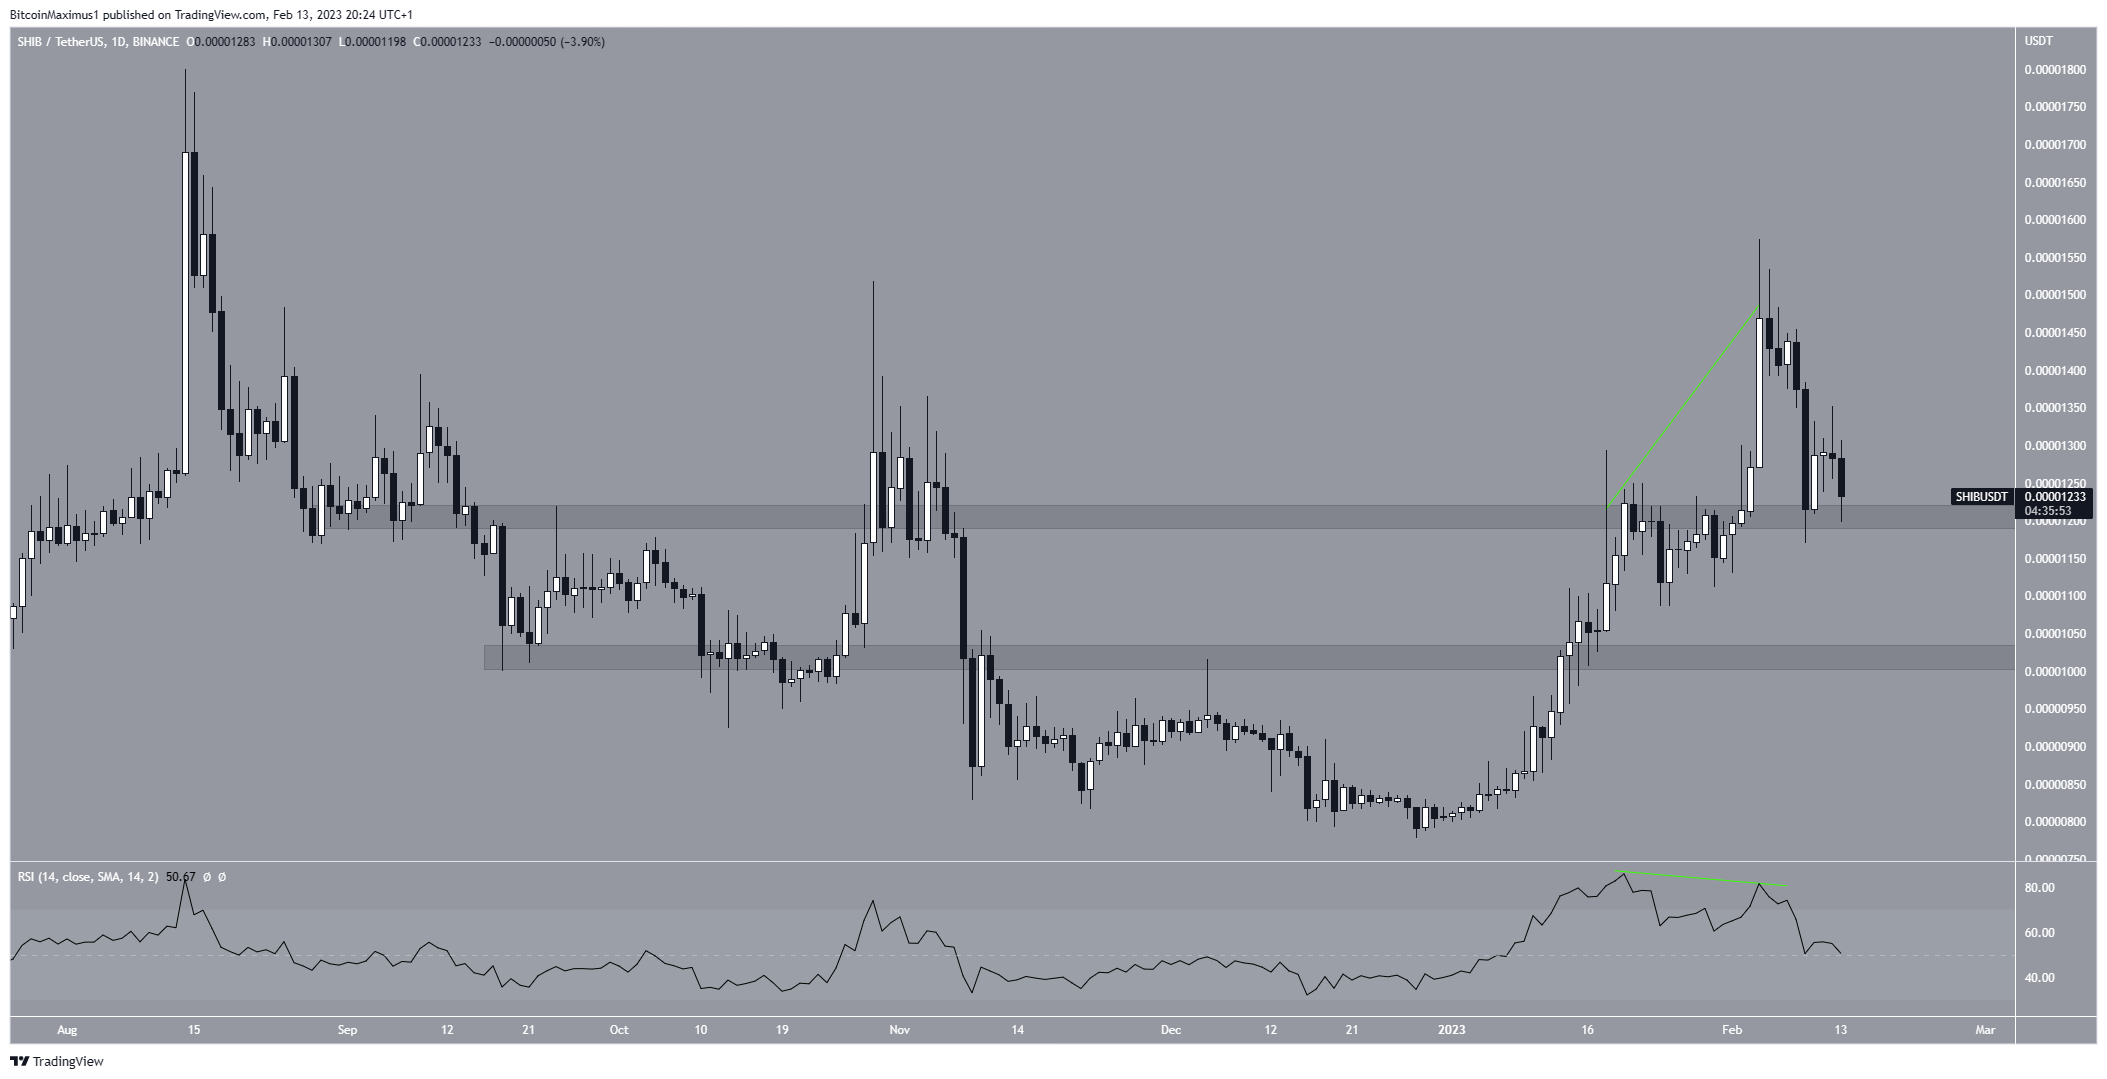
The price of SHIB has fallen since Feb. 4, when it reached a high of $0.0000157. The decrease was preceded by a bearish divergence in the daily RSI (green line).
After the drop, the price bounced at the $0.0000120 horizontal support area and is now trading slightly above it. This is a crucial area since it has intermittently acted as both resistance and support for six months. Moreover, the daily RSI is at 50, indicating a neutral trend.
Therefore, whether the Shiba Inu price closes below $0.0000120 or bounces could determine the future trend’s direction. A close below it could lead to a fall toward $0.0000102, while a bounce could lead to highs near $0.0000157.
Shiba Inu (SHIB) Price Starts Relief Rally
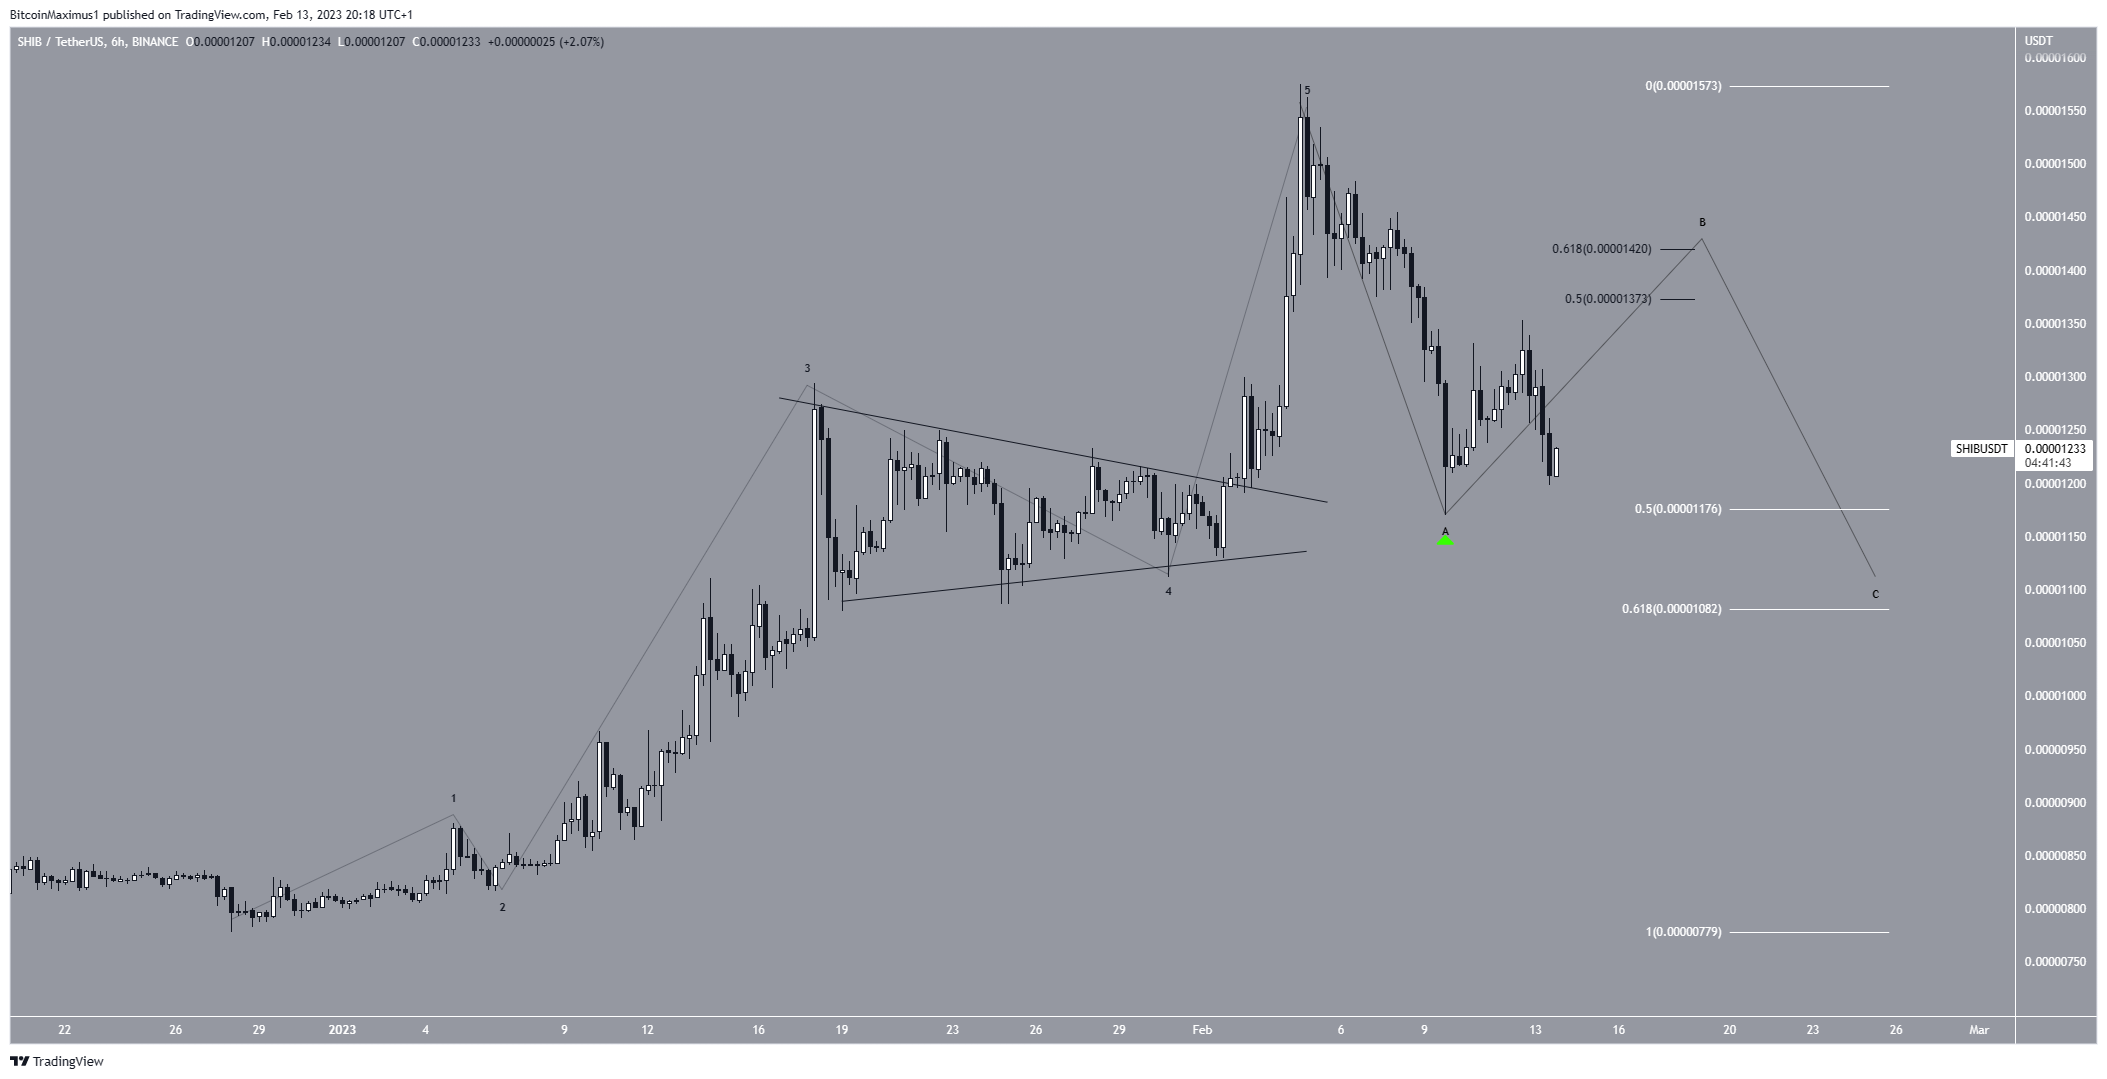
The short-term six-hour time frame technical analysis shows that the Shiba Inu token price completed a five-wave upward movement that led to the $0.0000157 high. The triangle that was part of wave four is the distinguishing feature of this move, as is the subsequent sharp decrease.
After the high, the SHIB price fell to a low of $0.0000117 before bouncing (green icon). The low created a long lower wick and validated the 0.5 Fib retracement level as support (white). This is an important support level since it also coincides with the previously outlined horizontal support area.
If the count is correct, the SHIB price is now trapped in an A-B-C corrective structure that may end at the 0.618 Fib retracement support level of $0.0000108. If that’s the case, it’s currently in the B wave, which could end in the next 24 hours. As a result, after an initial bounce toward the 0.5-0.618 Fib resistance (black) at $0.0000137-$0.0000142, another drop will occur to complete the correction.
After the correction, the price of Shiba Inu could rise to its Aug. 2022 high of $0.0000180.
A drop below the yearly lows of $0.0000077 would render this bullish Shiba Inu price forecast invalid. In that case, the SHIB price may fall as low as $0.0000050.
However, due to the strong horizontal area at $0.0000102, a decrease below it would also put the entire upward movement at risk.
To conclude, the most likely Shiba Inu price forecast is an increase toward $0.0000137-$0.0000142 before another drop to complete the correction. A movement above the yearly high of $0.0000157 would mean that the correction is complete and could lead to highs above $0.0000180.
For BeInCrypto’s latest crypto market analysis, click here.


