


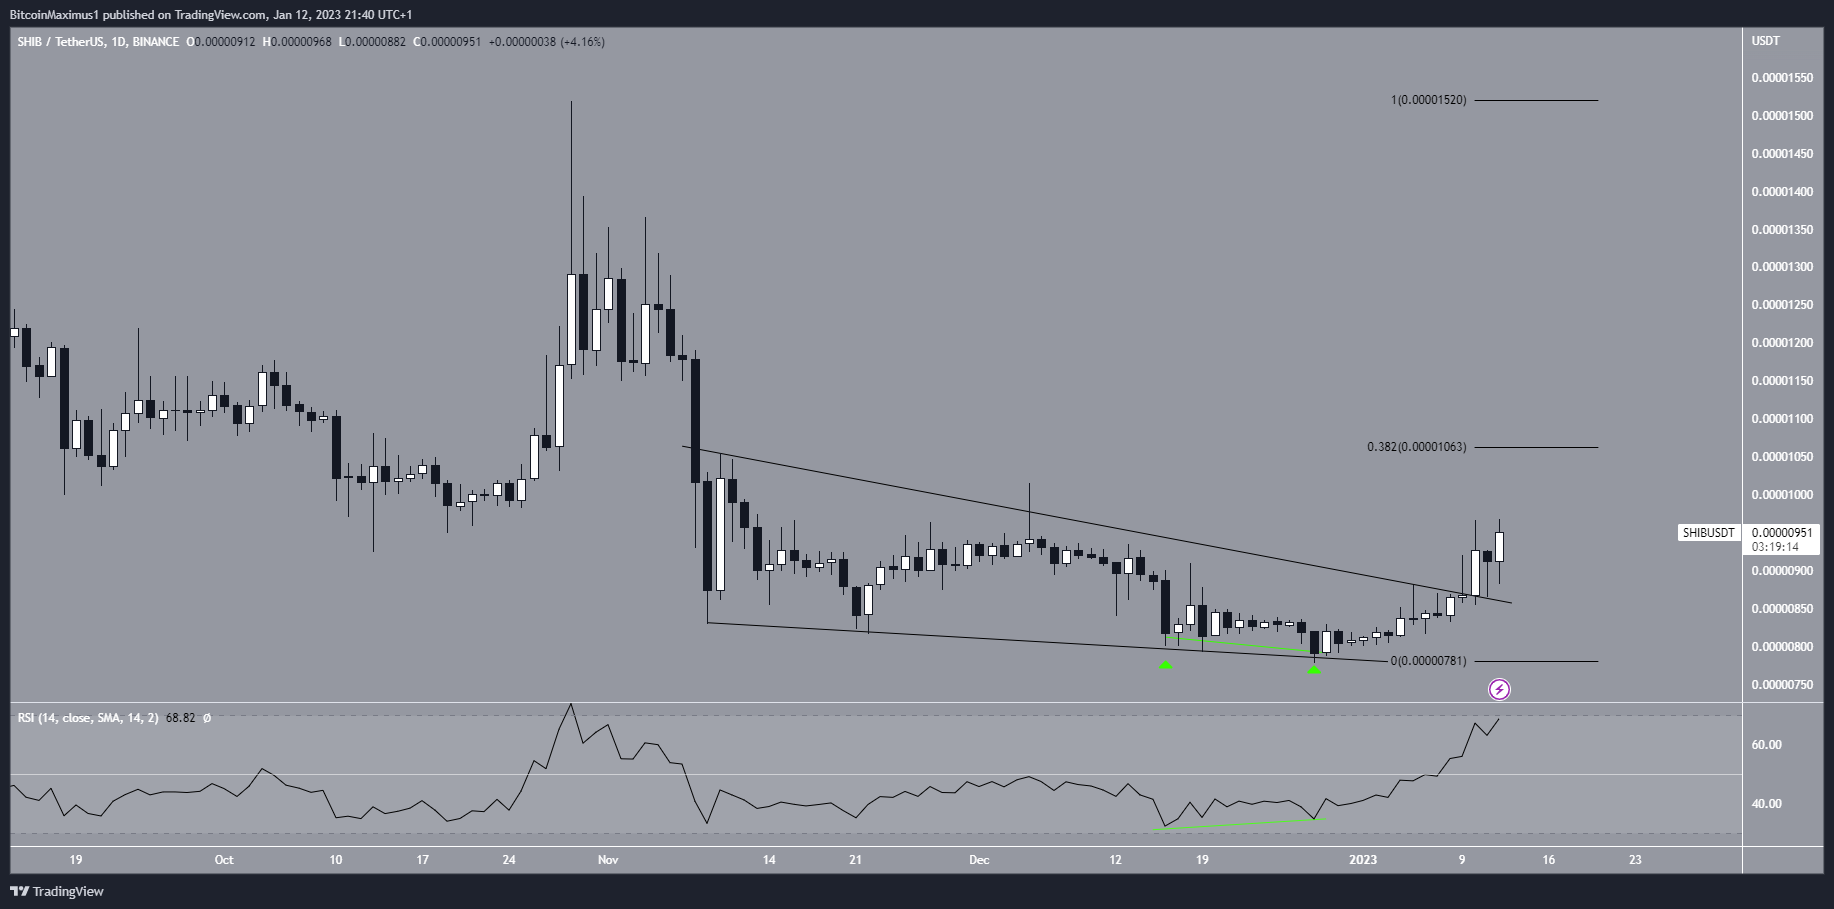
The Shiba Inu (SHIB) price has created a bullish pattern inside a long-term horizontal support area. If confirmed, this could lead to a hefty price rally.
The SHIB price had traded inside a descending wedge since Nov. 9. On Dec. 16 and 28, the price bounced at the support line of the wedge (green icon) and initiated the current upward movement. The bounce was combined with bullish divergence in the RSI, further increasing its legitimacy. Moreover, the RSI has now moved above 50.
On Jan. 10, the SHIB price broke out from the wedge. So far, it has reached a maximum price of $0.00000968.
If the upward movement continues, the closest resistance area would be at 0.00000106, created by the 0.382 Fib retracement resistance level.
On the other hand, a decrease below the wedge’s resistance line would mean that the breakout was not legitimate, and new lows are likely.
Double Bottom Leads to Rally?
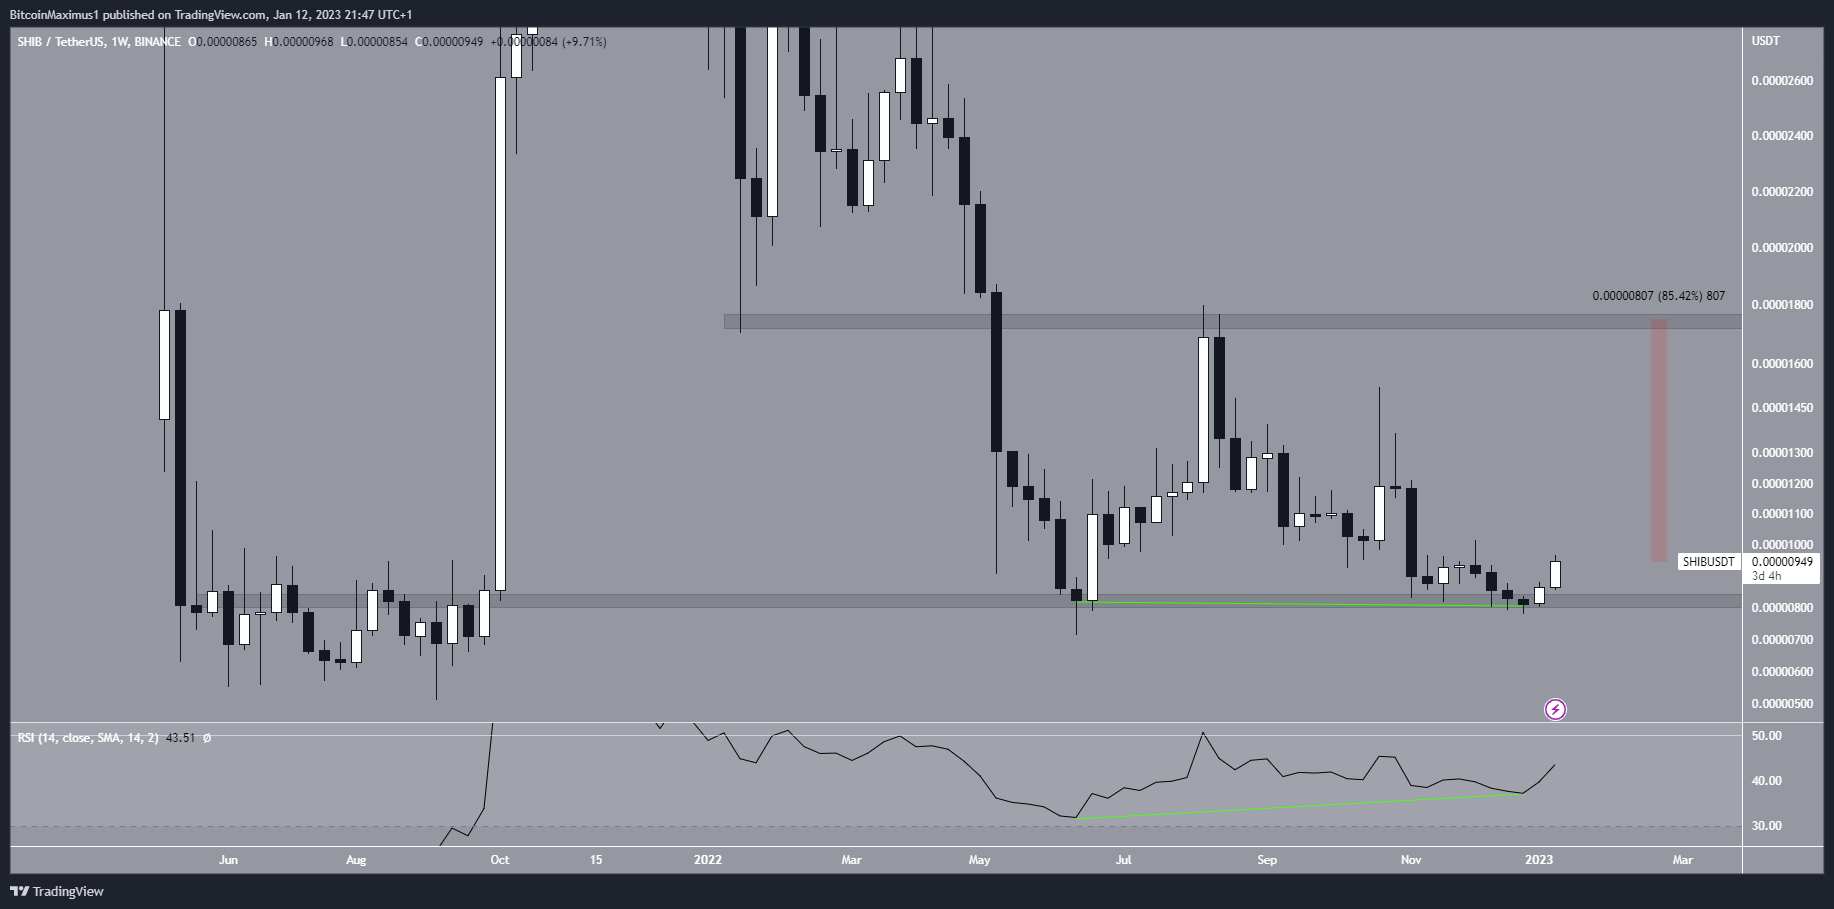
Similar to the daily time frame, the weekly one also provides a bullish outlook.
There are two main reasons for this: First, the Shiba Inu coin price has created a double bottom, which is considered a bullish pattern (green icons). The double bottom occurred inside the long-term $0.0000083 support area, increasing its legitimacy.
Second, the double bottom was combined with bullish divergence in the weekly RSI (green line). Divergences in such long-term time frames are rare. So, this could lead to a significant rally.
In the weekly time frame, the main resistance area is at an average price of $0.0000175. This is an increase of 85%, measuring from the current price.
As a result, there is considerable upside potential if the SHIB coin price confirms its double bottom pattern.
To conclude, the Shiba Inu long-term price prediction is considered bullish due to bullish readings from both the weekly and daily time frames.
A considerable rally is likely, which could continue for 85% in the best-case scenario. A weekly close below the $0.0000083 support area would invalidate this bullish Shiba Inu price analysis.
In that case, the SHIB price could fall toward the next closest support at $0.0000060.
For BeInCrypto’s latest crypto market analysis, click here.


