


Shiba Inu’s (SHIB) price has fallen since December 17, 2023, when a diagonal resistance trend line rejected it.
SHIB trades below a horizontal support area and inside a short-term bearish pattern.
Shiba Inu Consolidates Below Resistance
The technical analysis of the daily time frame shows that SHIB has fallen since the resistance trend line of an ascending parallel channel rejected it on December 17, 2023 (red icon).
After initially bouncing above the $0.0000093 support area, SHIB broke down on January 22. SHIB validated it as resistance (red circle) on January 29 and has fallen since.
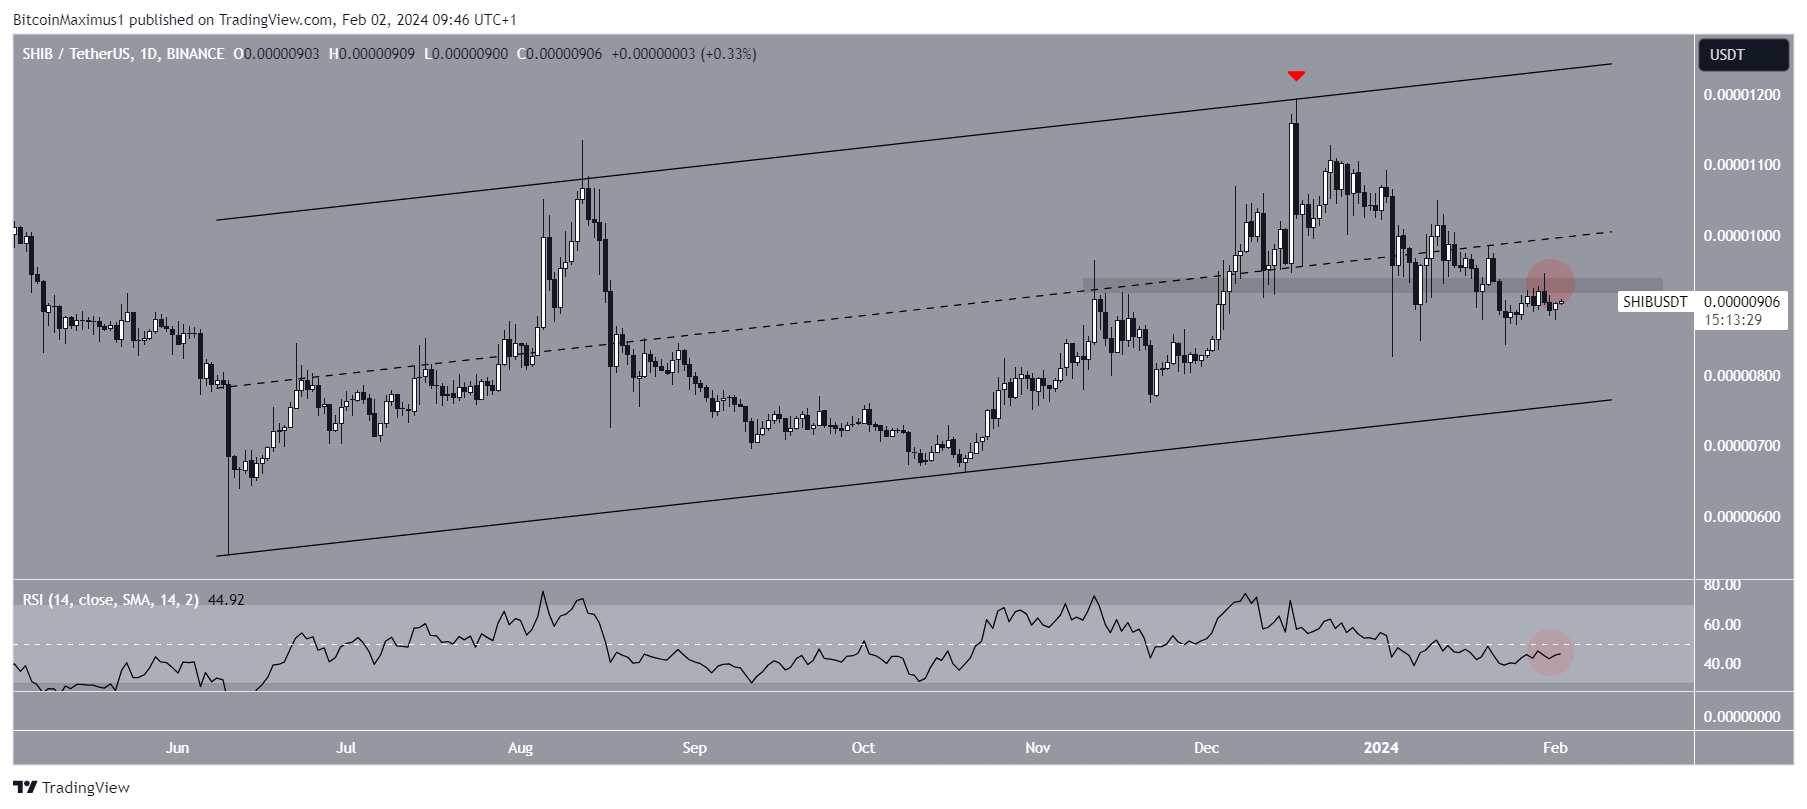
The daily Relative Strength Index (RSI) is bearish. When evaluating market conditions, traders use the RSI as a momentum indicator to determine whether a market is overbought or oversold and whether to accumulate or sell an asset.
If the RSI reading is above 50 and the trend is upward, bulls still have an advantage, but if the reading is below 50, the opposite is true. The indicator made numerous failed breakout attempts above 50 (red circle) and trades below the level.
SHIB Price Prediction: What’s the Trend’s Direction?
The outlook from the short-term six-hour time frame is similarly bearish. The chart shows that SHIB trades inside a descending triangle considered a bearish pattern. It is approaching the end of the pattern, so a decisive movement is expected soon.
The six-hour RSI supports the breakdown since it was rejected by the 50 trend line (red icon).
If SHIB breaks down from the triangle, it can fall 16% to the channel’s support trend line at $0.0000076.
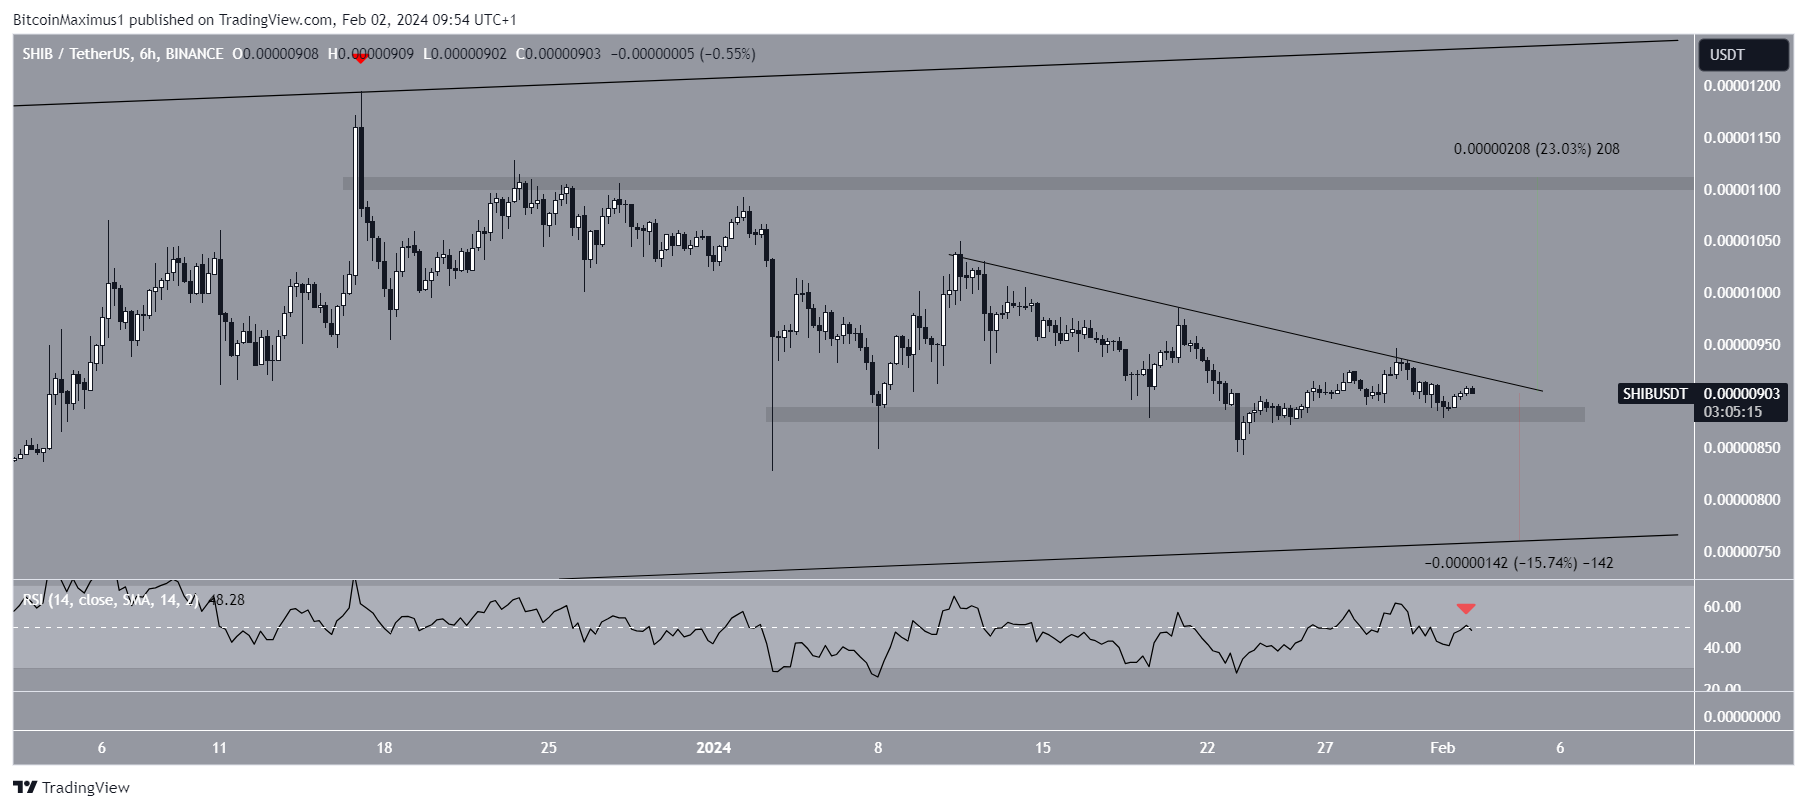
Despite this bearish SHIB price prediction, a breakout from the resistance trend line can trigger a 23% increase to the next resistance at $0.0000110.
For BeInCrypto’s latest crypto market analysis, click here.


