


The Shiba Inu (SHIB) breakout from a short-term channel saved the price from falling to a new yearly low.
Will this breakout continue towards long-term resistance, or will the SHIB price reverse downwards once more?
SHIB Decreases Toward Yearly Lows
The weekly timeframe technical analysis for Shiba Inu shows that the price has fallen under a descending resistance trendline since August 2022. More recently, the line caused a rejection in August 2023.
The altcoin has fallen since, reaching a low of $0.0000066 this week.
While the Shiba Inu price may be trading inside a descending wedge, its support line (dashed) still needs to be validated sufficient times.
Rather, the closest horizontal support area is at $0.0000060.
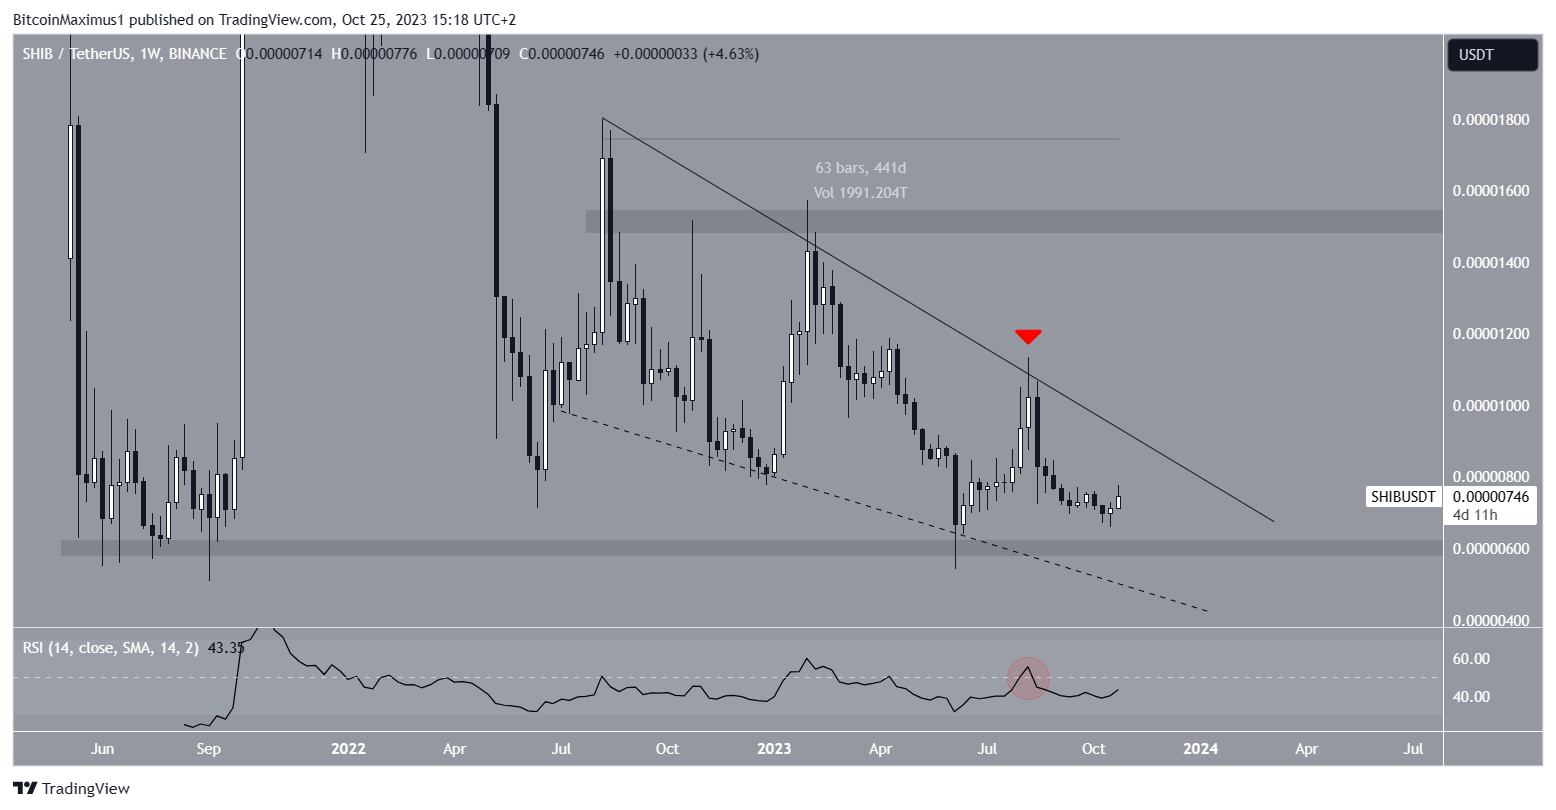
The Relative Strength Index (RSI), a crucial indicator for traders to determine market conditions, has shown a bearish reading for the cryptocurrency.
Bulls have an advantage if the RSI reading is above 50 and the trend is upward But, the opposite is true if the reading is below 50.
In the case of SHIB, the RSI was rejected at 50 (red circle) and is still falling.
Shiba Inu Breakout – Will it Kickstart Reversal?
The daily timeframe analysis gives a bullish reading. The SHIB price had fallen inside a descending parallel channel since August 14.
These channels usually involve corrective actions, suggesting that the altcoin will experience a breakout soon.
As SHIB trades within this channel, its price has touched both the support (green) and resistance (red) trendlines. After five unsuccessful attempts at a breakout, SHIB finally moved above the trendline on October 22.
Combined with the RSI increasing above 50, this is a sign that the Shiba Inu breakout is legitimate and can lead to a further increase.
If the upward movement continues, the Shiba Inu price can increase by 30% and reach the next resistance at $0.0000095. The long-term descending resistance trendline and the 0.618 Fib retracement resistance level create the resistance.
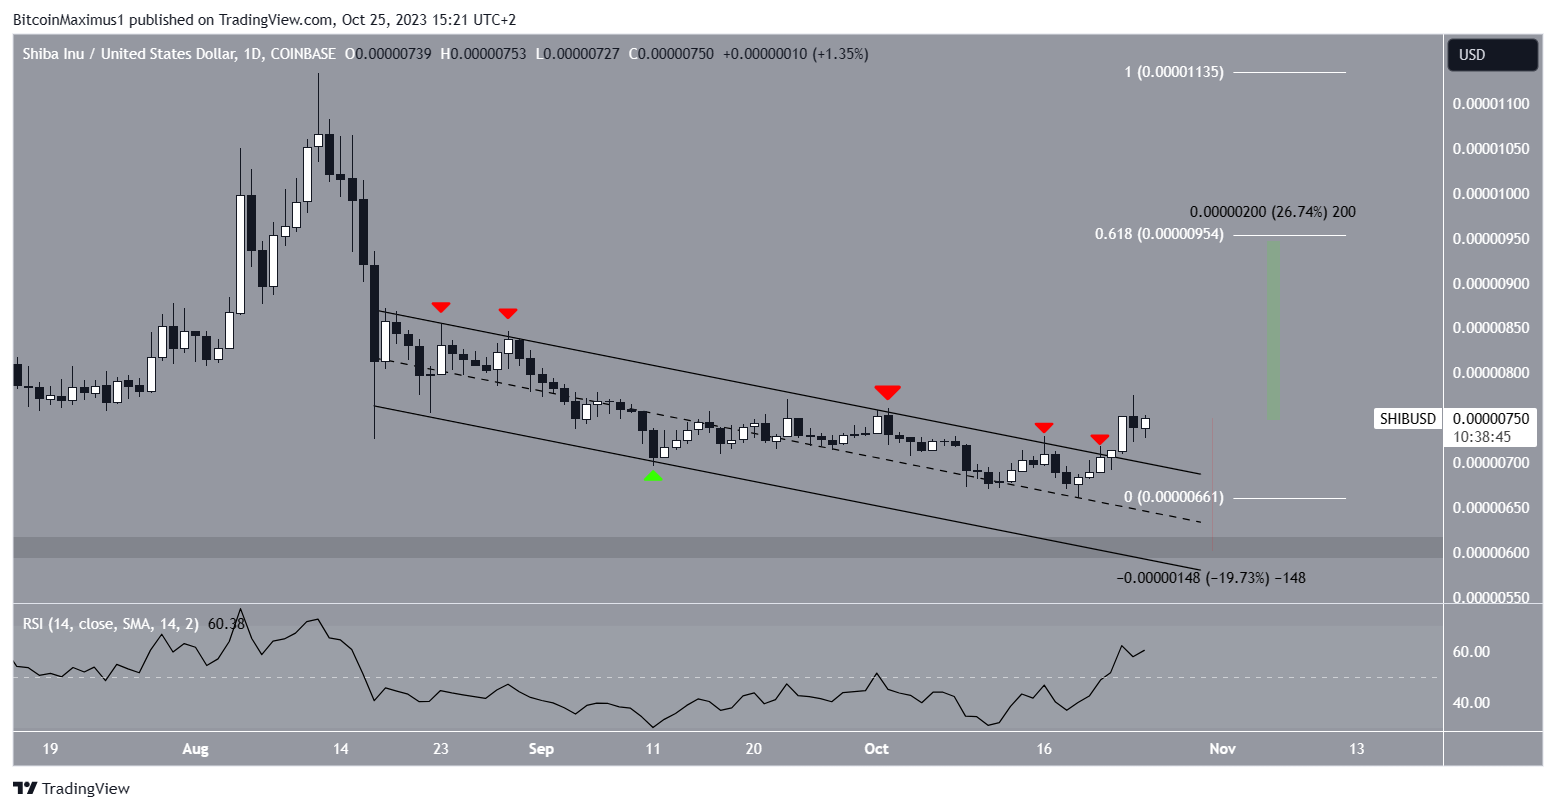
Despite this bullish SHIB price prediction, falling below the channel’s resistance trendline will invalidate the breakout. A 16% drop to the $0.0000060 area will be expected in that case.
Check Out the 9 Best AI Crypto Trading Bots to Maximize Your Profits
For BeInCrypto‘s latest crypto market analysis, click here.



