
On May 30, the Ripple price (XRP) reached a high of $0.474. A rapid decrease ensued and the price reached a low of $0.40 the next day.
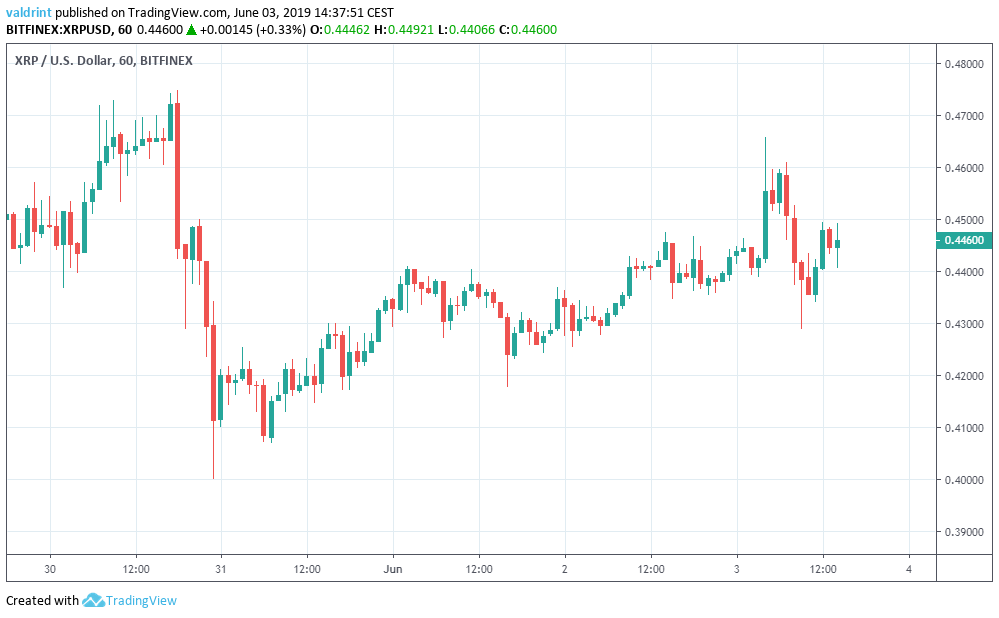
Since then, the price has been gradually increasing without experiencing significant fluctuations.
Where will it go next? Let’s find out.
Ripple price (XRP): Trends and Highlights for June 3
- The Ripple price reached a high on May 30.
- It has been trading inside an ascending channel.
- There is bearish divergence developing in the RSI and the MACD.
- The price has made a possible double top pattern.
- Volume has been higher on bearish candles.
- There is support near $0.41.
XRP in an Ascending Channel
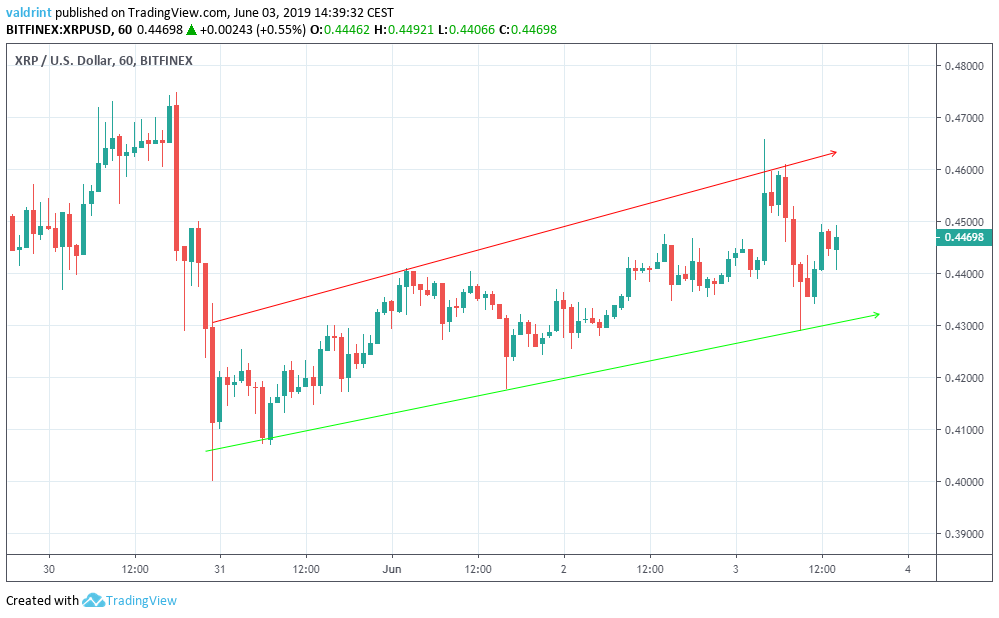
At the time of writing, the price is trading in the middle of the channel.
Where will it go next? Let’s take a look at some technical indicators and try to answer.
Bearish Divergence
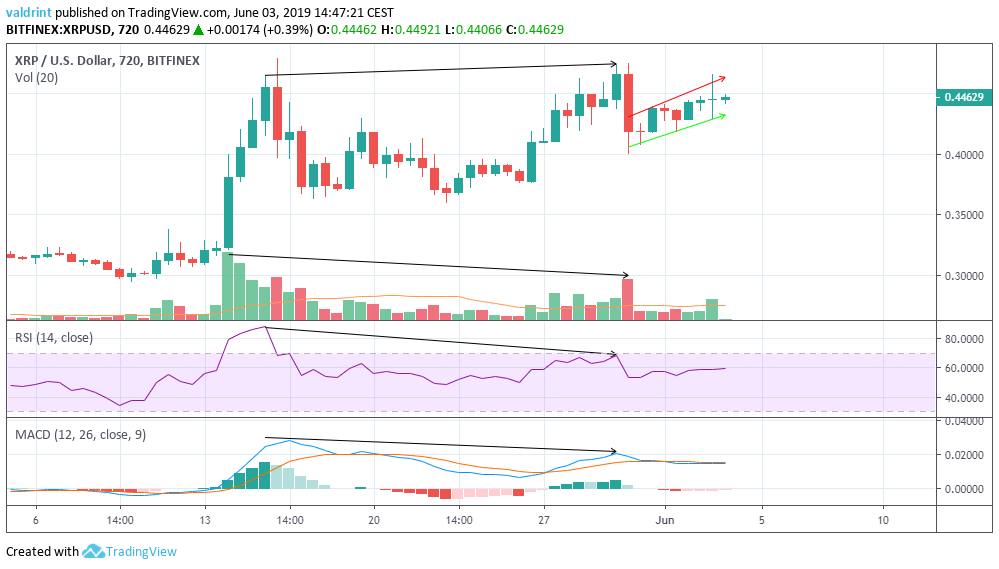
Both the RSI and the MACD reached the first high on May 15. However, they have both generated lower values since. This is known as bearish divergence and often precedes drops in price.
Furthermore, it seems as if the Ripple price has created a double top, which is a bearish reversal pattern.
Additionally, volume has been steadily decreasing since the upward move on May 15. This held true until the bearish engulfing candle on May 31, which broke the trend decreasing volume. However, it still fell short of the bullish candle prior to the upward move of May 15.
This occurrence further supports the double top pattern and bearish divergence signs, which point to a reversal. The use of these indicators makes it likely that the price will decrease. In the short-term, a breakdown from the ascending channel is likely.
Reversal Areas
One support area is traced for Ripple (XRP) below. If the price breaks down from the channel, it is likely to provide a reversal.
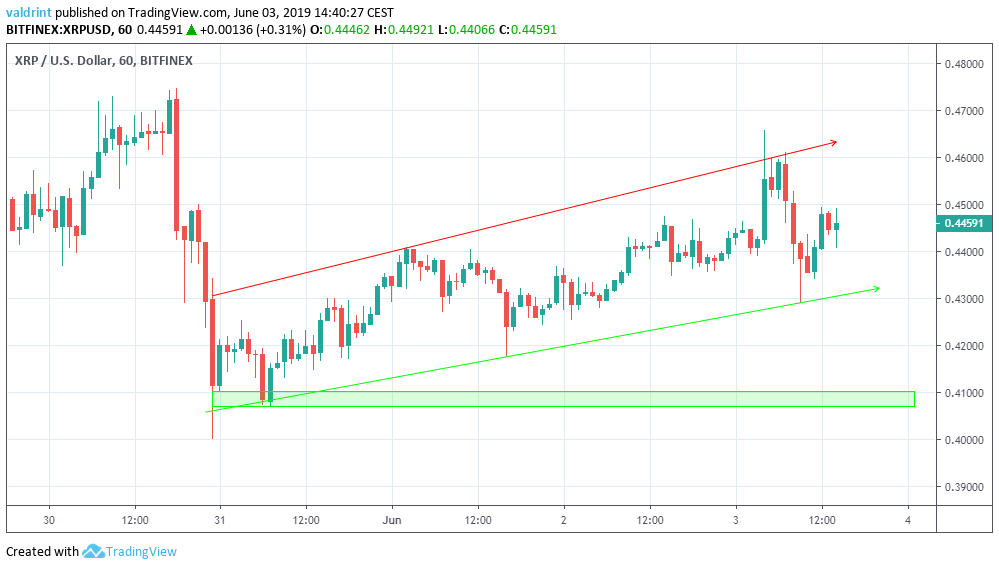
The closest support area is found near $0.41. We believe it is likely that the price will reach this area. This is a relatively short-term target.
Summary
To conclude, the price of XRP has created a double top pattern in long-term timeframes. This bearish reversal pattern, combined with the readings from technical indicators makes it likely that the price will decrease. We believe a break down from the short-term ascending channel is likely to occur.
What do you think will happen to the Ripple price (XRP)? Let us know in the comments below.
Disclaimer: This article is not trading advice and should not be construed as such. Always consult a trained financial professional before investing in cryptocurrencies, as the market is particularly volatile.
