
Quant (QNT) has already broken out from a short-term descending resistance line but is still trading underneath a long-term line.
QUANT Crypto Price Prediction: QNT Generates Bullish Divergence | Coin Of The Week – YouTube
QNT has been falling underneath a descending resistance line since reaching an all-time high price of $429 on Sept. 11, 2021. The downward movement led to a low of $48.81 on May 12, 2022.
However, the price bounced afterward and validated the $65 horizontal area as support. It has not reached a close below this level since July 2021.
Despite the bounce, the price has yet to decisively break out from the descending resistance line. Until it does, the trend cannot be considered bullish. If it does break out, the next closest resistance would be at $145.
Additionally, the weekly RSI is below 50, another sign of a bearish trend.

QNT enthusiast @its_cashflow tweeted a chart of QNT, which shows a potential fractal that would eventually take the price towards a new all-time high.

Since the price has yet to break out from the descending resistance line, there are no signs that suggest that this movement will transpire.
Ongoing bounce
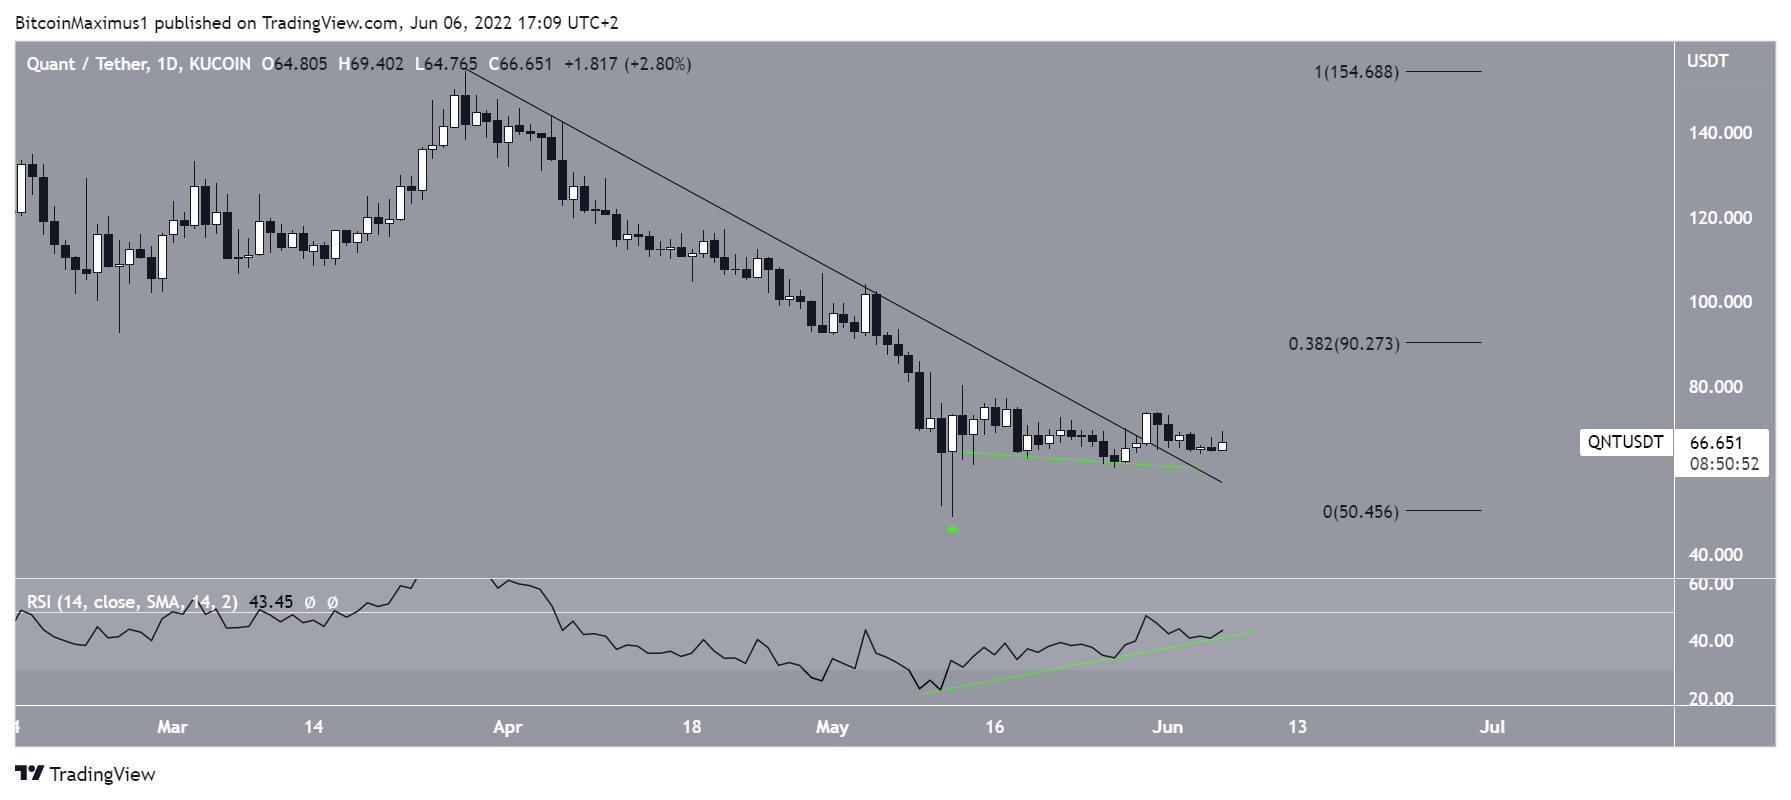
The daily chart provides a more bullish outlook for several reasons. Firstly, it shows the creation of a bullish hammer candlestick (green icon) on May 12. The fact that the candlestick is created inside a long-term support area further increases its significance.
Secondly, the daily RSI has generated significant bullish divergence (green line) and the trendline of the divergence is still intact. The indicator is also close to moving above 50, in what would be considered a bullish sign.
If the upward movement continues, the closest resistance area would be at $90.20. This is the 0.382 Fib retracement resistance level when measuring the most recent decrease.
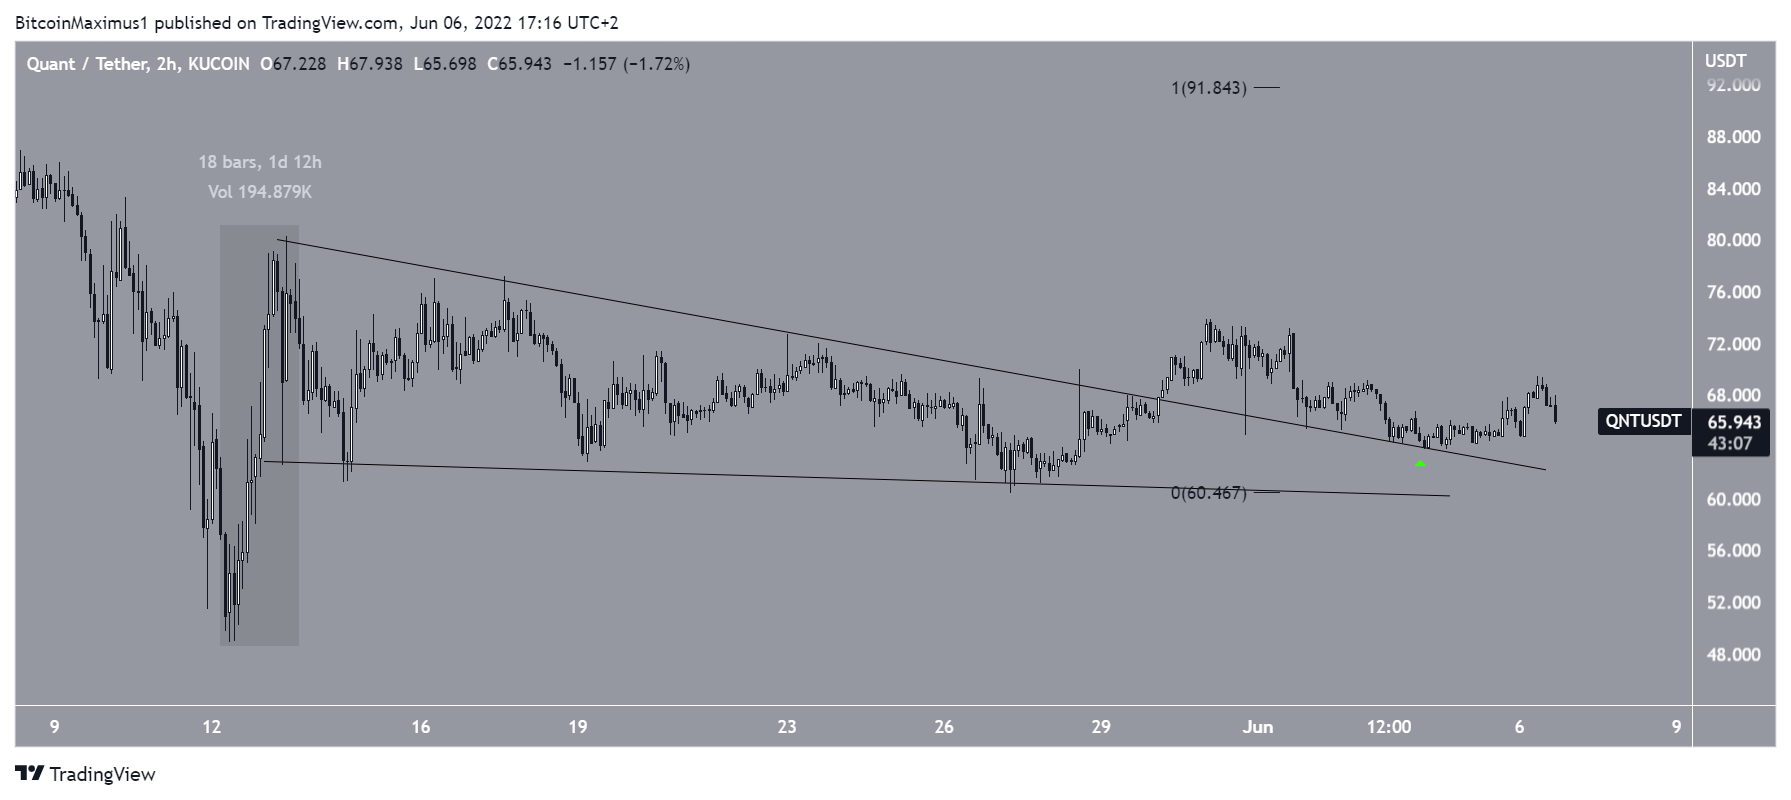
Short-term QNT movement
Finally, the two-hour chart shows that QNT has already broken out from a descending wedge and validated it as support afterward (green icon).
If both portions of the increase have the same magnitude, this would lead to a QNT value of $92, also coinciding with the previously outlined resistance area.
For Be[in]Crypto’s latest bitcoin (BTC) analysis, click here
Disclaimer
In line with the Trust Project guidelines, this price analysis article is for informational purposes only and should not be considered financial or investment advice. BeInCrypto is committed to accurate, unbiased reporting, but market conditions are subject to change without notice. Always conduct your own research and consult with a professional before making any financial decisions. Please note that our Terms and Conditions, Privacy Policy, and Disclaimers have been updated.
