


The Polygon (MATIC) price failed to break out from a crucial horizontal resistance area and broke down from a short-term corrective pattern afterwards.
This is a decisive sign that the trend is bearish and the breakdown from the pattern will confirm that the trend is bearish, and the downward movement will likely lead to a new yearly low.
Polygon Price Falls Sharply After Rejection From Resistance
The weekly timeframe analysis for MATIC indicates a pessimistic outlook primarily due to its recent rejection from the horizontal $0.80 resistance zone. This area had acted as a support level since July 2022, but in the last two weeks, it has become a strong resistance for the price.
Your financial future is a click away. Predict crypto prices now:
The rejection is evident from the formation of a long upper wick (red icon), indicating increased selling pressure. This suggests that despite buyers’ efforts to push the price higher, sellers took control and caused MATIC to drop below the resistance area.
The decrease occurred around the same time that digital banking giant Revolut delisted the MATIC token.
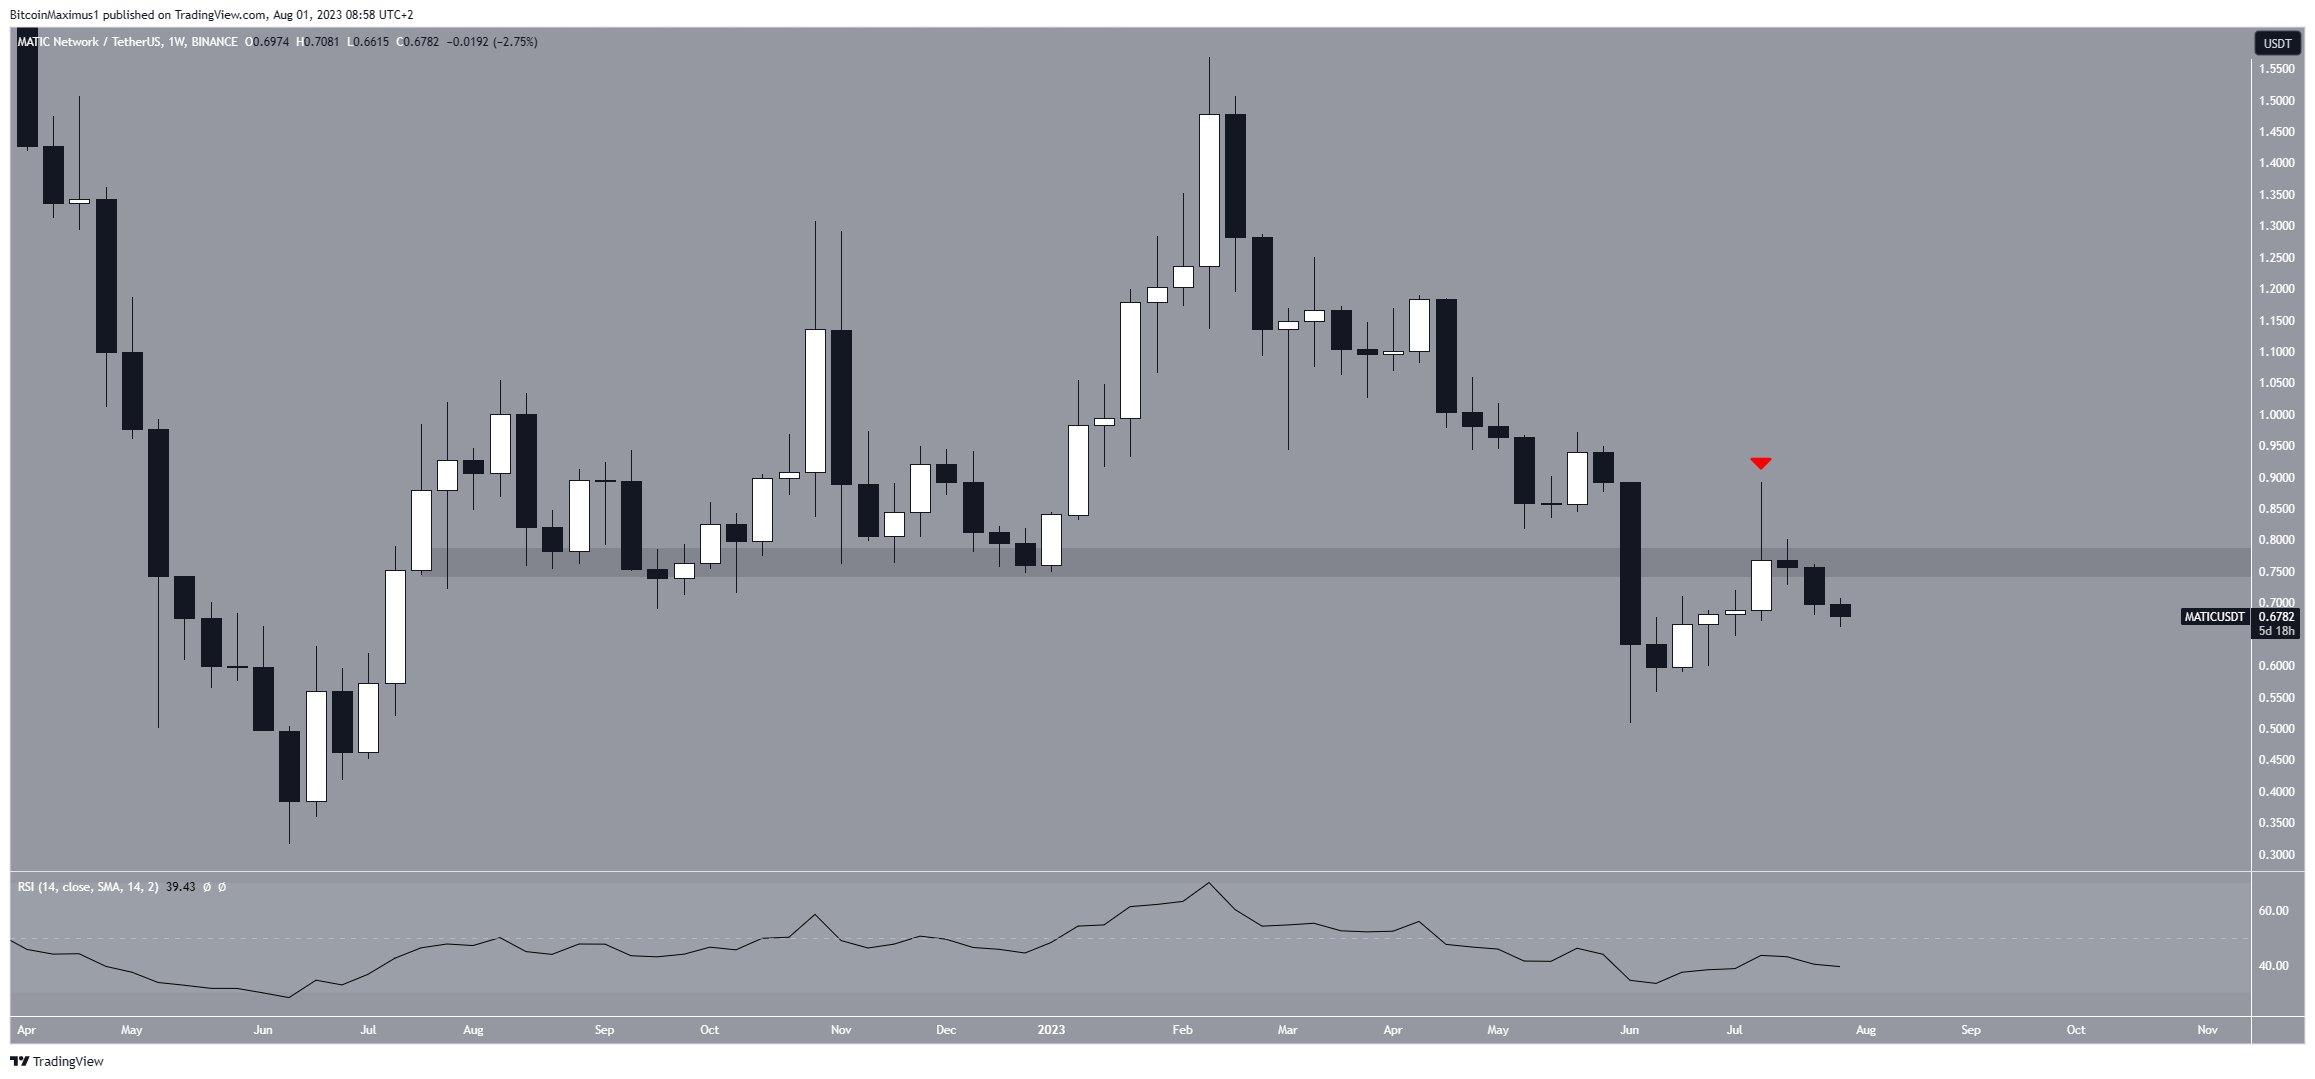
Moreover, the weekly Relative Strength Index (RSI) indicates a bearish sentiment. RSI is a momentum indicator used by traders to assess whether a market is overbought or oversold, aiding in their decisions to buy or sell an asset.
When the RSI reading is above 50 and showing an upward trend, it favors the bulls, indicating a positive market sentiment. Conversely, when the reading falls below 50, it suggests a bearish sentiment, with the advantage tilting towards the sellers. In this case, the RSI is currently below 50 and decreasing, signaling a bearish trend.
Read More: Best Crypto Sign-Up Bonuses in 2023
MATIC Price Prediction: Where to After Breakdown?
The daily analysis for MATIC also provides a bearish reading. The main reason for this is the breakdown of an ascending parallel channel that had been in place since June 10. The channel is considered a corrective pattern. Therefore, the breakdown from it suggests that the upward correction is complete, and the bearish trend will now resume.
Moreover, the daily RSI provides a bearish reading. The indicator fell below 50 at the same time as the price (red icon), legitimizing the breakdown and indicating that the trend is bearish.
The MATIC price has fallen by 7% since the breakdown. If the decrease continues, the next closest support will be at $0.60. This would amount to a decrease of another 12%.
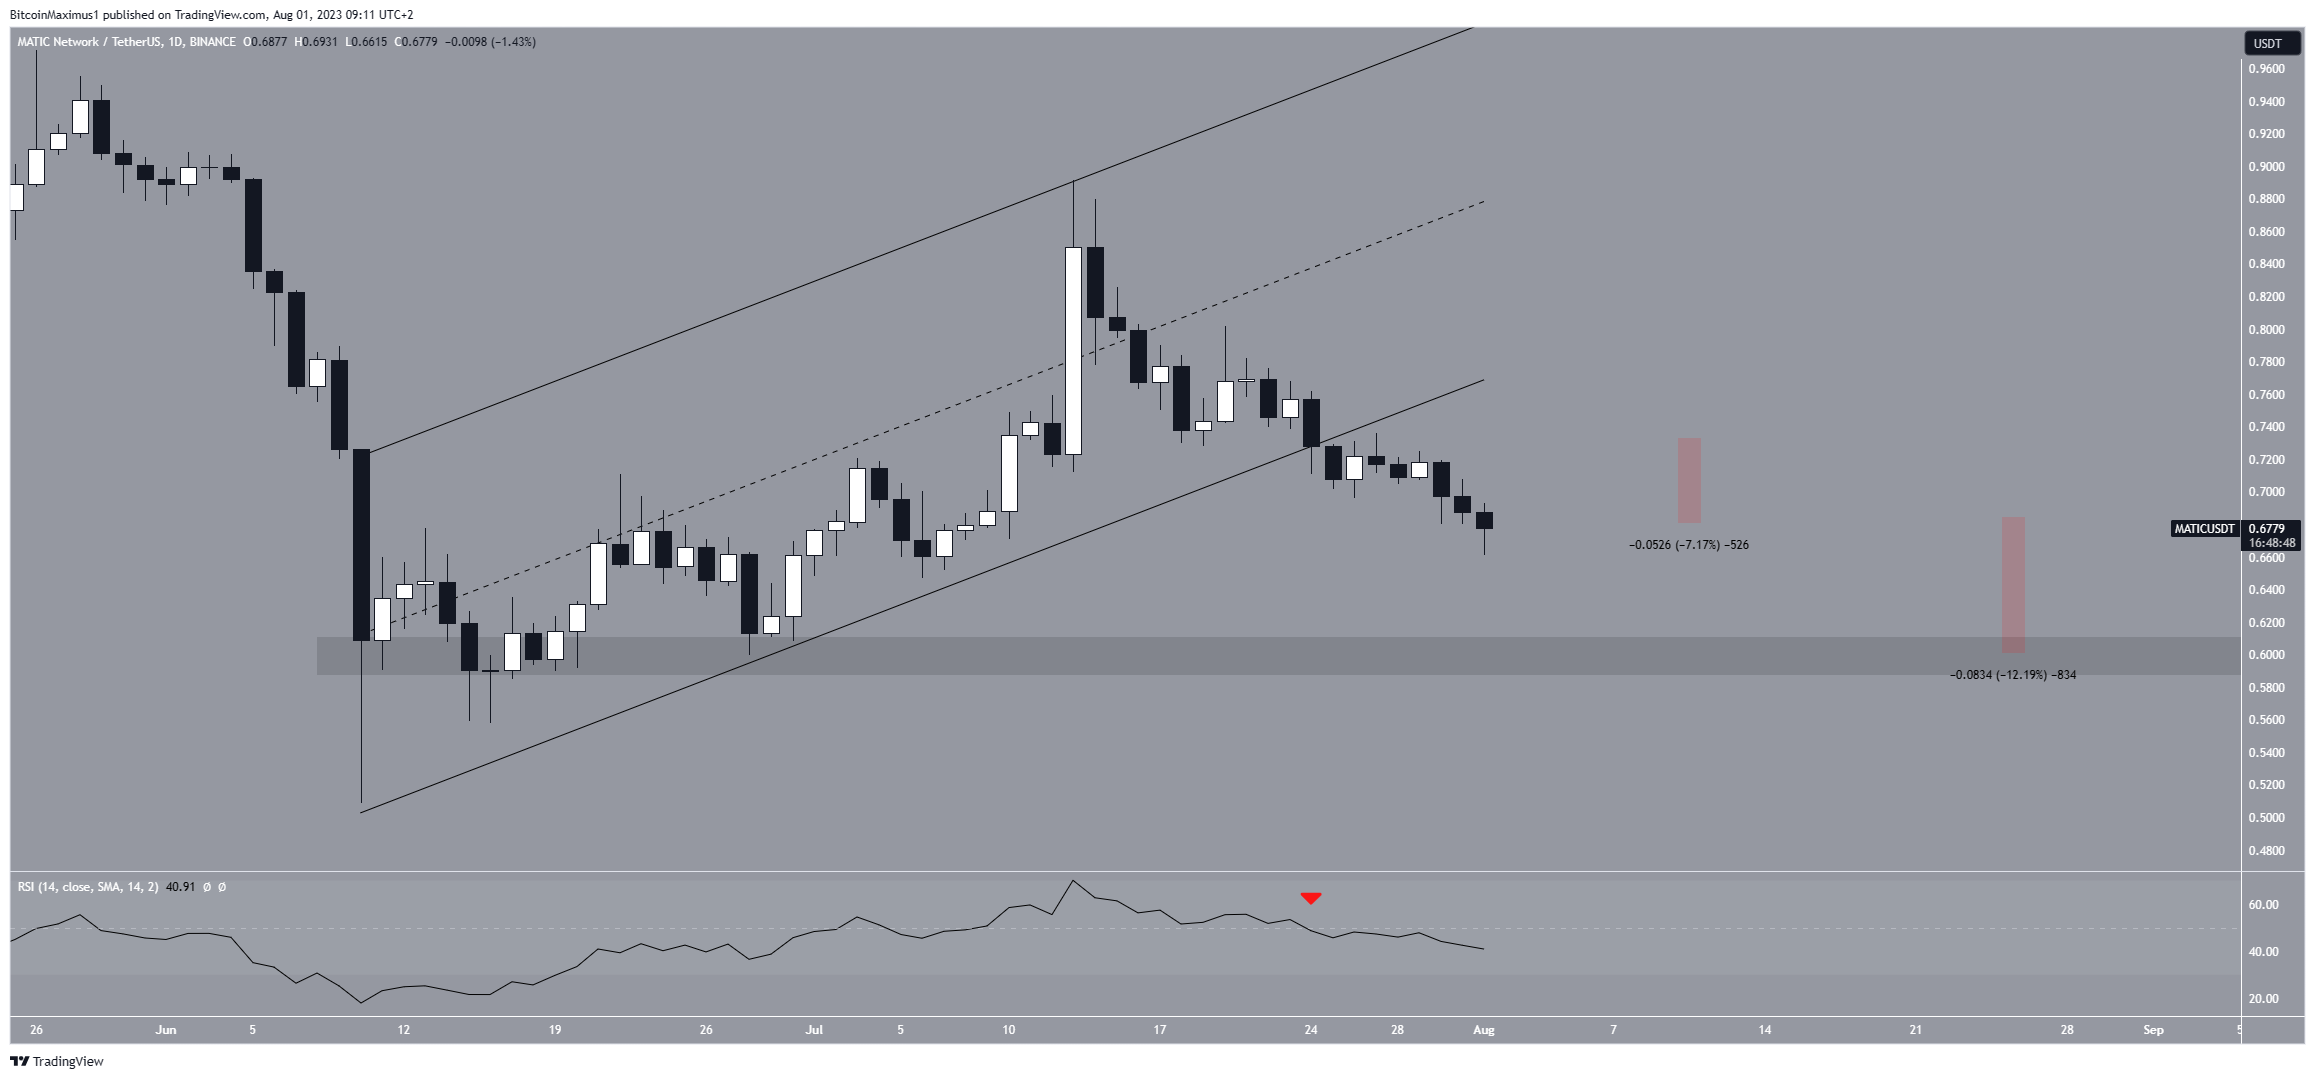
Despite this bearish MATIC price prediction, the price can increase to the channel’s support line if it regains its footing. The line is currently at $0.80. However, there are no imminent signs that suggest this will occur.


