


The Polygon (MATIC) price could initiate a relief rally before another final drop completes the entire correction.
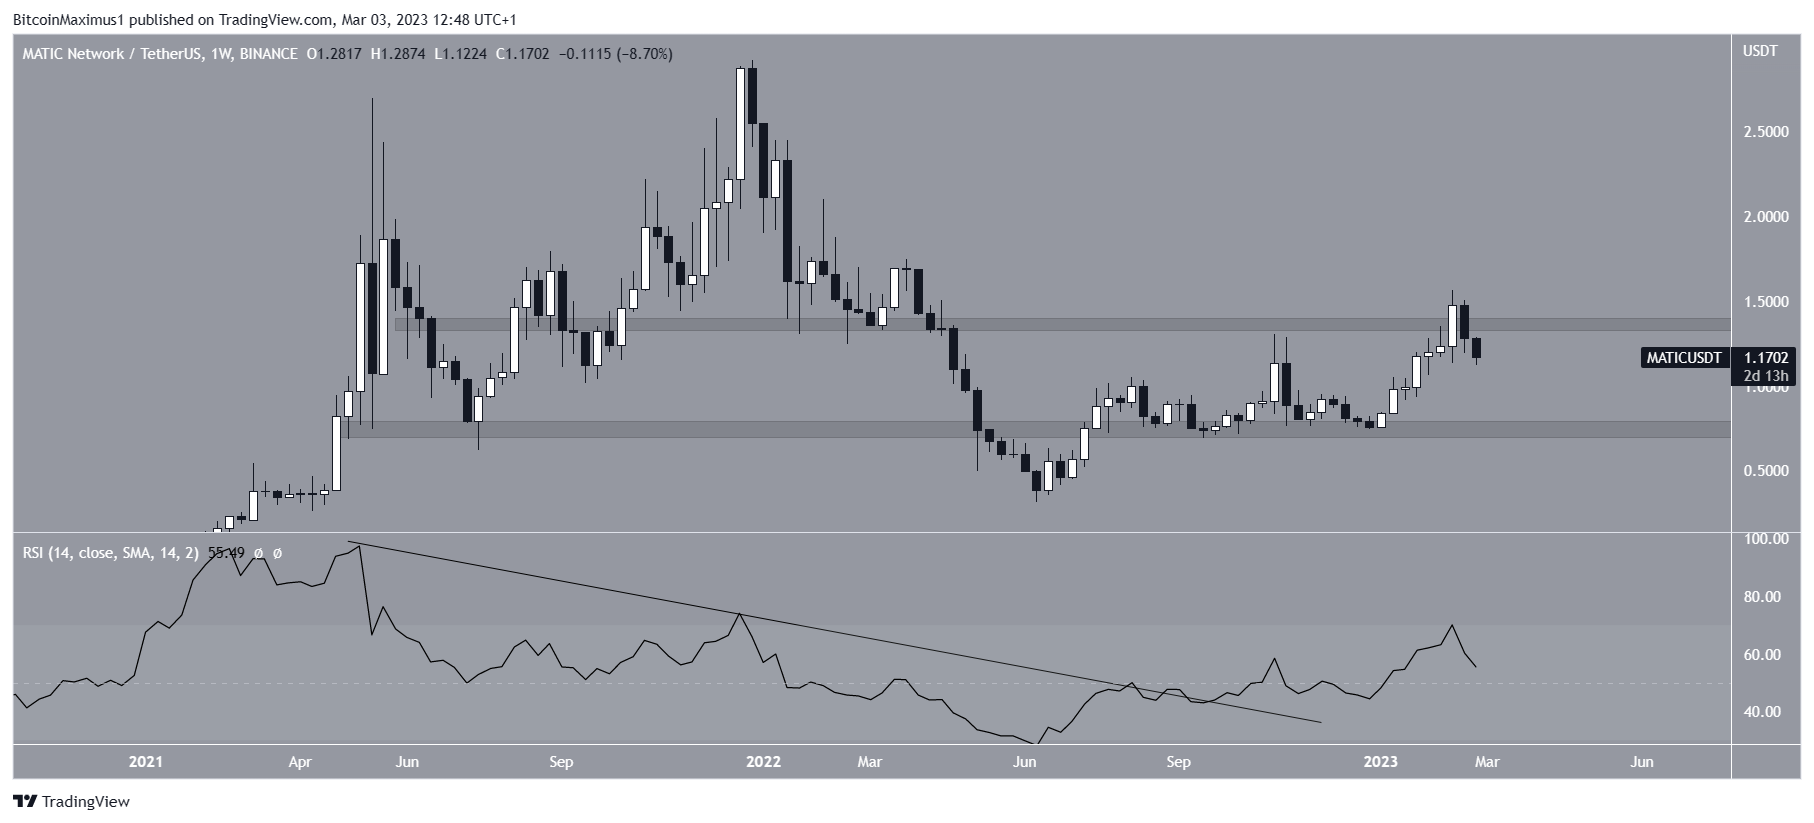
The MATIC token is the native token of the Polygon network, a scaling solution for the Ethereum blockchain. The MATIC price has increased since bouncing at the $0.77 horizontal support area in the beginning of the year. This led to a high of $1.57 on Feb. 17.
While it initially seemed that the MATIC price reclaimed the $1.35 resistance area, the movement turned out to be a deviation (red circle). Shortly afterward, the price fell below the area.
The weekly RSI is bullish since it has broken out from a descending resistance line and is above 50. However, due to the bearish price action, a fall to the $0.77 horizontal support area is the most likely scenario.
On the other hand, if the MATIC price closes above $1.35, this could lead to an increase toward $2.
Polygon (MATIC) Price Prediction for March: Relief Rally Before Another Drop
The technical analysis from the daily time frame suggests that the correction is not yet complete. However, a relief rally is expected to follow before another final drop.
There are three main reasons for this:
Firstly, the price has completed a five-wave upward movement (black). What follows afterward is a corrective A-B-C structure. Secondly, the MATIC price broke down from an ascending support line. Thirdly, the daily RSI is below 50, a sign of a bearish trend.
Therefore, the most likely Polygon price prediction for March is the completion of the A-B-C correction near the 0.618 Fib retracement support level at $1.06.
If so, the price is currently in the B wave of an A-B-C corrective structure. After an initial relief rally, which completes the B wave, a final drop toward $1.06 is likely.
A drop below $0.75 would invalidate the long-term bullish price forecast, suggesting that the future price will head toward $0.50.
On the other hand, an increase above the yearly high of $1.54 would mean that the correction is done and an increase toward $2 is likely.
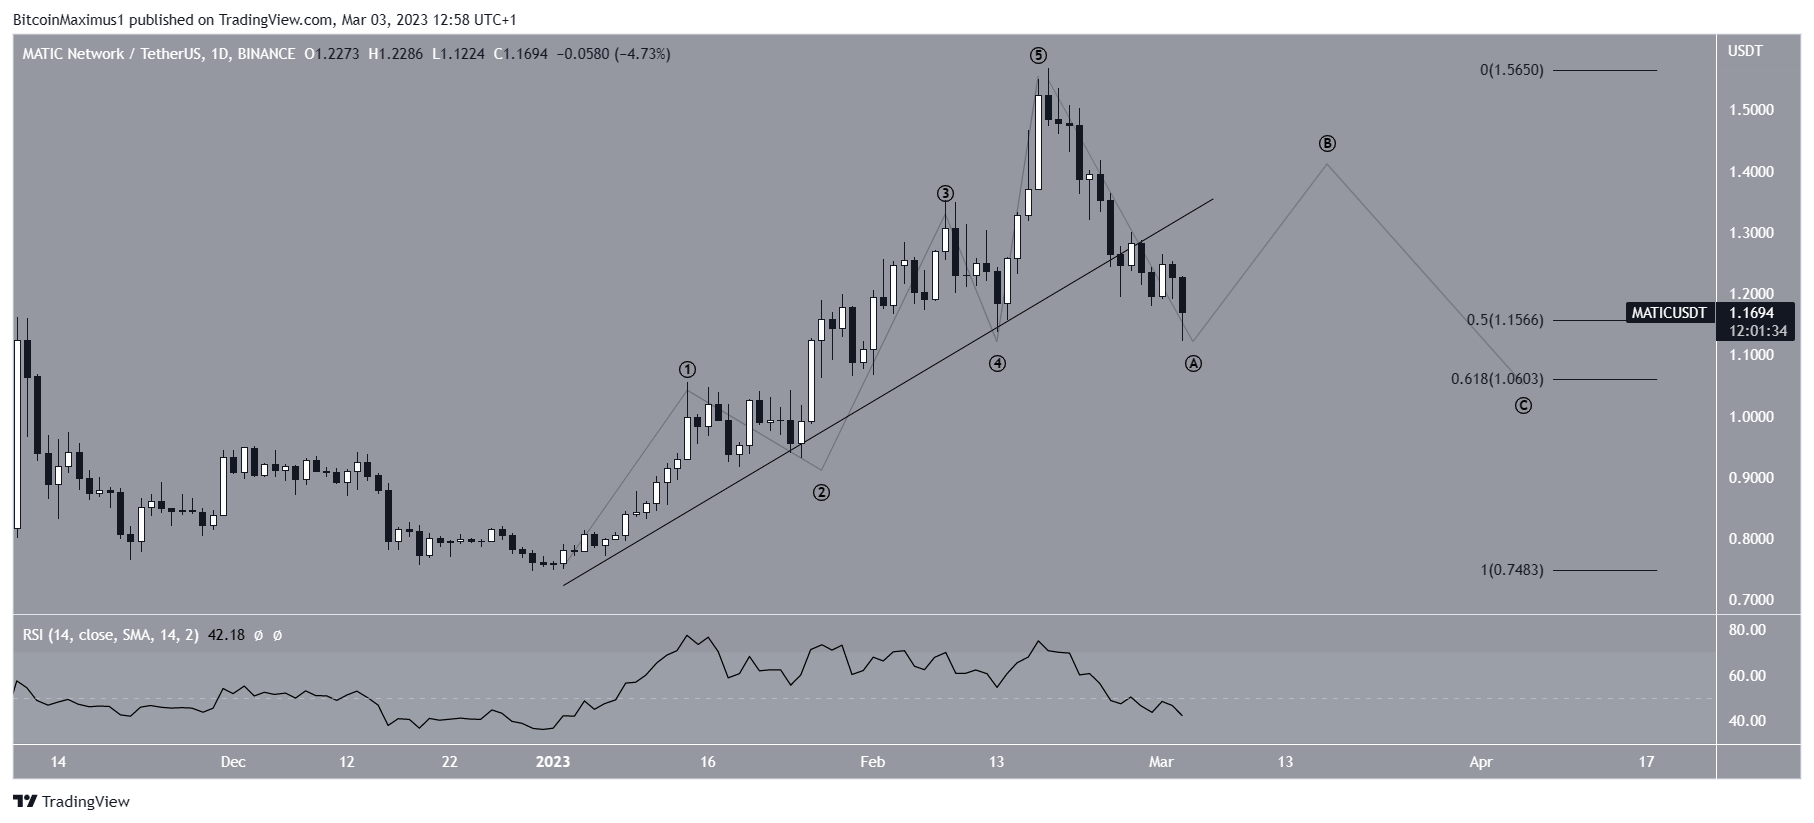
To conclude, the most likely Polygon price prediction for March is a relief rally toward $1.40 before a fall to $1.06. An increase above $1.54 would mean that the correction is complete, while a drop below $0.75 would mean that MATIC has begun a new long-term upward movement and could fall to $0.50.
For BeInCrypto’s latest crypto market analysis, click here.



