


The Polygon (MATIC) price is showing long-term bullish signs, but the current increase could be coming to an end.
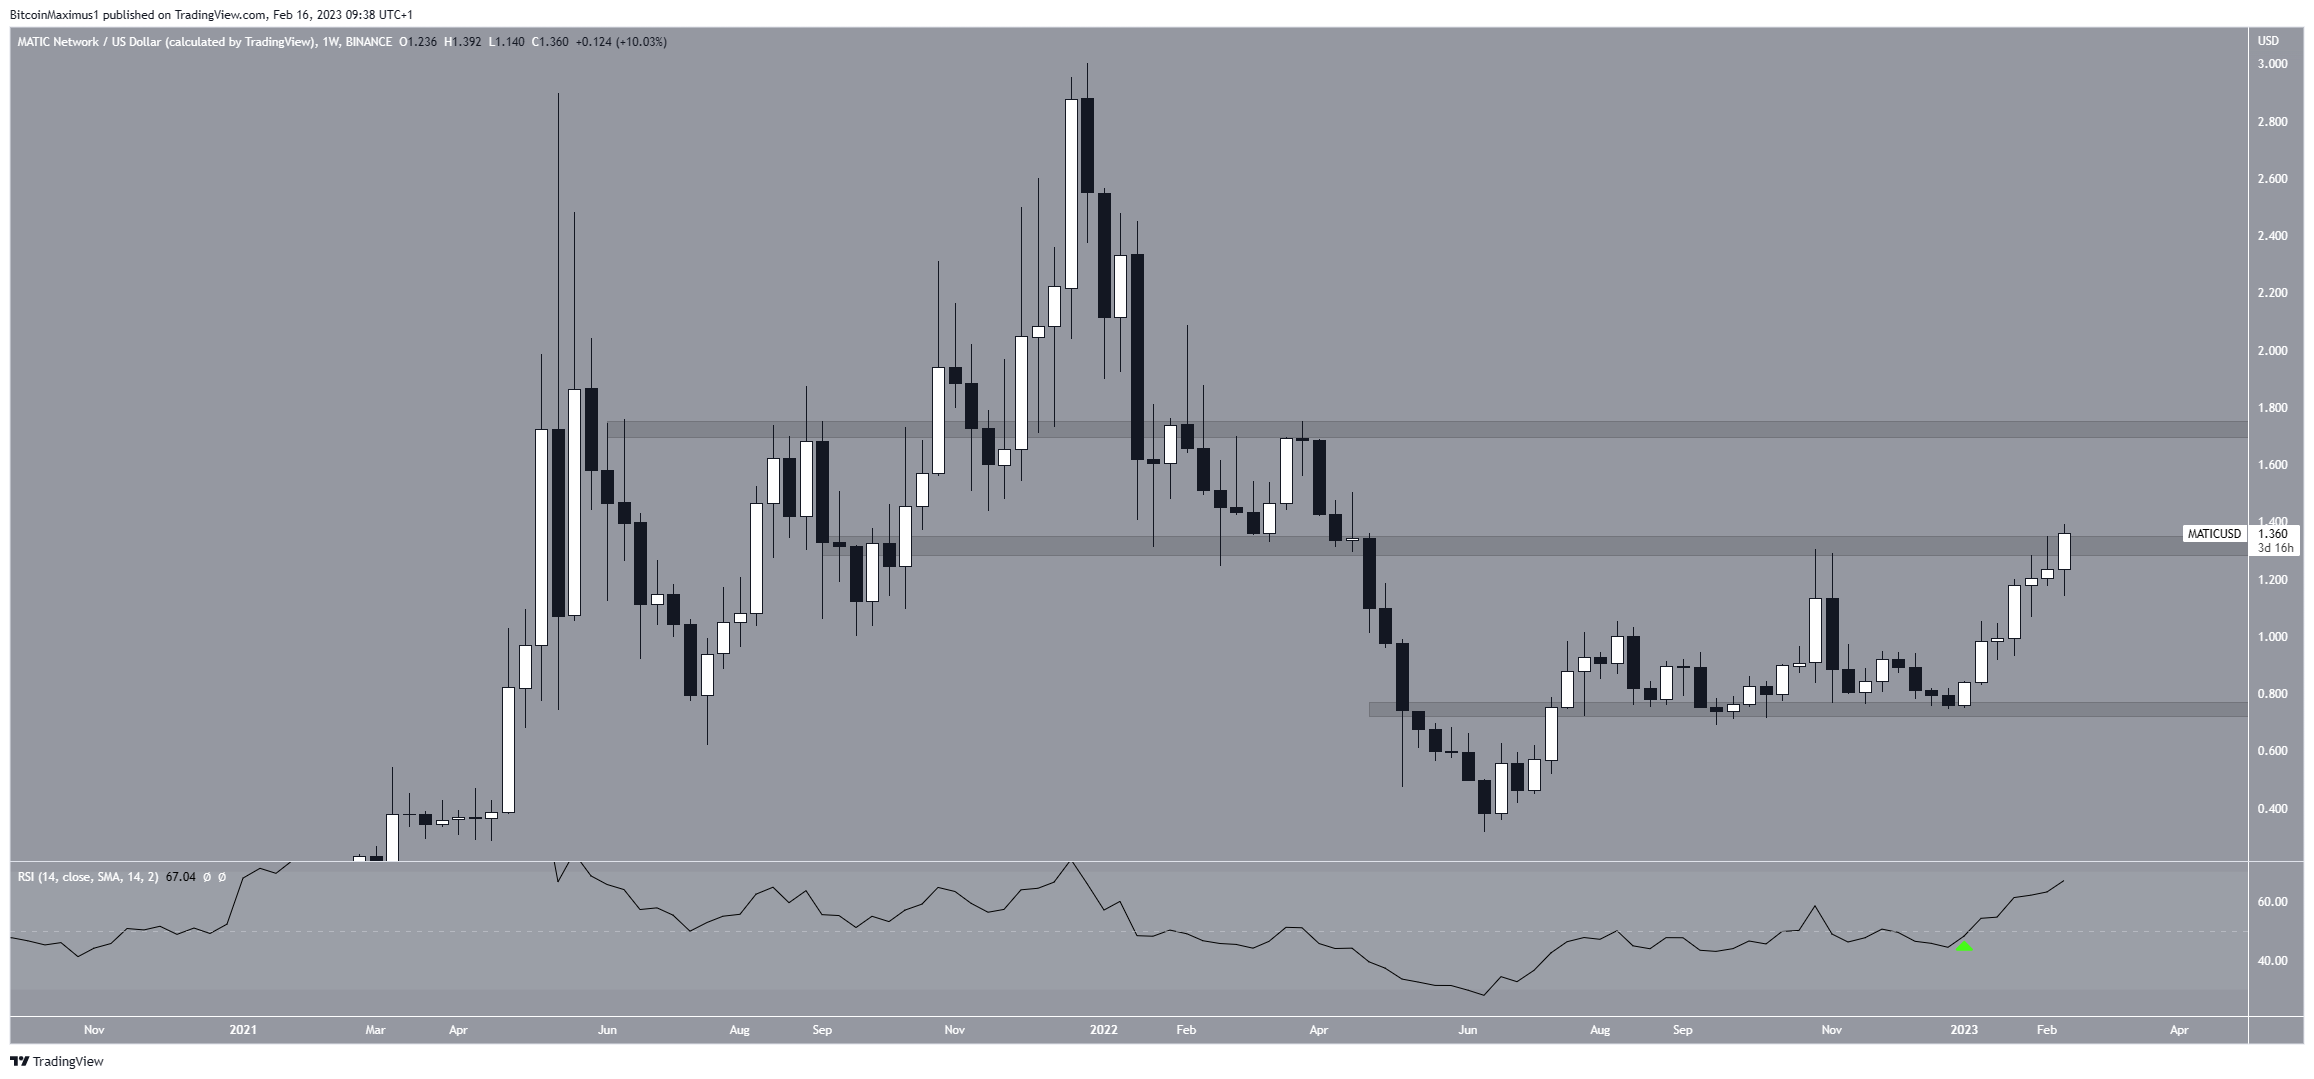
The MATIC token is the native token of the Polygon network, a scaling solution for the Ethereum blockchain. The MATIC price has increased since the beginning of the year when it bounced at the $0.77 horizontal support area.
Currently, MATIC price is attempting to break out from the $1.35 resistance area. This is a crucial area since it acted as support for most of 2022. Therefore, if the price breaks out above this area, it can increase to the next resistance at $1.73.
The weekly RSI has moved above 50 (green icon), which is a strong bullish sign. Therefore, it makes the possibility of a breakout likely.
However, if the digital asset fails to break out, it could fall back to the $1.77 horizontal support area.
Polygon (MATIC) Price Approaches Top of Increase
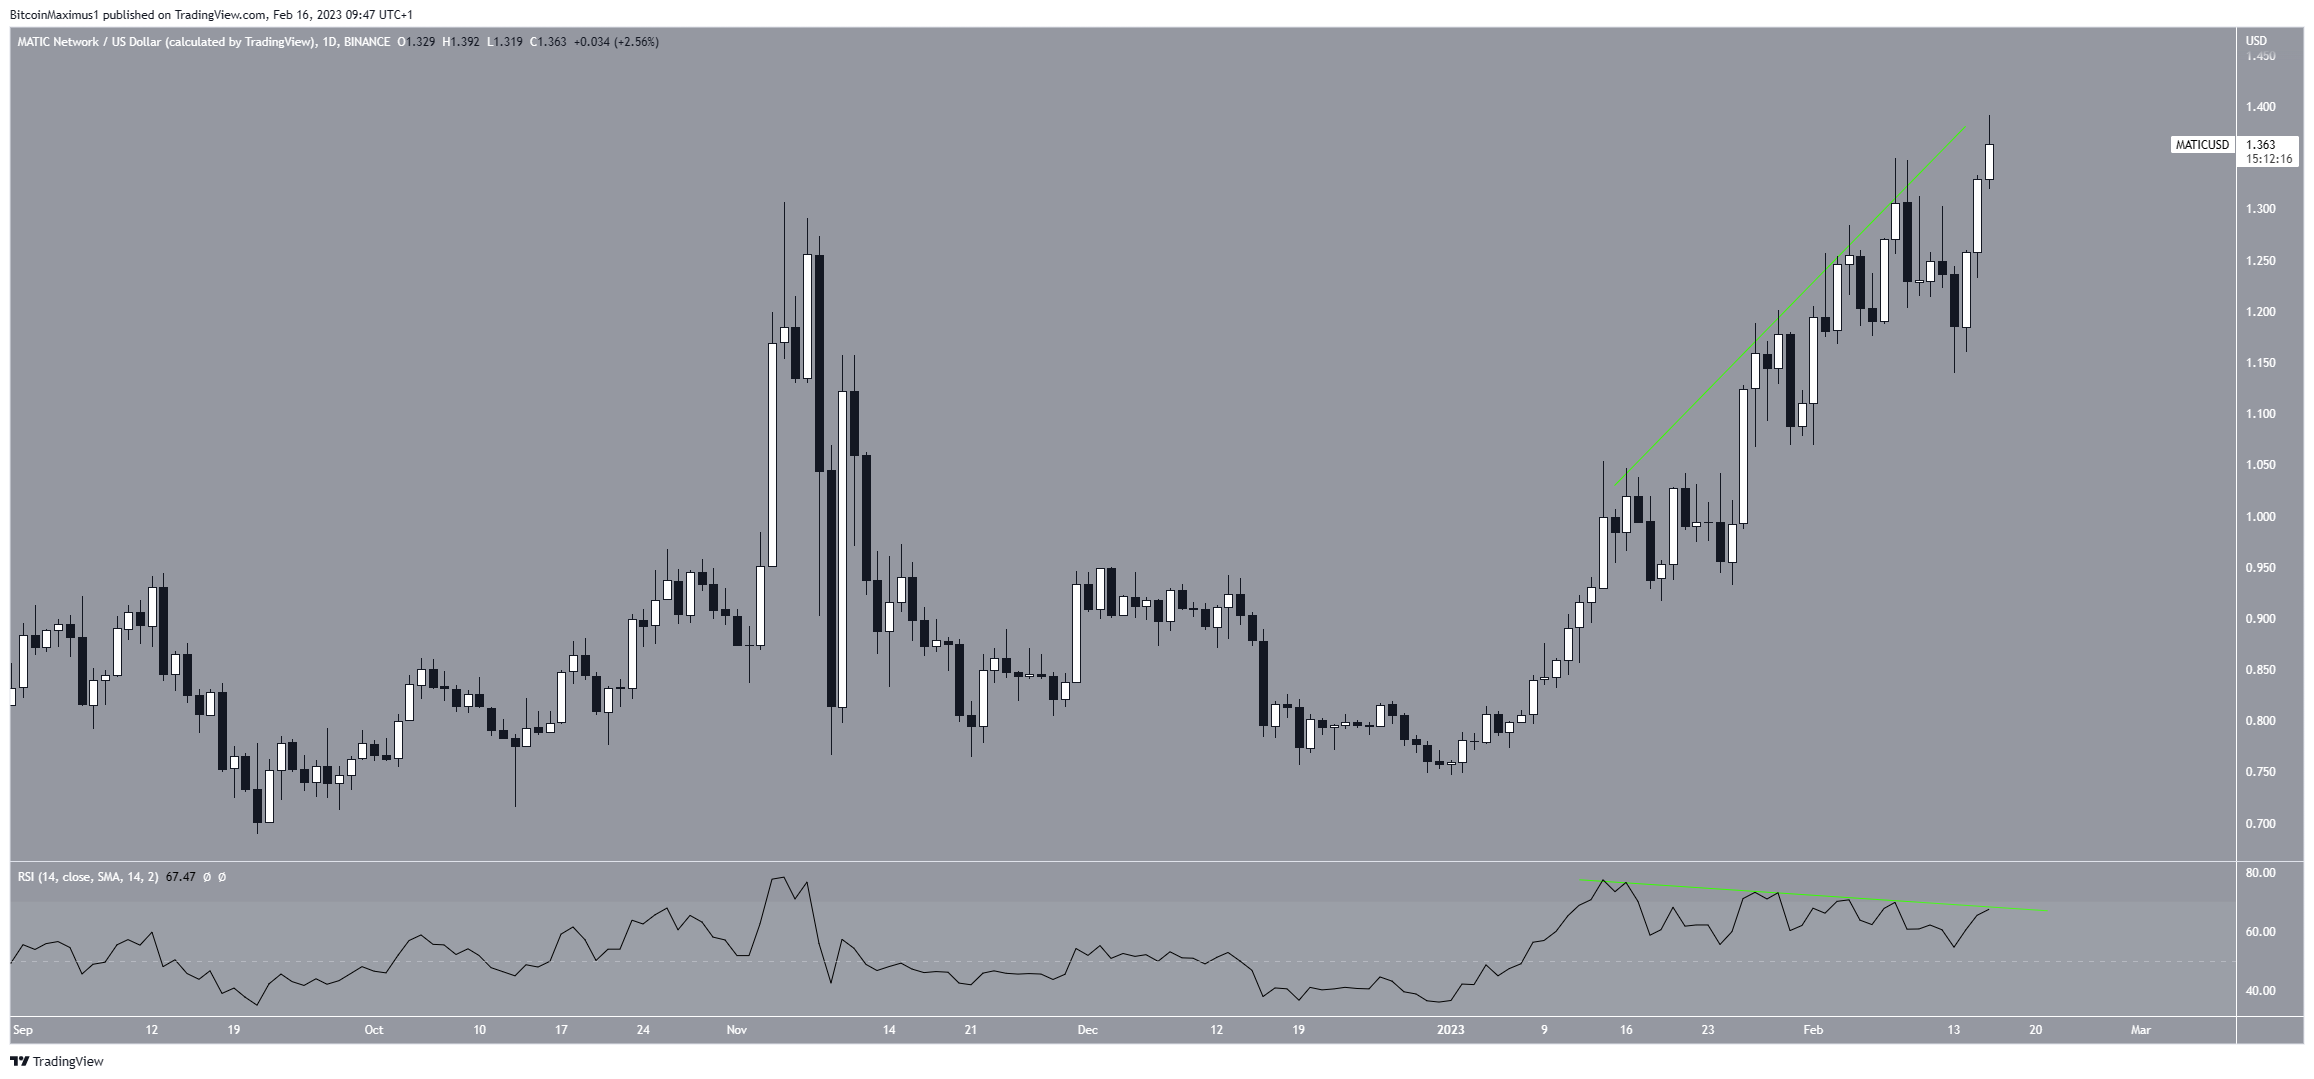
While the weekly chart is bullish, the daily one shows bearish signs. The reason for this is the massive bearish divergence that has developed in the daily RSI (green line). Such divergences often precede bearish trend reversals.
Therefore, this suggests that the price will fail to break out.
However, if the daily RSI breaks out from its trend line, it will mean that the upward movement will continue toward the next resistance at $1.77.
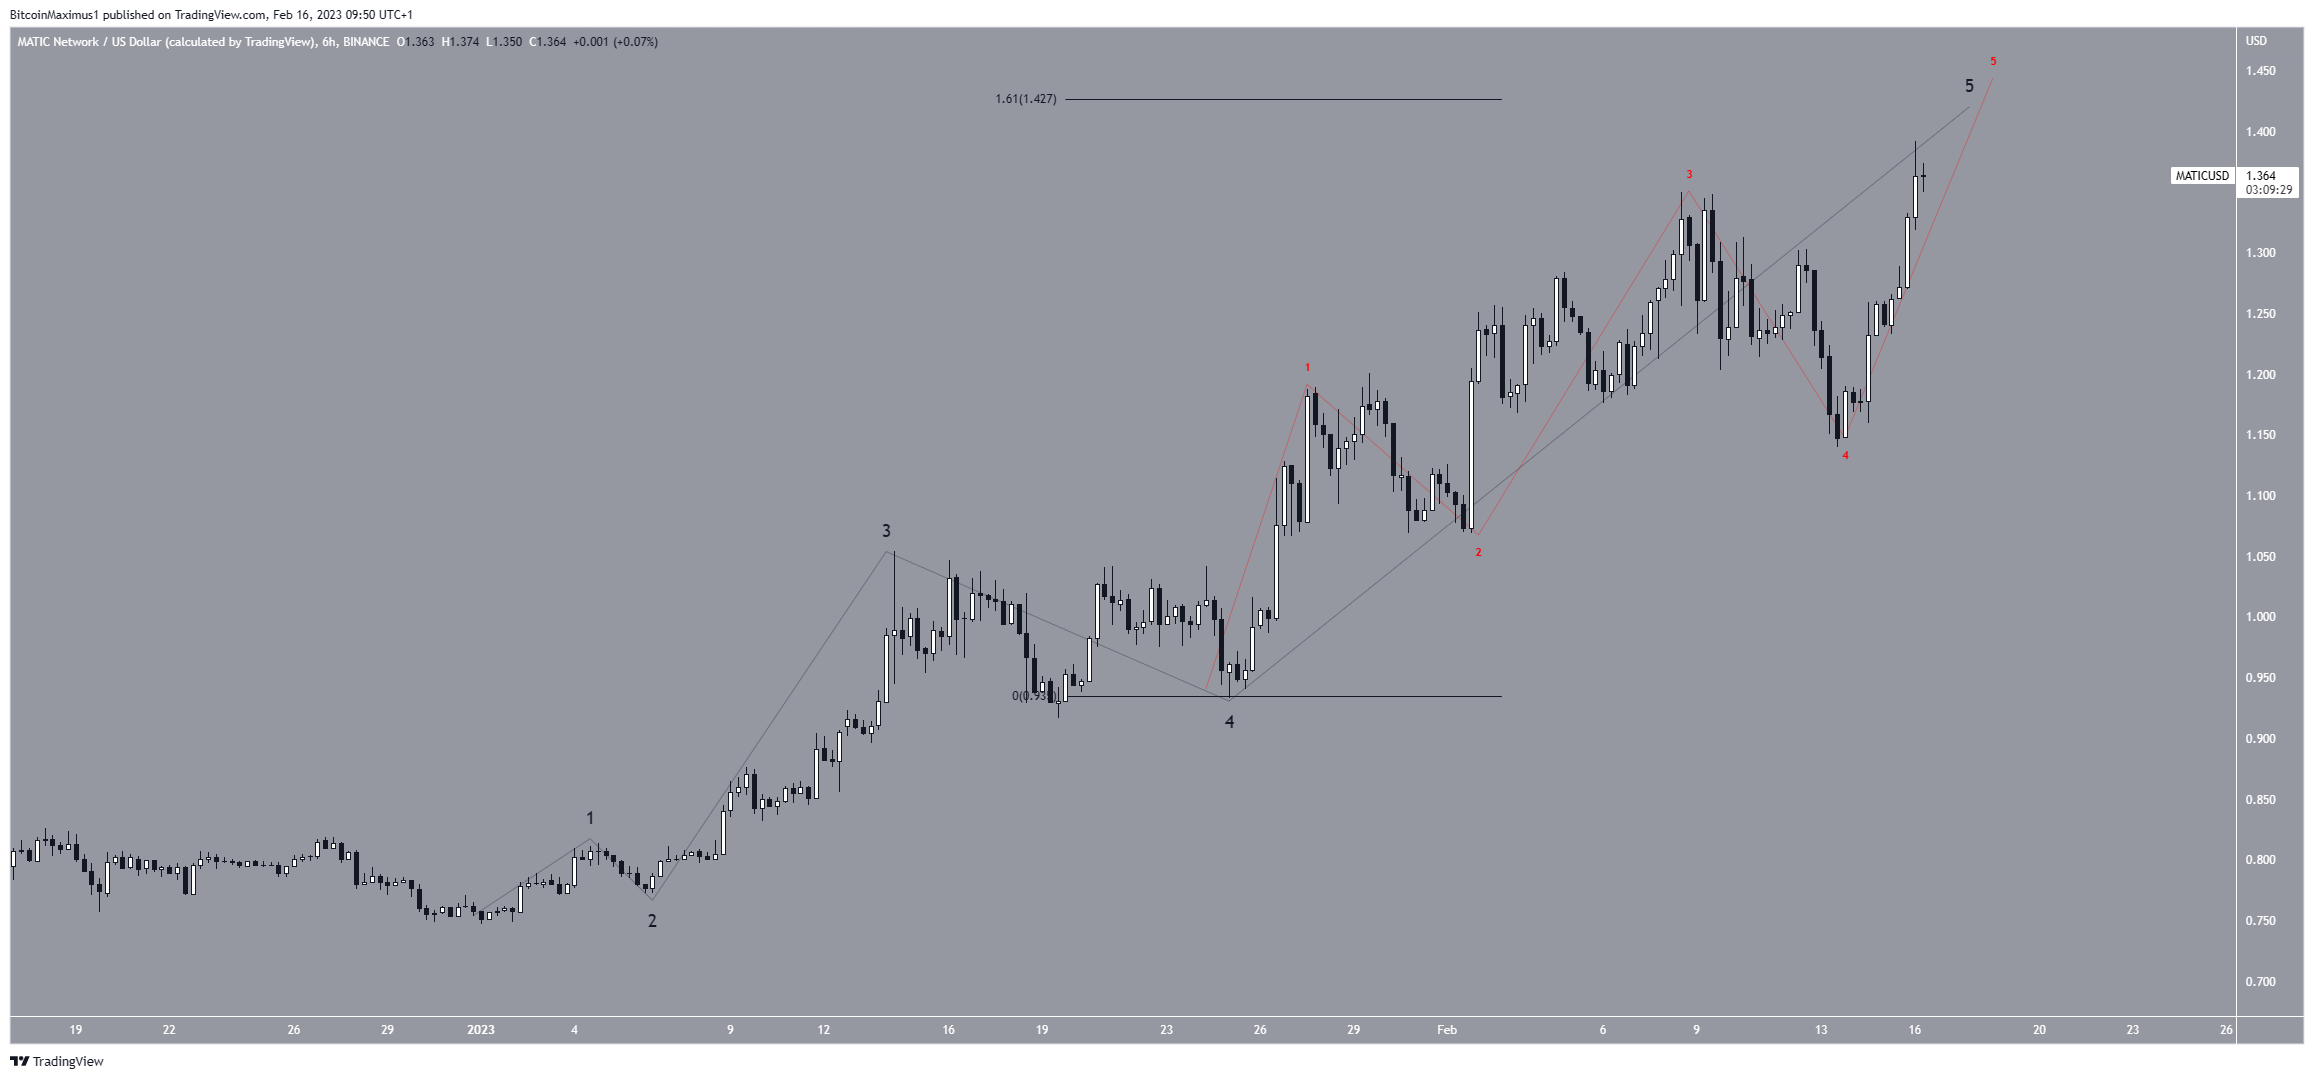
The wave count supports this possibility. It shows that the Polygon price is in an extended wave five (black). The sub-wave count is given in red. The most likely target for the movement’s top is at $1.43, created by the 1.61 length of waves one and three combined.
Afterward, a considerable correction toward at least $1 would be likely.
However, as outlined previously, a weekly close above $1.35 would be bullish and would mean that the price could increase toward $1.77.
To conclude, the most likely MATIC price forecast is an increase toward $1.42 before a long-term correction. A weekly close above $1.35 would invalidate this bearish forecast and could lead to an increase toward $1.77.
For BeInCrypto’s latest crypto market analysis, click here.


