

Polygon (MATIC) has bounced at a crucial horizontal support level at $0.74. Afterward, it broke out from a short-term descending resistance line.
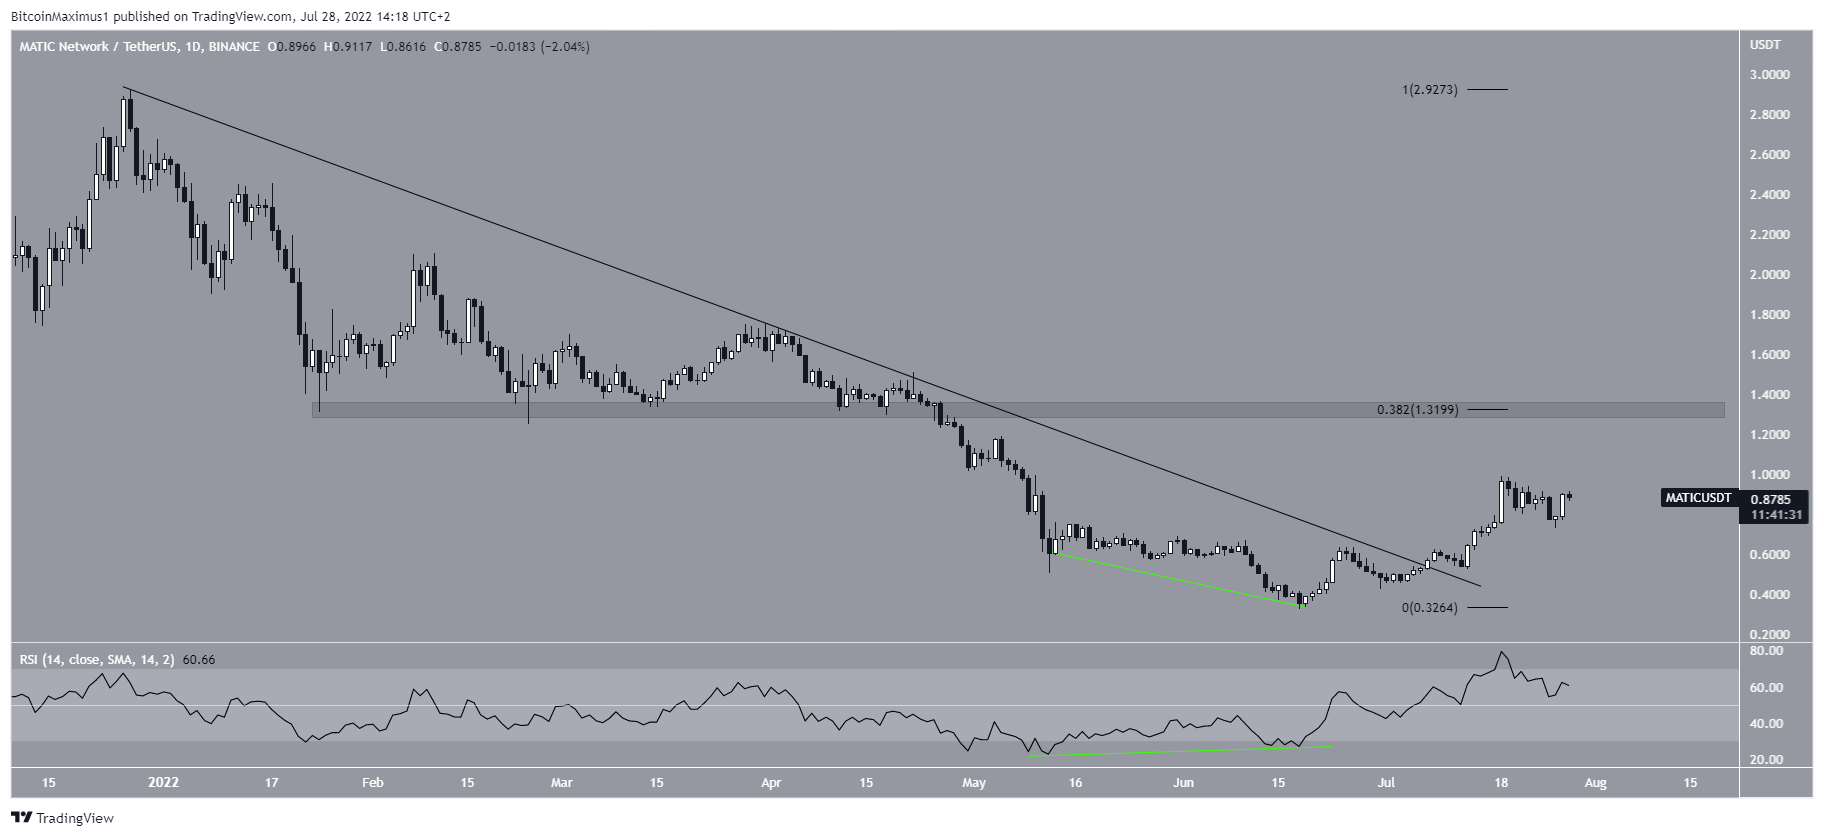
MATIC had been falling underneath a descending resistance line since reaching an all-time high price of $2.72 in Dec. The downward movement led to a low of $0.316 on June 18.
The price has been increasing since, in an upward movement that was preceded by bullish divergence in the daily RSI (green line). On July 7, it managed to break out from the descending resistance line.
Afterward, it proceeded to reach a high of $0.79. This movement also caused the daily RSI to move above 50. This is considered a sign of a bullish trend.
If the upward movement continues, the next closest resistance would be at $1.32.
Short-term movement
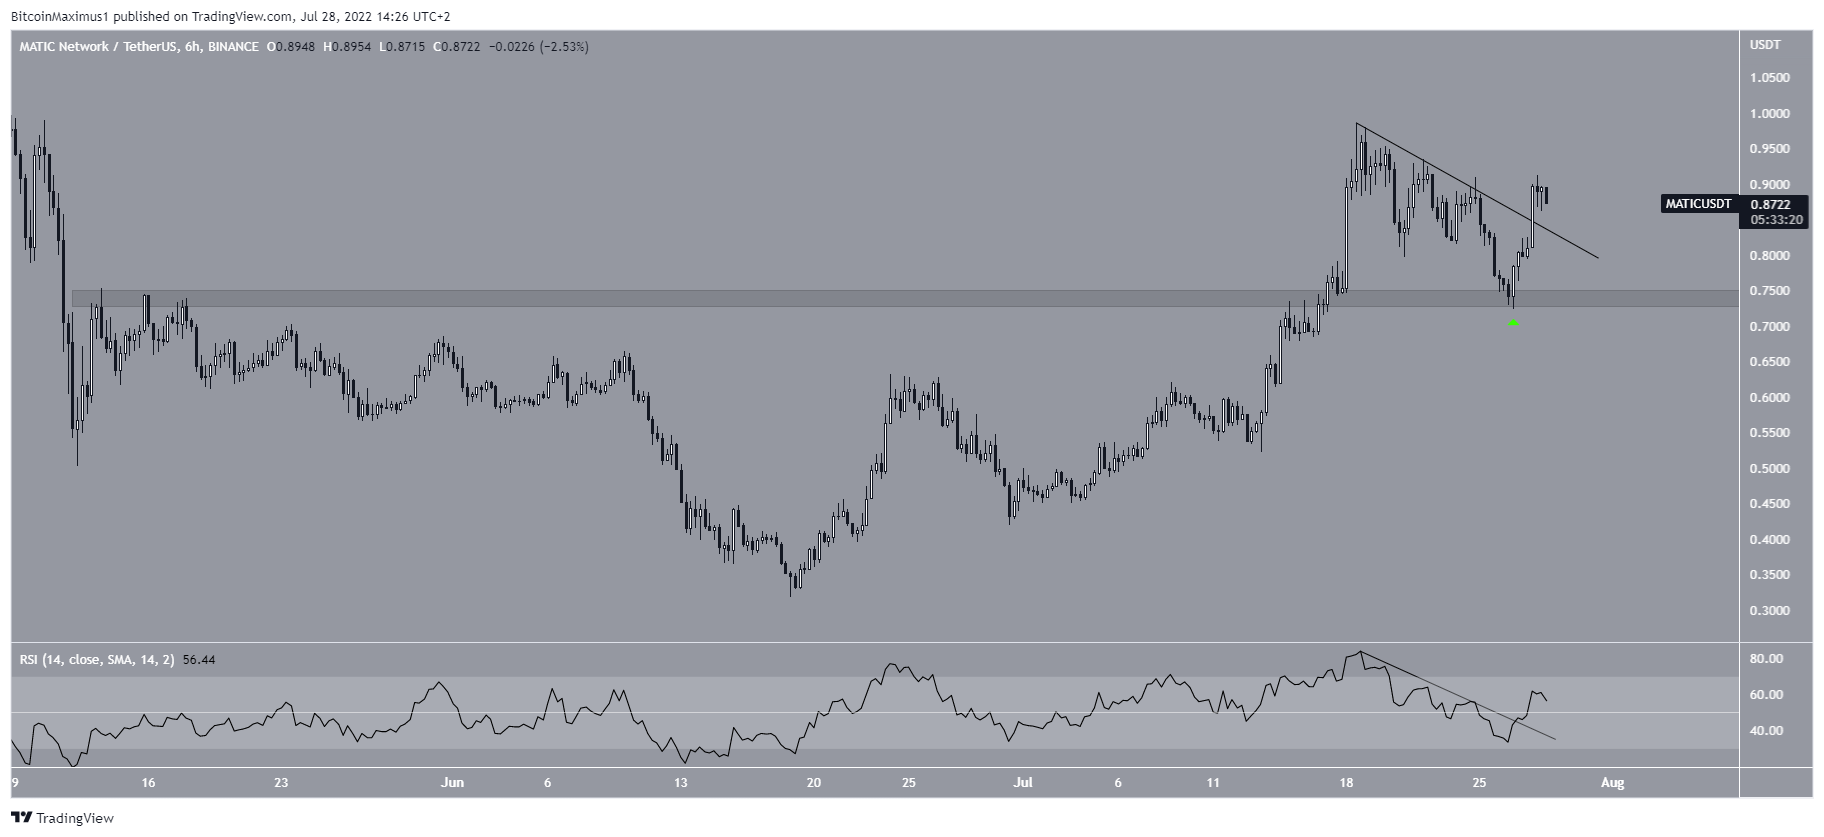
The six-hour chart also provides a bullish outlook. It shows that MATIC has bounced at the $0.74 horizontal support area (green icon). Subsequently, it broke out from a short-term descending resistance. It is currently attempting to validate it as support.
Moreover, the six-hour RSI has also broken out from a descending resistance line and moved above 50, thus supporting the continuation of the upward movement.
MATIC wave count analysis
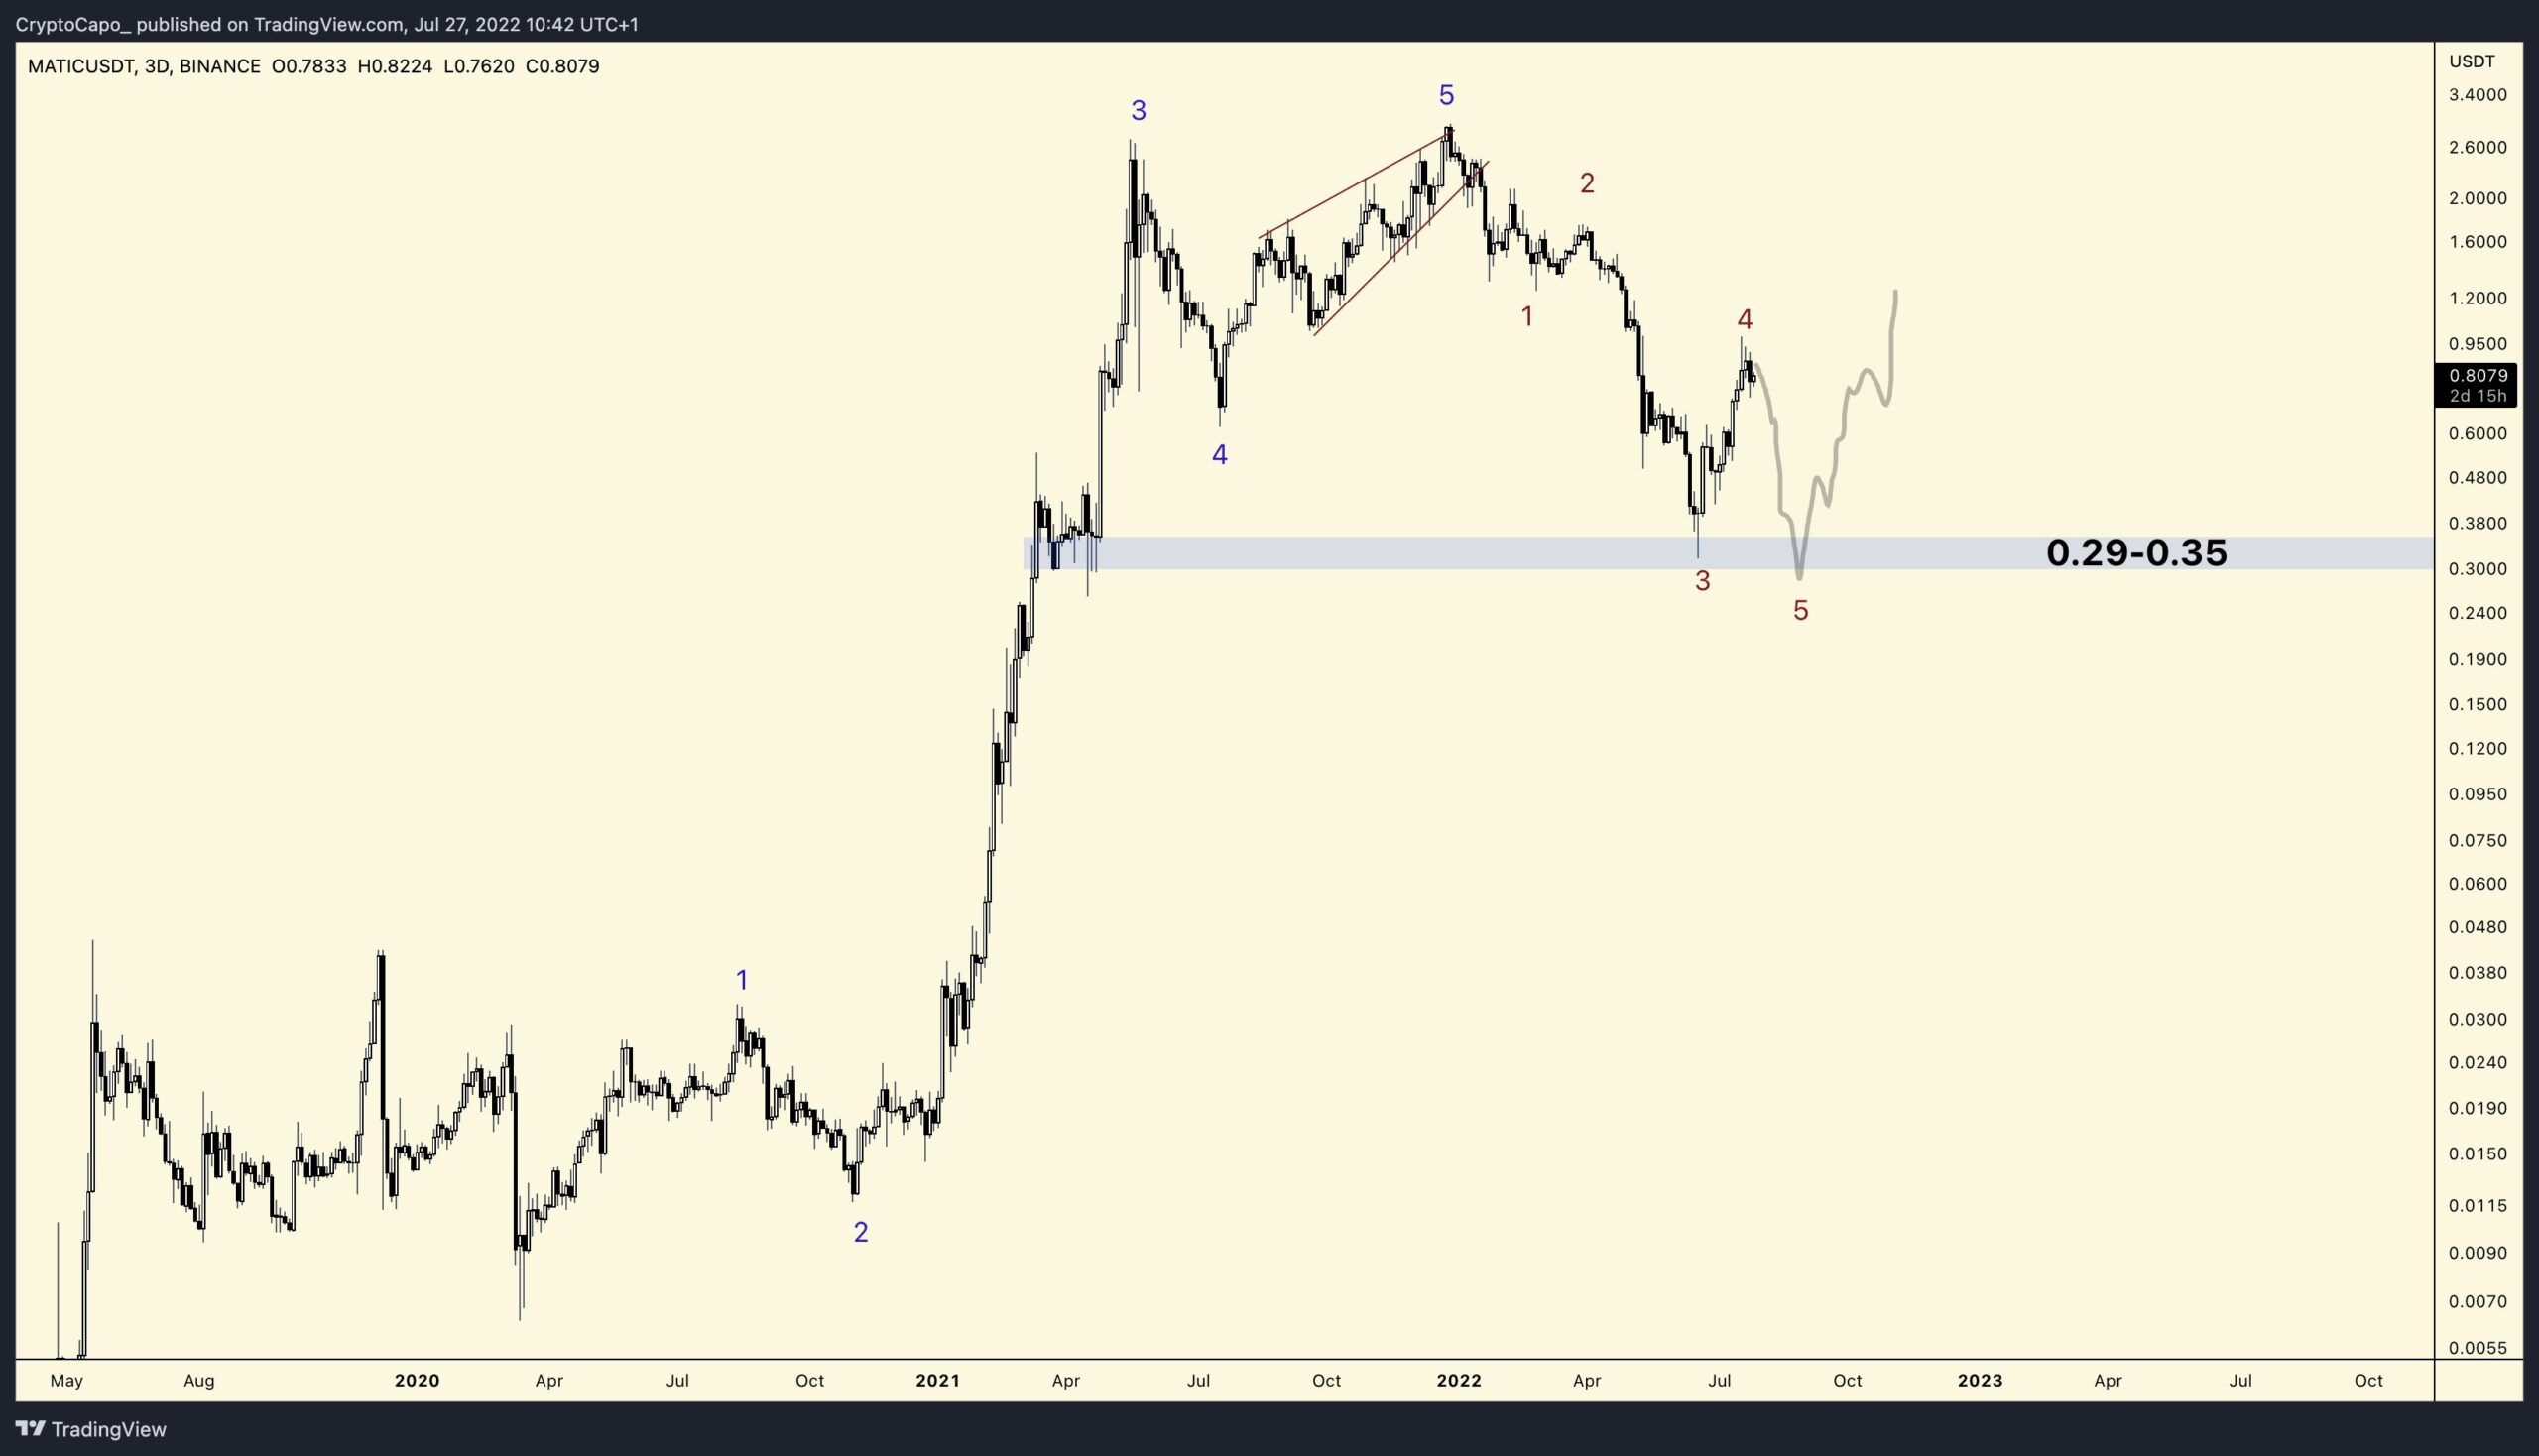
Cryptocurrency trader @CryptoCapo_ tweeted a chart of MATIC, stating that the price is completing wave four of a five-wave downward movement.
While it is possible that the price is still in wave four of a five-wave downward movement, the breakout from the descending resistance line makes this unlikely. So, it would make more sense for the decrease to be an A-B-C corrective structure (black), in which waves A:C have had a 1:1 ratio.
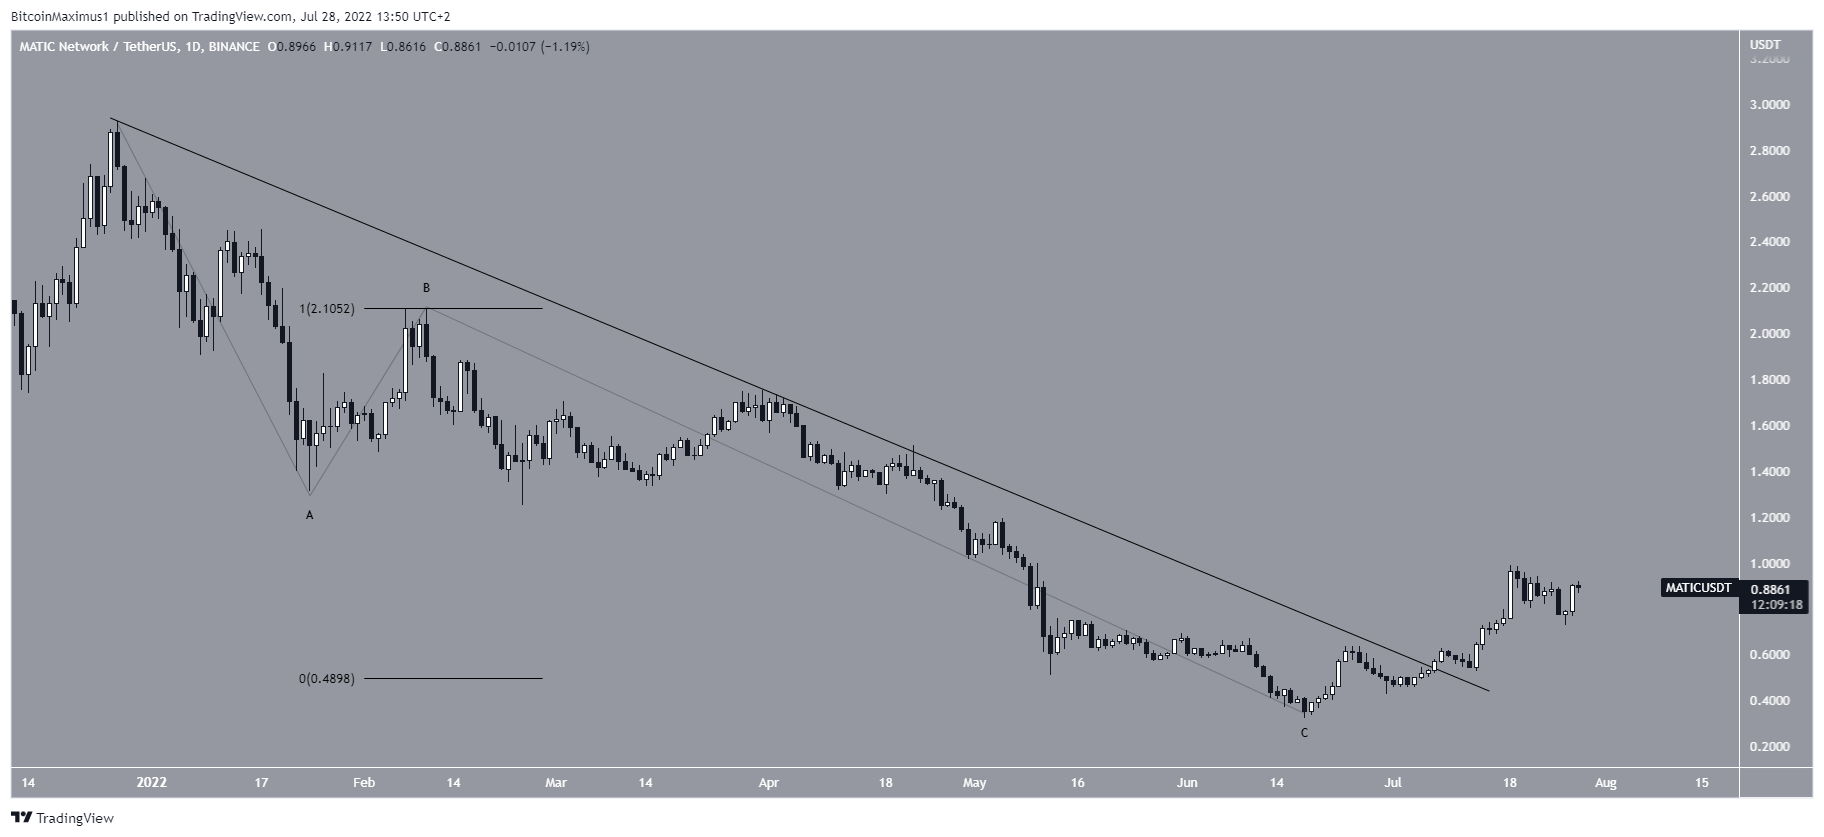
In the short-term, it seems that MATIC began a five-wave upward movement on June 18 and has just completed a fourth wave pullback. The most likely target for the top of the fifth wave is between $1.13-$1.14. The target is found using an 1.61 external retracement on wave four and the 0.618 length of waves one and three (white).
After the target is reached, a retracement would be expected.

For Be[in]Crypto’s latest Bitcoin (BTC) analysis, click here
Disclaimer
In adherence to the Trust Project guidelines, BeInCrypto is committed to unbiased, transparent reporting. This news article aims to provide accurate, timely information. However, readers are advised to verify facts independently and consult with a professional before making any decisions based on this content. Please note that our Terms and Conditions, Privacy Policy, and Disclaimers have been updated.
