


Polkadot (DOT) could validate a long-term bullish pattern with a breakout from a short-term descending wedge.
On Sept. 23, Tether announced that it was launching on Polkadot. This provides a stable currency in order to move in and out from the network. This means that USDT can now be minted in the Polkadot blockchain.
Paolo Ardoino, the CTO of Tether said: “Polkadot is on a trajectory of growth and evolution this year, and we believe Tether’s addition will be essential in helping it continue to thrive.”
DOT price action looks bullish
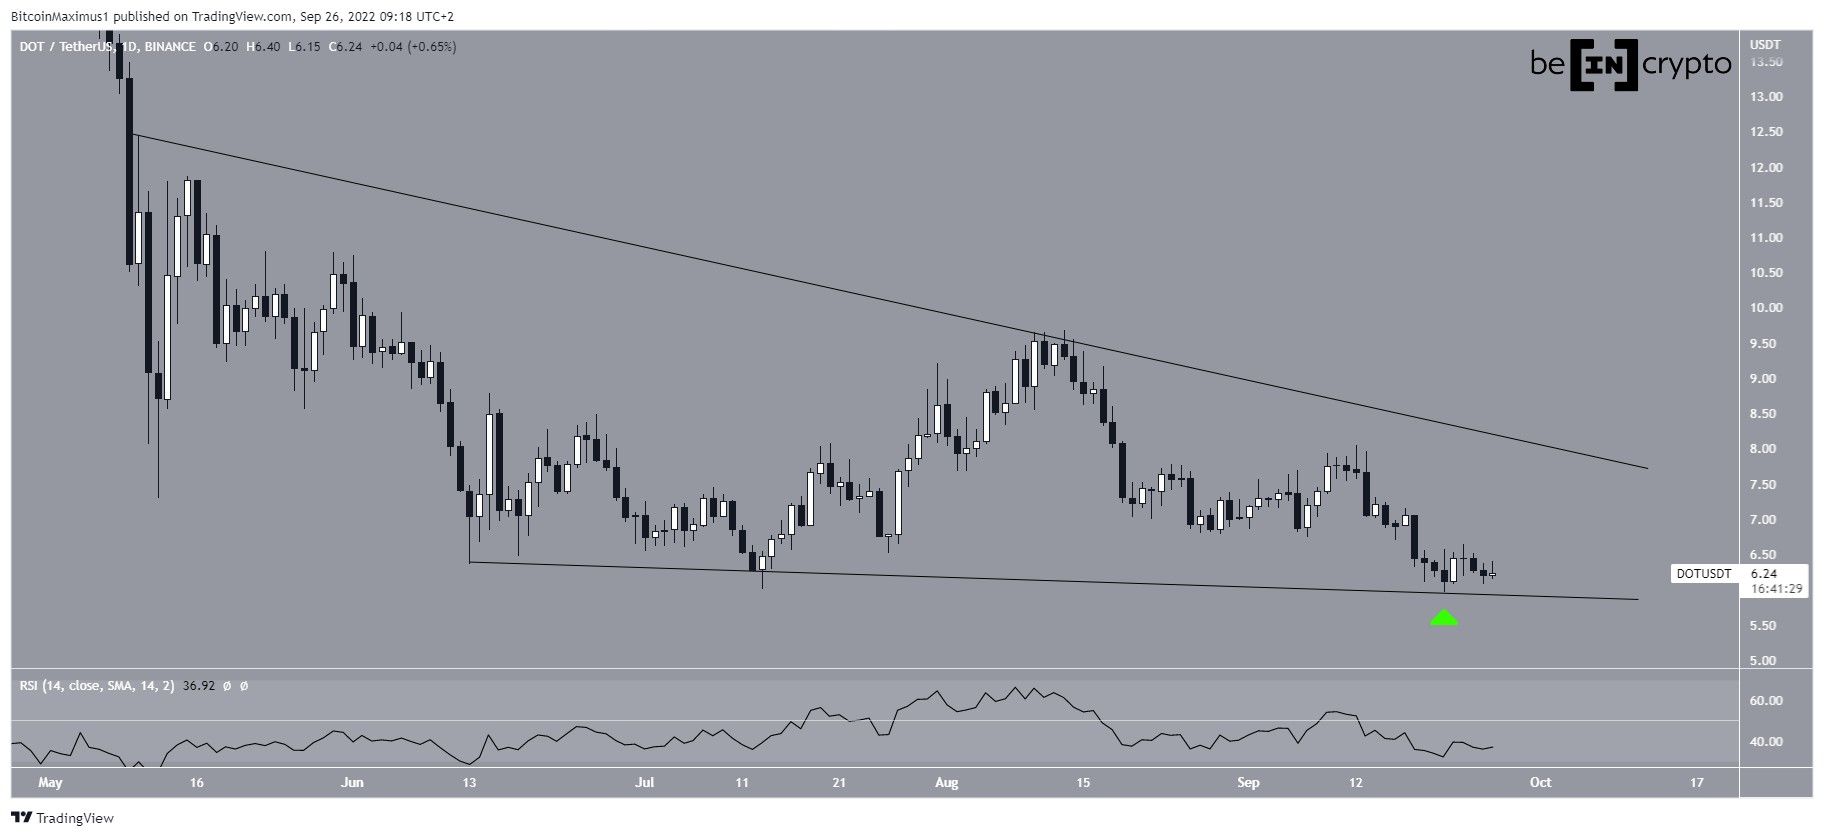
DOT increased slightly the day of the announcement (green icon) and created a bullish engulfing candlestick (highlighted). However, it failed to sustain its upward movement. Now, it has returned to its descending support line.
It is possible that the price has been trading inside a descending wedge since the beginning of May. The wedge is considered a bullish pattern, meaning that an eventual breakout from it would be likely.
However, while the price action shows bullish signs, technical indicators do not. The daily RSI is falling, is below 50 and has not generated any bullish divergence. As a result, the direction of the future movement is still unclear.
Weekly chart suggests breakout incoming
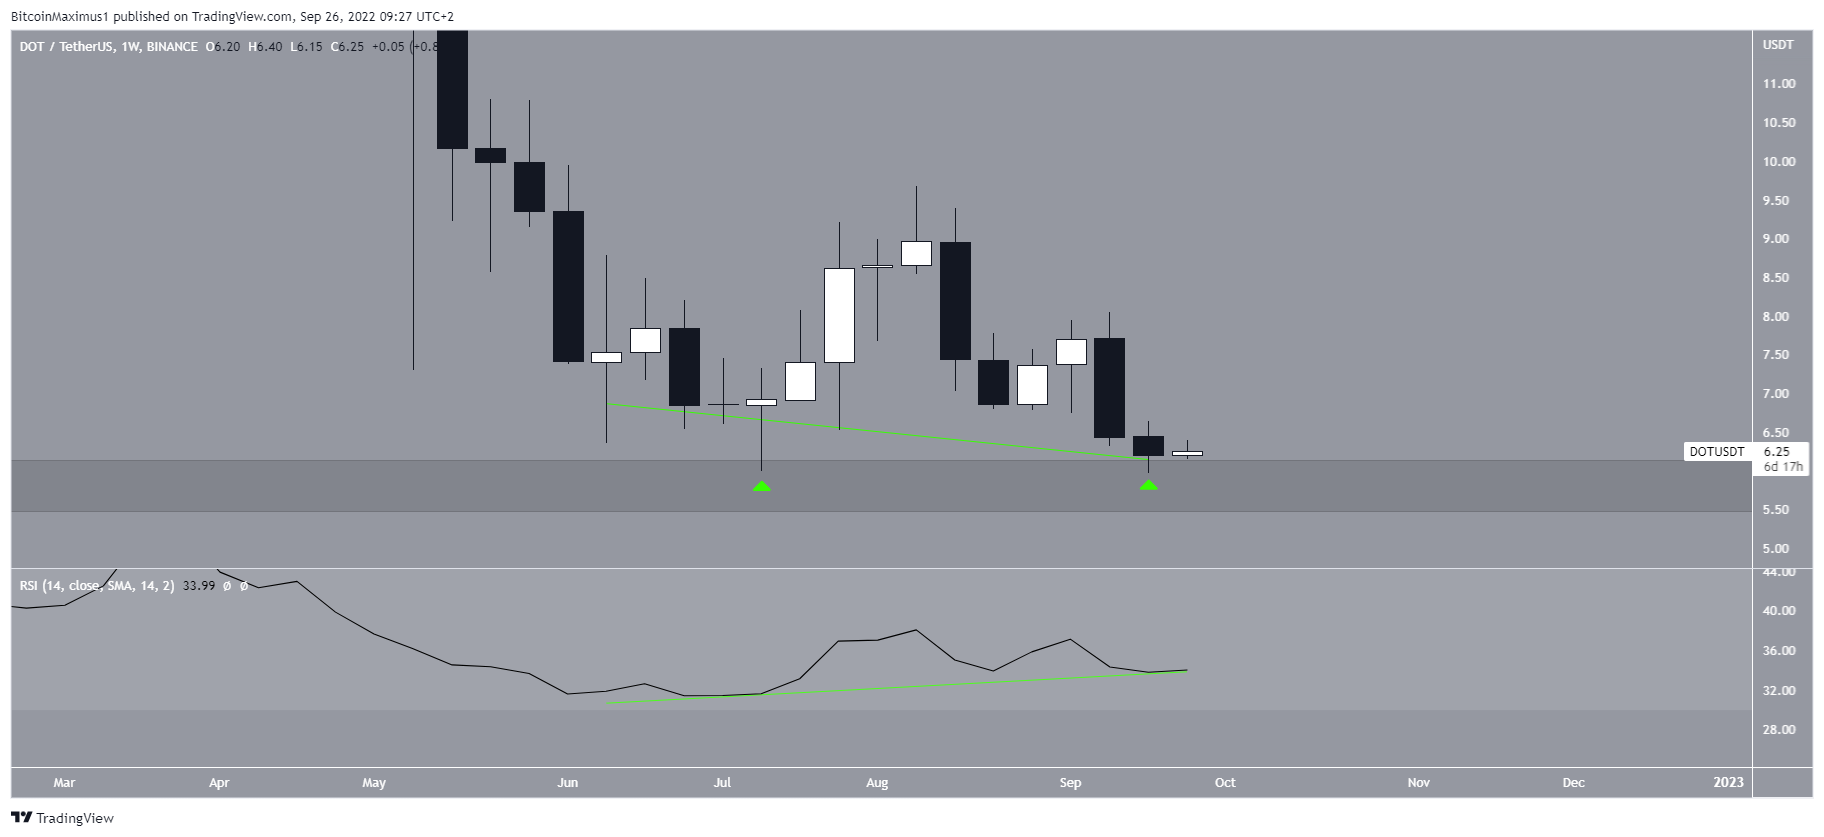
The weekly chart however is more bullish. It shows that DOT is in the process of creating a double bottom pattern (green icons) above the $6 horizontal support area. The area previously acted as resistance in Sept. and Nov. 2020 and is now expected to provide support. Additionally, the weekly RSI has generated bullish divergence (green line).
Therefore, the weekly chart supports the validation of the descending wedge and a potential breakout afterwards. Though it is possible that the price will linger on in the wedge for a period of time, creating a slightly lower low before eventually breaking out.
For Be[In]Crypto’s latest Bitcoin (BTC) analysis, click here


