
The DASH price has been decreasing since reaching a high of ₿0.0161 on Jan 15. The decrease intensified on Feb 15 and the price has increased by 26% since.
Dash (DASH) Price Highlights
- The DASH price broke down from a symmetrical descending triangle.
- A golden cross has transpired.
- There is support at ₿0.0085.
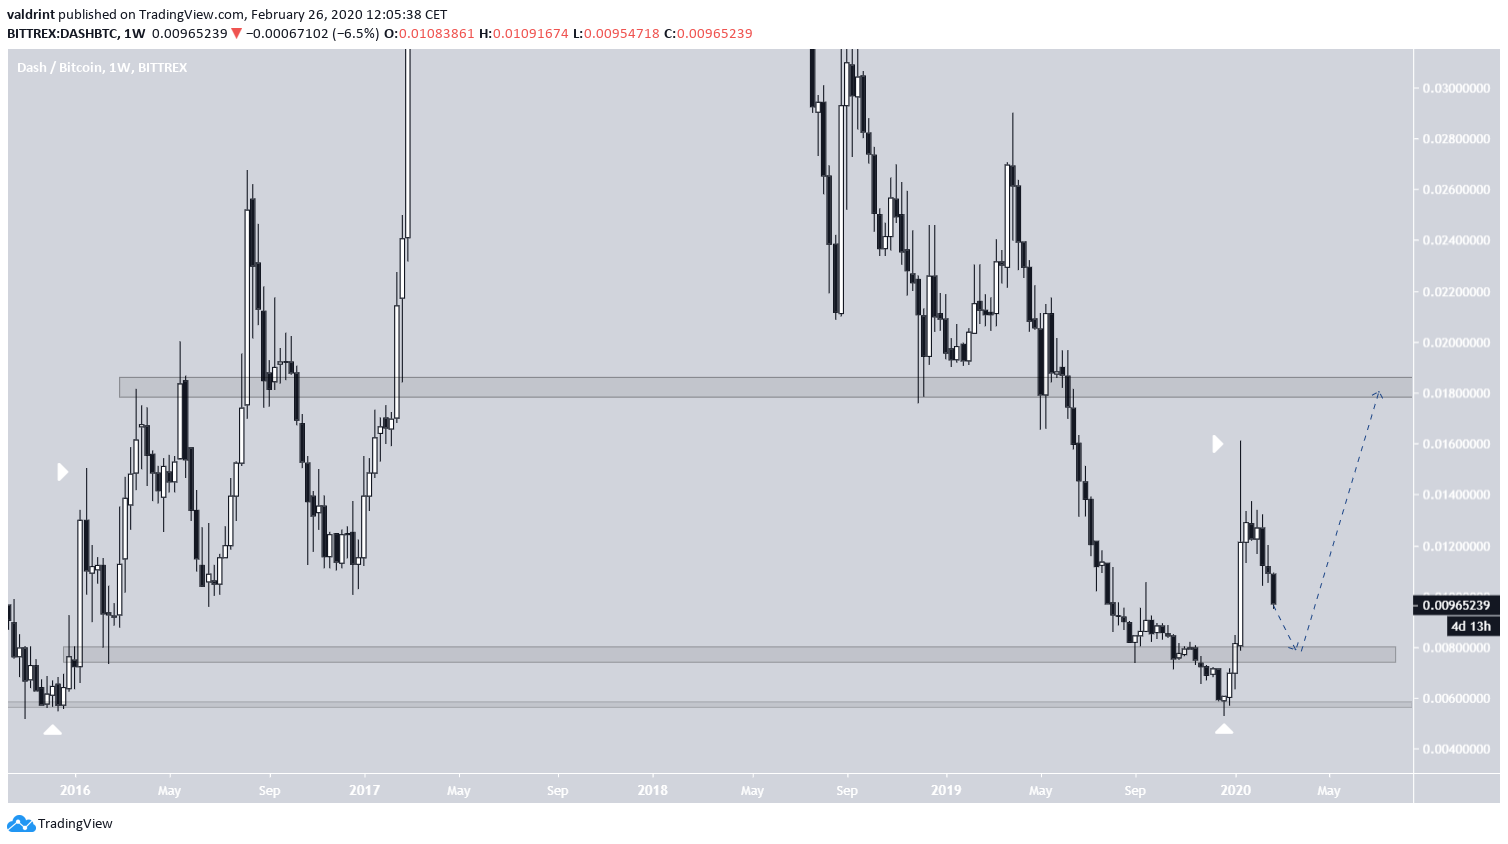
- DASH might be following a fractal from 2016.
Full-time trader @CryptoMichNL tweeted a DASH price chart outlining similarities between the current movement and that which began in January 2016. If the fractal continues to hold, he believes the price will double in value from the current level and reach ₿0.018.
Still following this one (mainly for fun purposes) as a potential fractal here.
Made a similar bounce as in January 2016, actually to the same level as back then.
Now retracing (which is healthy).
New rally could initiate towards 0.018 satoshis. pic.twitter.com/Jg08iUMfNi
— Michaël van de Poppe (@CryptoMichNL) February 25, 2020
Previous Breakout
On Jan 10, the DASH price broke out above a descending resistance line. It initiated a rapid upward movement, increasing by 150% in only five days to reach a high of ₿0.0161 on Jan 15.
On Jan 31, a bullish cross transpired between the 50 and 200-day moving averages (MA), otherwise known as a golden cross. The price has almost reached the 200-day MA, which is currently at ₿0.0085 and expected to provide support.
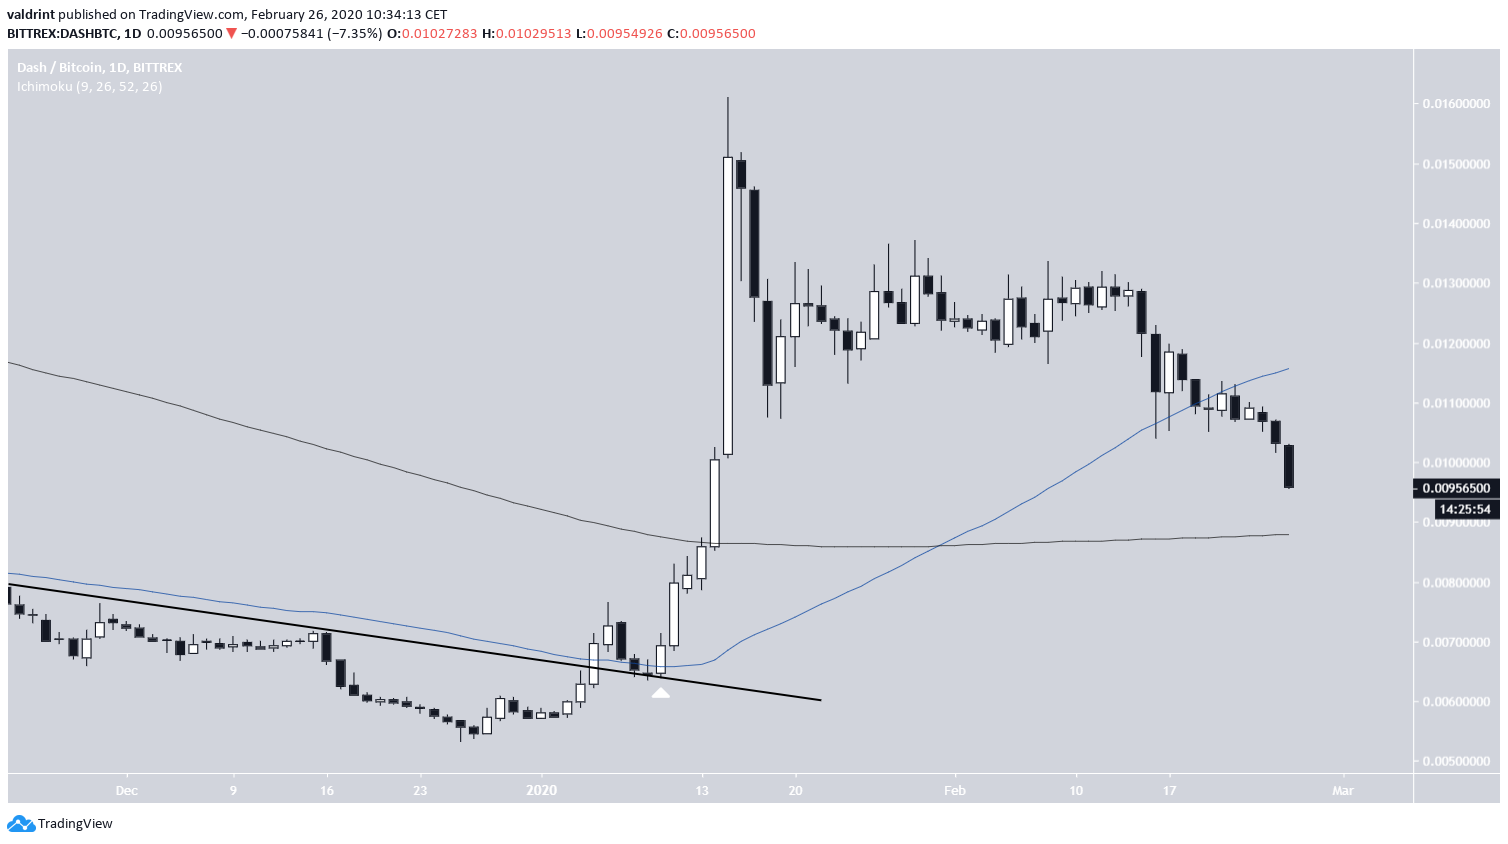
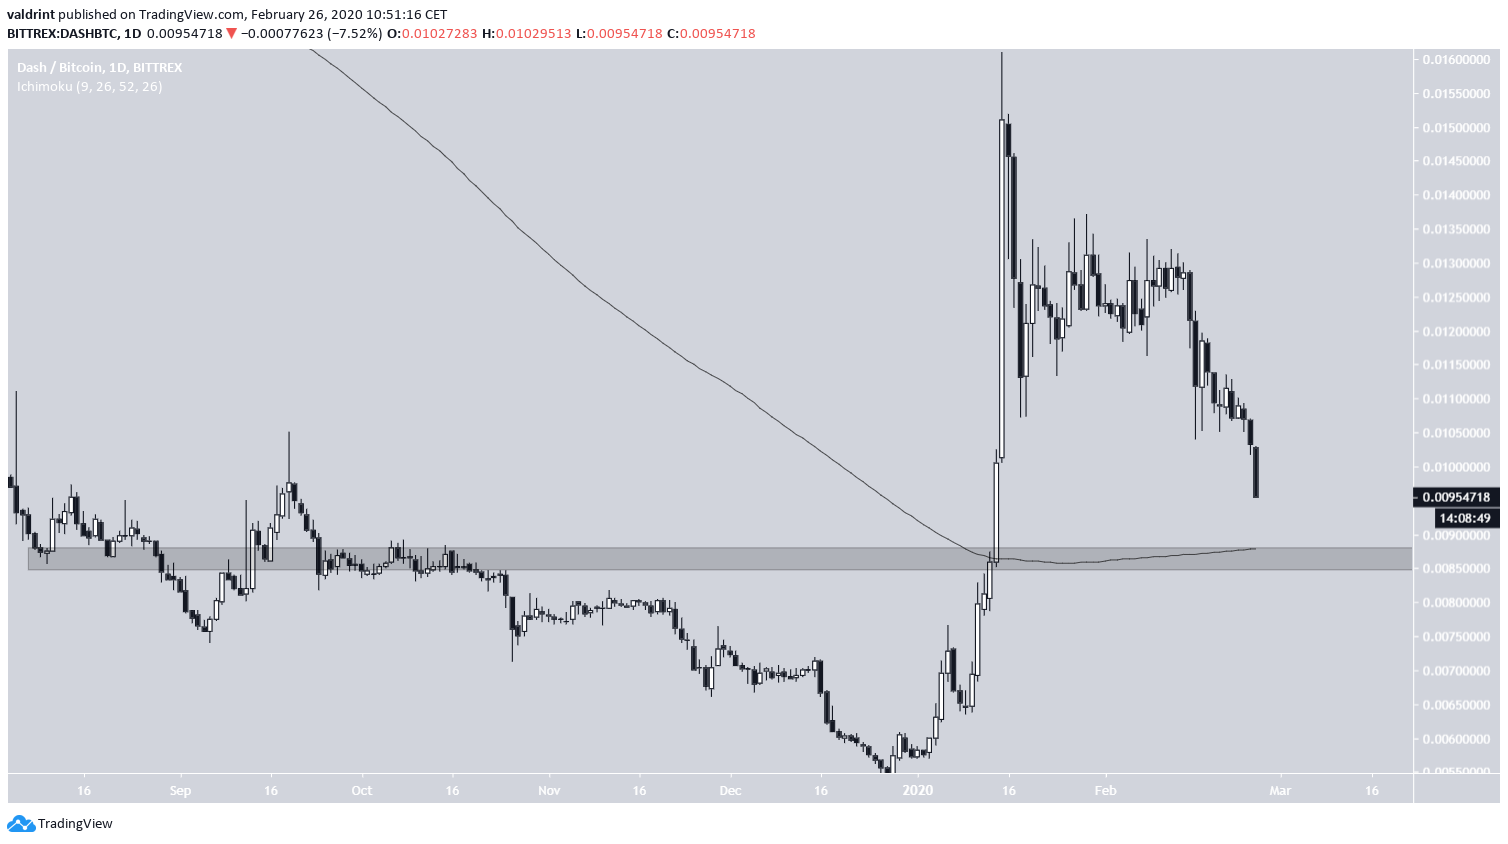
The main support area is found at ₿0.0085. Besides the MA support, it is also a level that previously has acted as both resistance and support.
Therefore, the price is expected to reach this level, and possibly bounce once it gets there.
Symmetrical Triangle
On Feb 15, the BTC price broke down from a symmetrical triangle. After validating the support line as resistance shortly afterward, it continued to decrease at an accelerated rate.
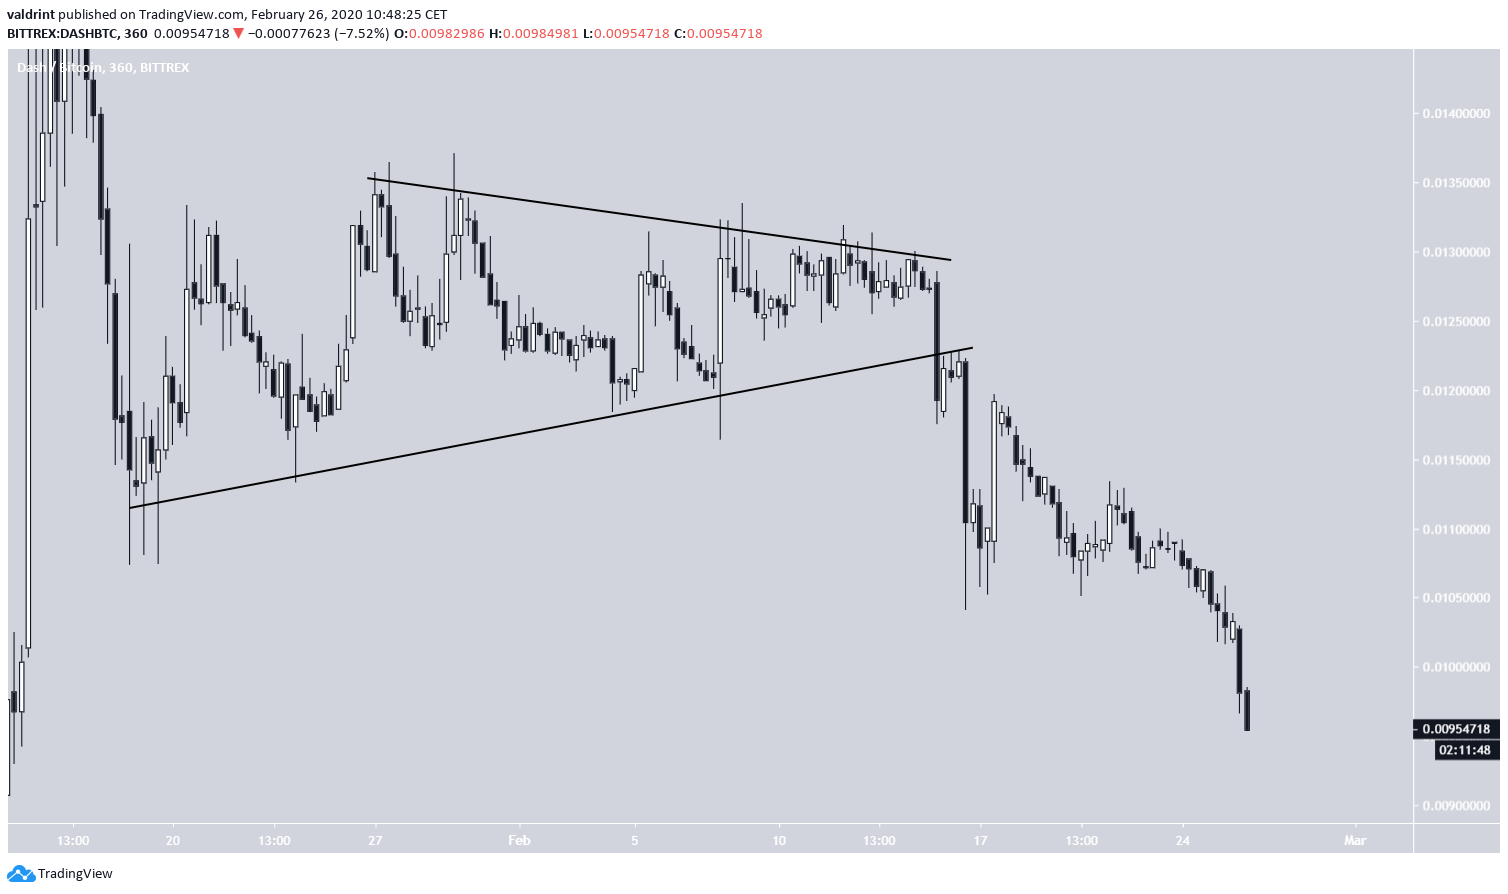
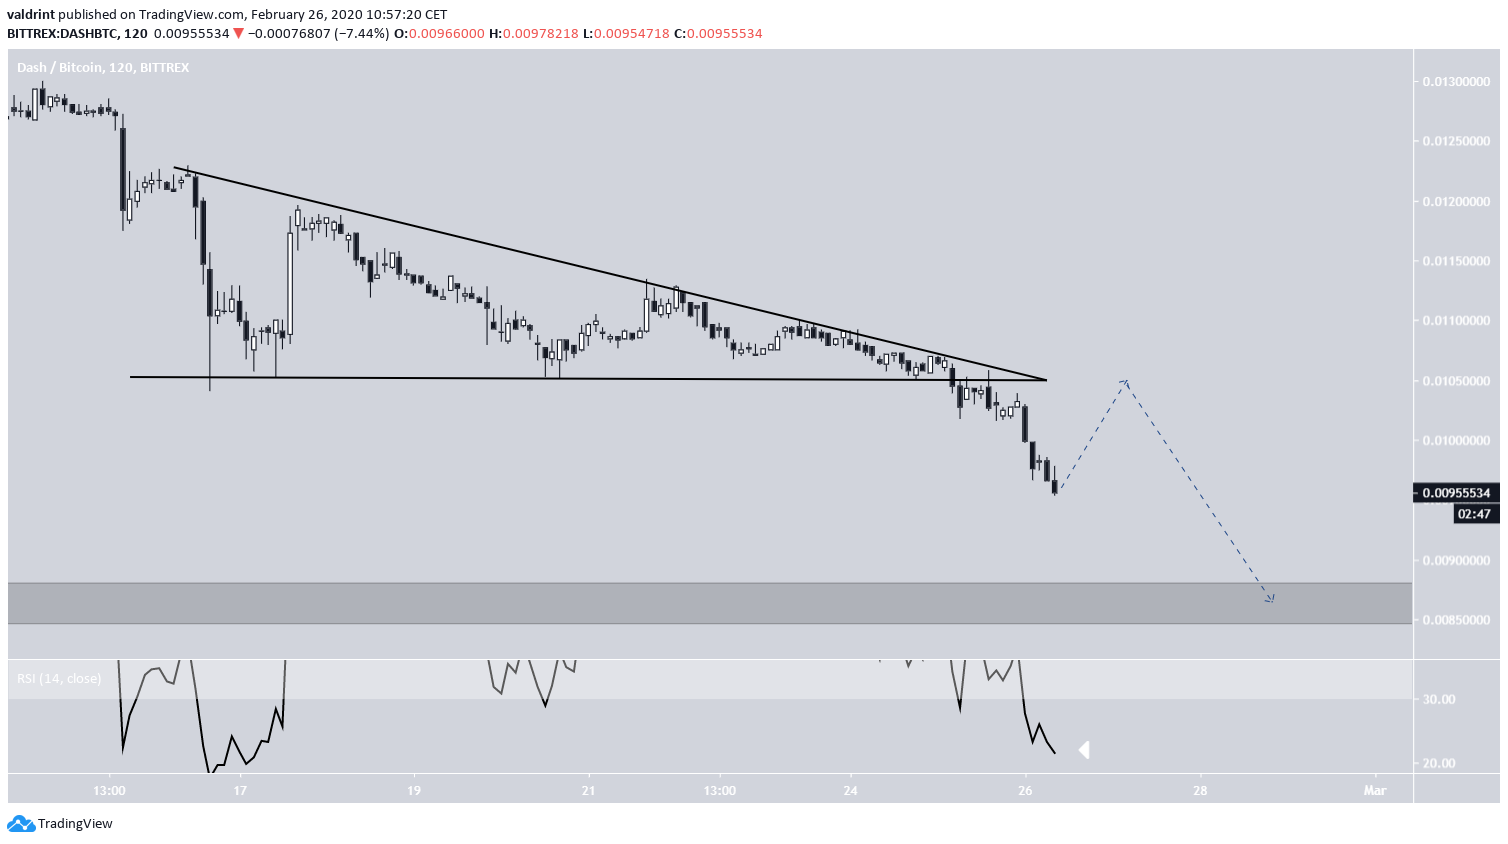
The decrease took the form of a descending triangle, from which the price also broke down.
The RSI is deep into the oversold territory but has yet to generate any bearish divergence. Therefore, while a bounce could transpire, in order to validate the breakdown level, the price is expected to decrease to the support area afterward.
2016 DASH Fractal Return?
The fractal mentioned in the tweet began in January 2016, at the ₿0.0055 level, almost identical to the current upward movement that began in December 2018.
Interestingly, the ensuing highs were also very similar, both topping out near ₿0.015.
If the price continues following this fractal, it will make a low near ₿0.0085 before continuing upwards towards ₿0.018.
To conclude, the DASH price has been decreasing rapidly. It will likely continue until reaching the support area at ₿0.0085. After, it is expected to move upwards to possibly reach ₿0.018.
