Let’s take a closer look at the DASH price and try to outline its future movement.update on $DASH
— Nico (@CryptoNTez) January 11, 2020
Not perfect but close enough
Retested support at ~671k (following BTC) & pushed back with nice volume crossing 1st target at ~746k sats
UCTS 1D & 2D signals together are usually a winner😏
Looking for further continuation, make sure to update your SL!#DASH pic.twitter.com/61xta2hBib
Descending Resistance Line
On January 4th, the DASH price broke out above the long-term descending resistance line. We discussed the long-term ramifications for this move in our previous analysis. Afterward, it returned to validate the line as support and initiated another upward move, which was successful in increasing above the 100-day moving average (MA). Currently, the price has almost reached the 200-day MA. In addition, volume has been decreasing since the breakout, possibly signaling weakness for the bulls. The 750,000 satoshi area could act as support afterward in the future.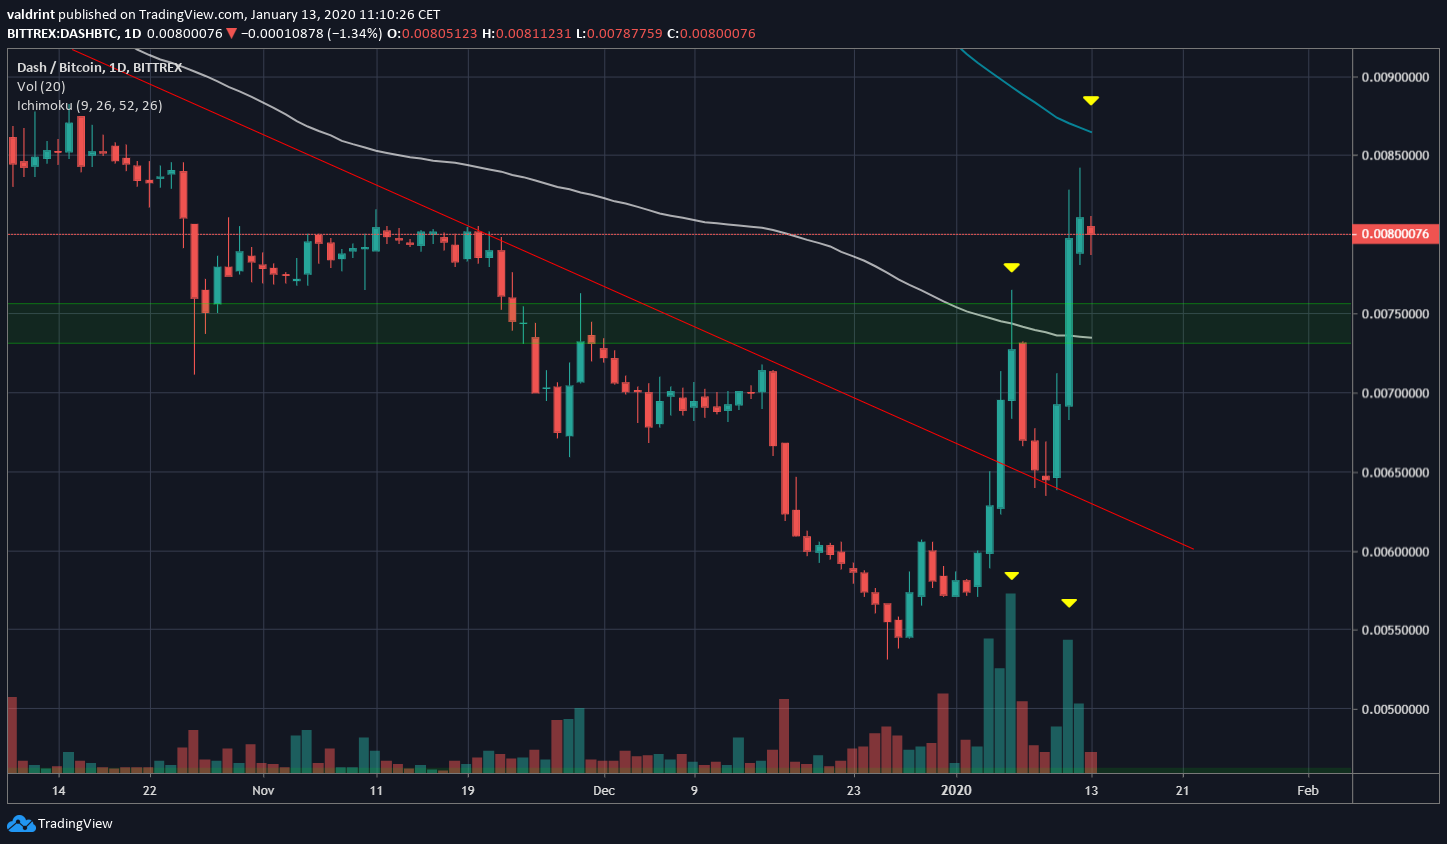
Five Wave Elliott Formation
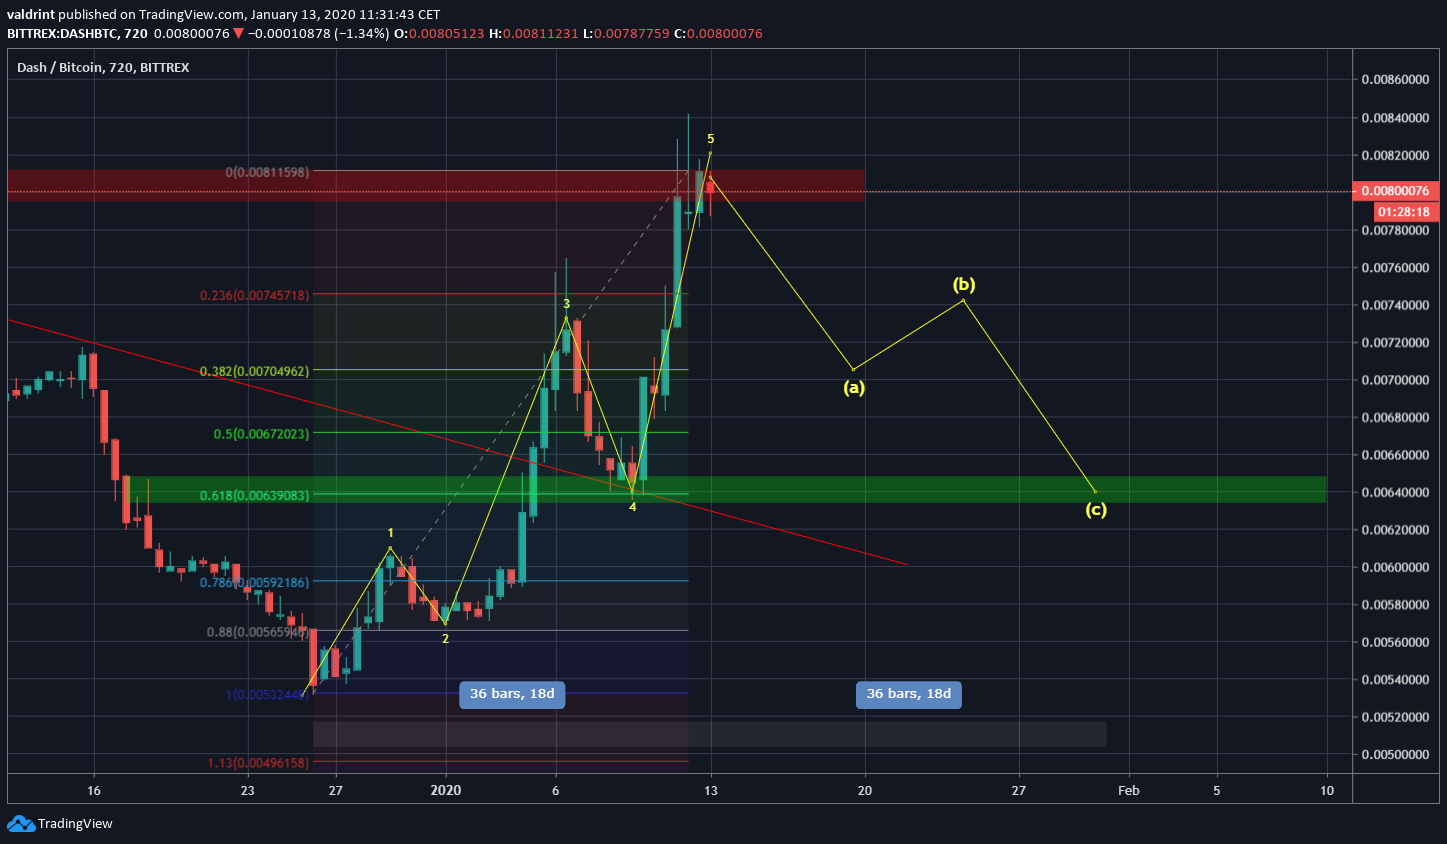
Looking closer at the movement that caused the breakout, we can see it has all the characteristics of a five-wave Elliott formation. The first upward move was small and transpired with negligible volume. The third wave was the longest and had the highest volume. The fifth wave has the steepest rate of increase, almost becoming parabolic. However, it is also accompanied by decreased volume and bearish divergence in the RSI. The fact that it is ending near the resistance area of 800,000 and the previously mentioned 200-day moving average (MA). only strengthens this belief. If so, what follows afterward is often an A-B-C correction.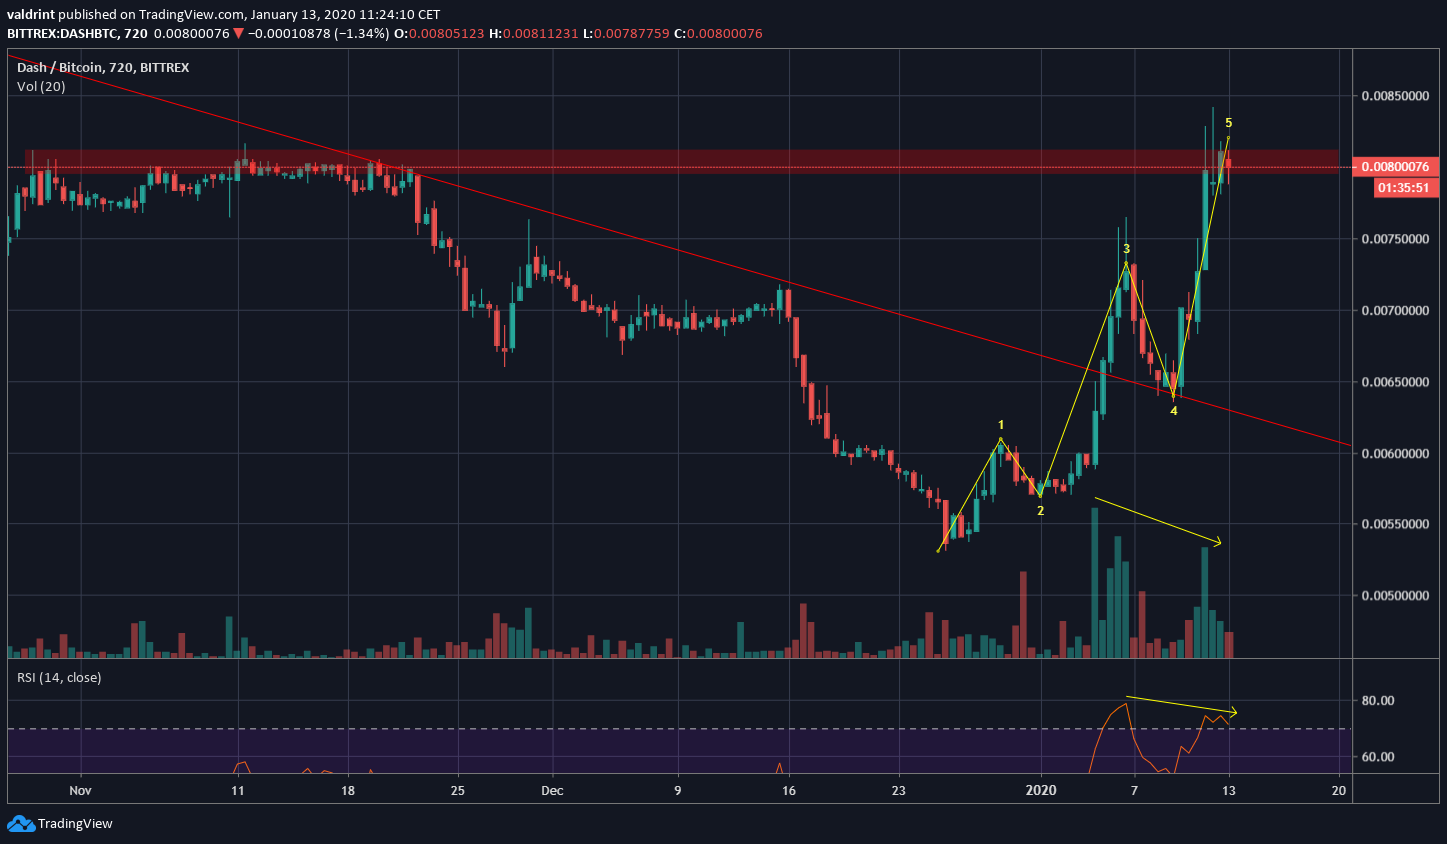 A rough outline of the possible A-B-C correction is given below. The likeliest place for the end of the correction is found at the 640,000 satoshi support area, the 0.618 fib level. If the correction takes as long as the previous upward move, it will be finished by the end of January.
DASH Trading Outlook
For hypothetical trading purposes, initiating a short trade with an entry at 800,000 satoshis and a stop loss of 851,000 satoshis with a target of 640,000 satoshis will give us a Risk:Reward ratio of 1:3. The target could be reached by the end of January.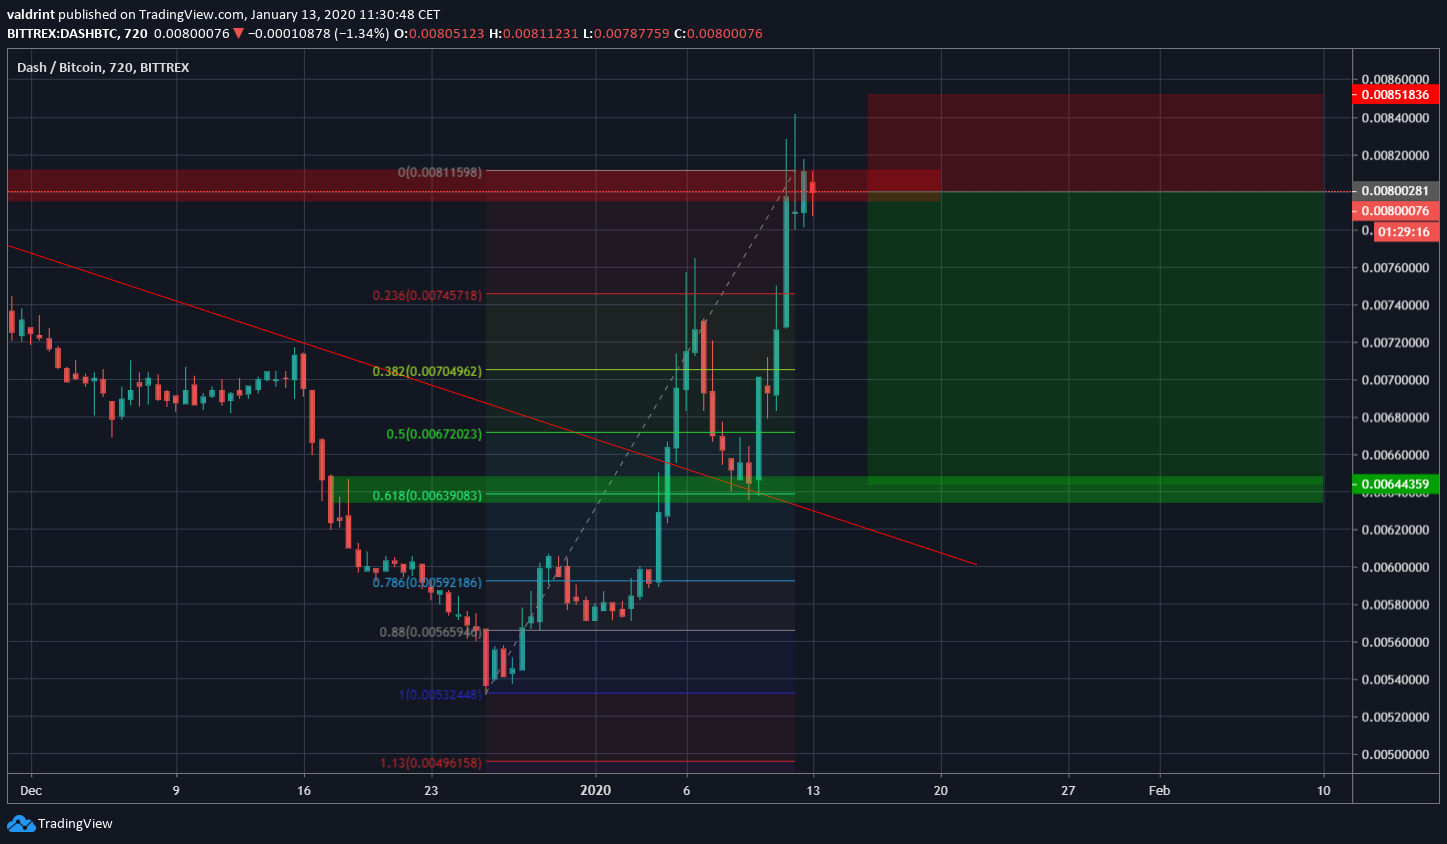 Finally, the tweet warns to “make sure to update your stop losses.” Judging by the position of the parabolic ascending support line this does not seem so straightforward.
Placing a stop loss below 750,000 satoshis seems like the logical play, but this level is above the ascending support line until January 16th. Therefore, it runs the risk of the price triggering the stop loss and moving upwards.
In addition, placing it at 780,000 runs the same risk, however, it locks up roughly 5% more profit, making it a better place to exit the price.
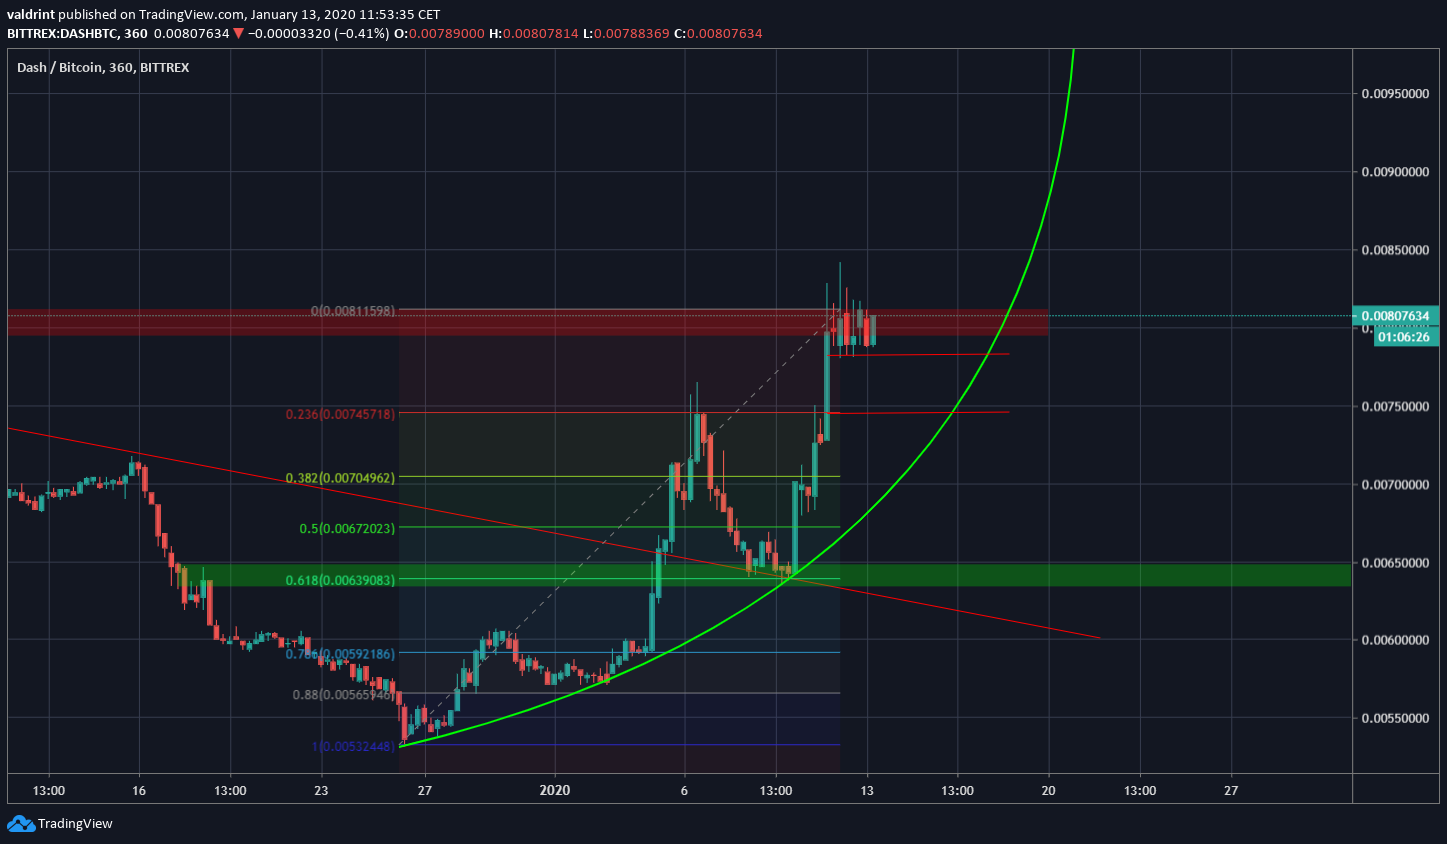 To conclude, the DASH price recently broke out above a long-term descending resistance line. However, it seems to have completed a short-term five-wave Elliot formation. Therefore, a correction awaits before the price continues reaching new highs.
Disclaimer
In line with the Trust Project guidelines, this price analysis article is for informational purposes only and should not be considered financial or investment advice. BeInCrypto is committed to accurate, unbiased reporting, but market conditions are subject to change without notice. Always conduct your own research and consult with a professional before making any financial decisions. Please note that our Terms and Conditions, Privacy Policy, and Disclaimers have been updated.


