


The Bitcoin price has reached a descending resistance line that has been in place for more than two years. A breakout above this line would have major bullish implications for the future price.
Well-known trader @crypto_rand outlined a BTC chart that shows a possible bullish pennant, which he believes could cause a breakout, giving a target of $10,600.
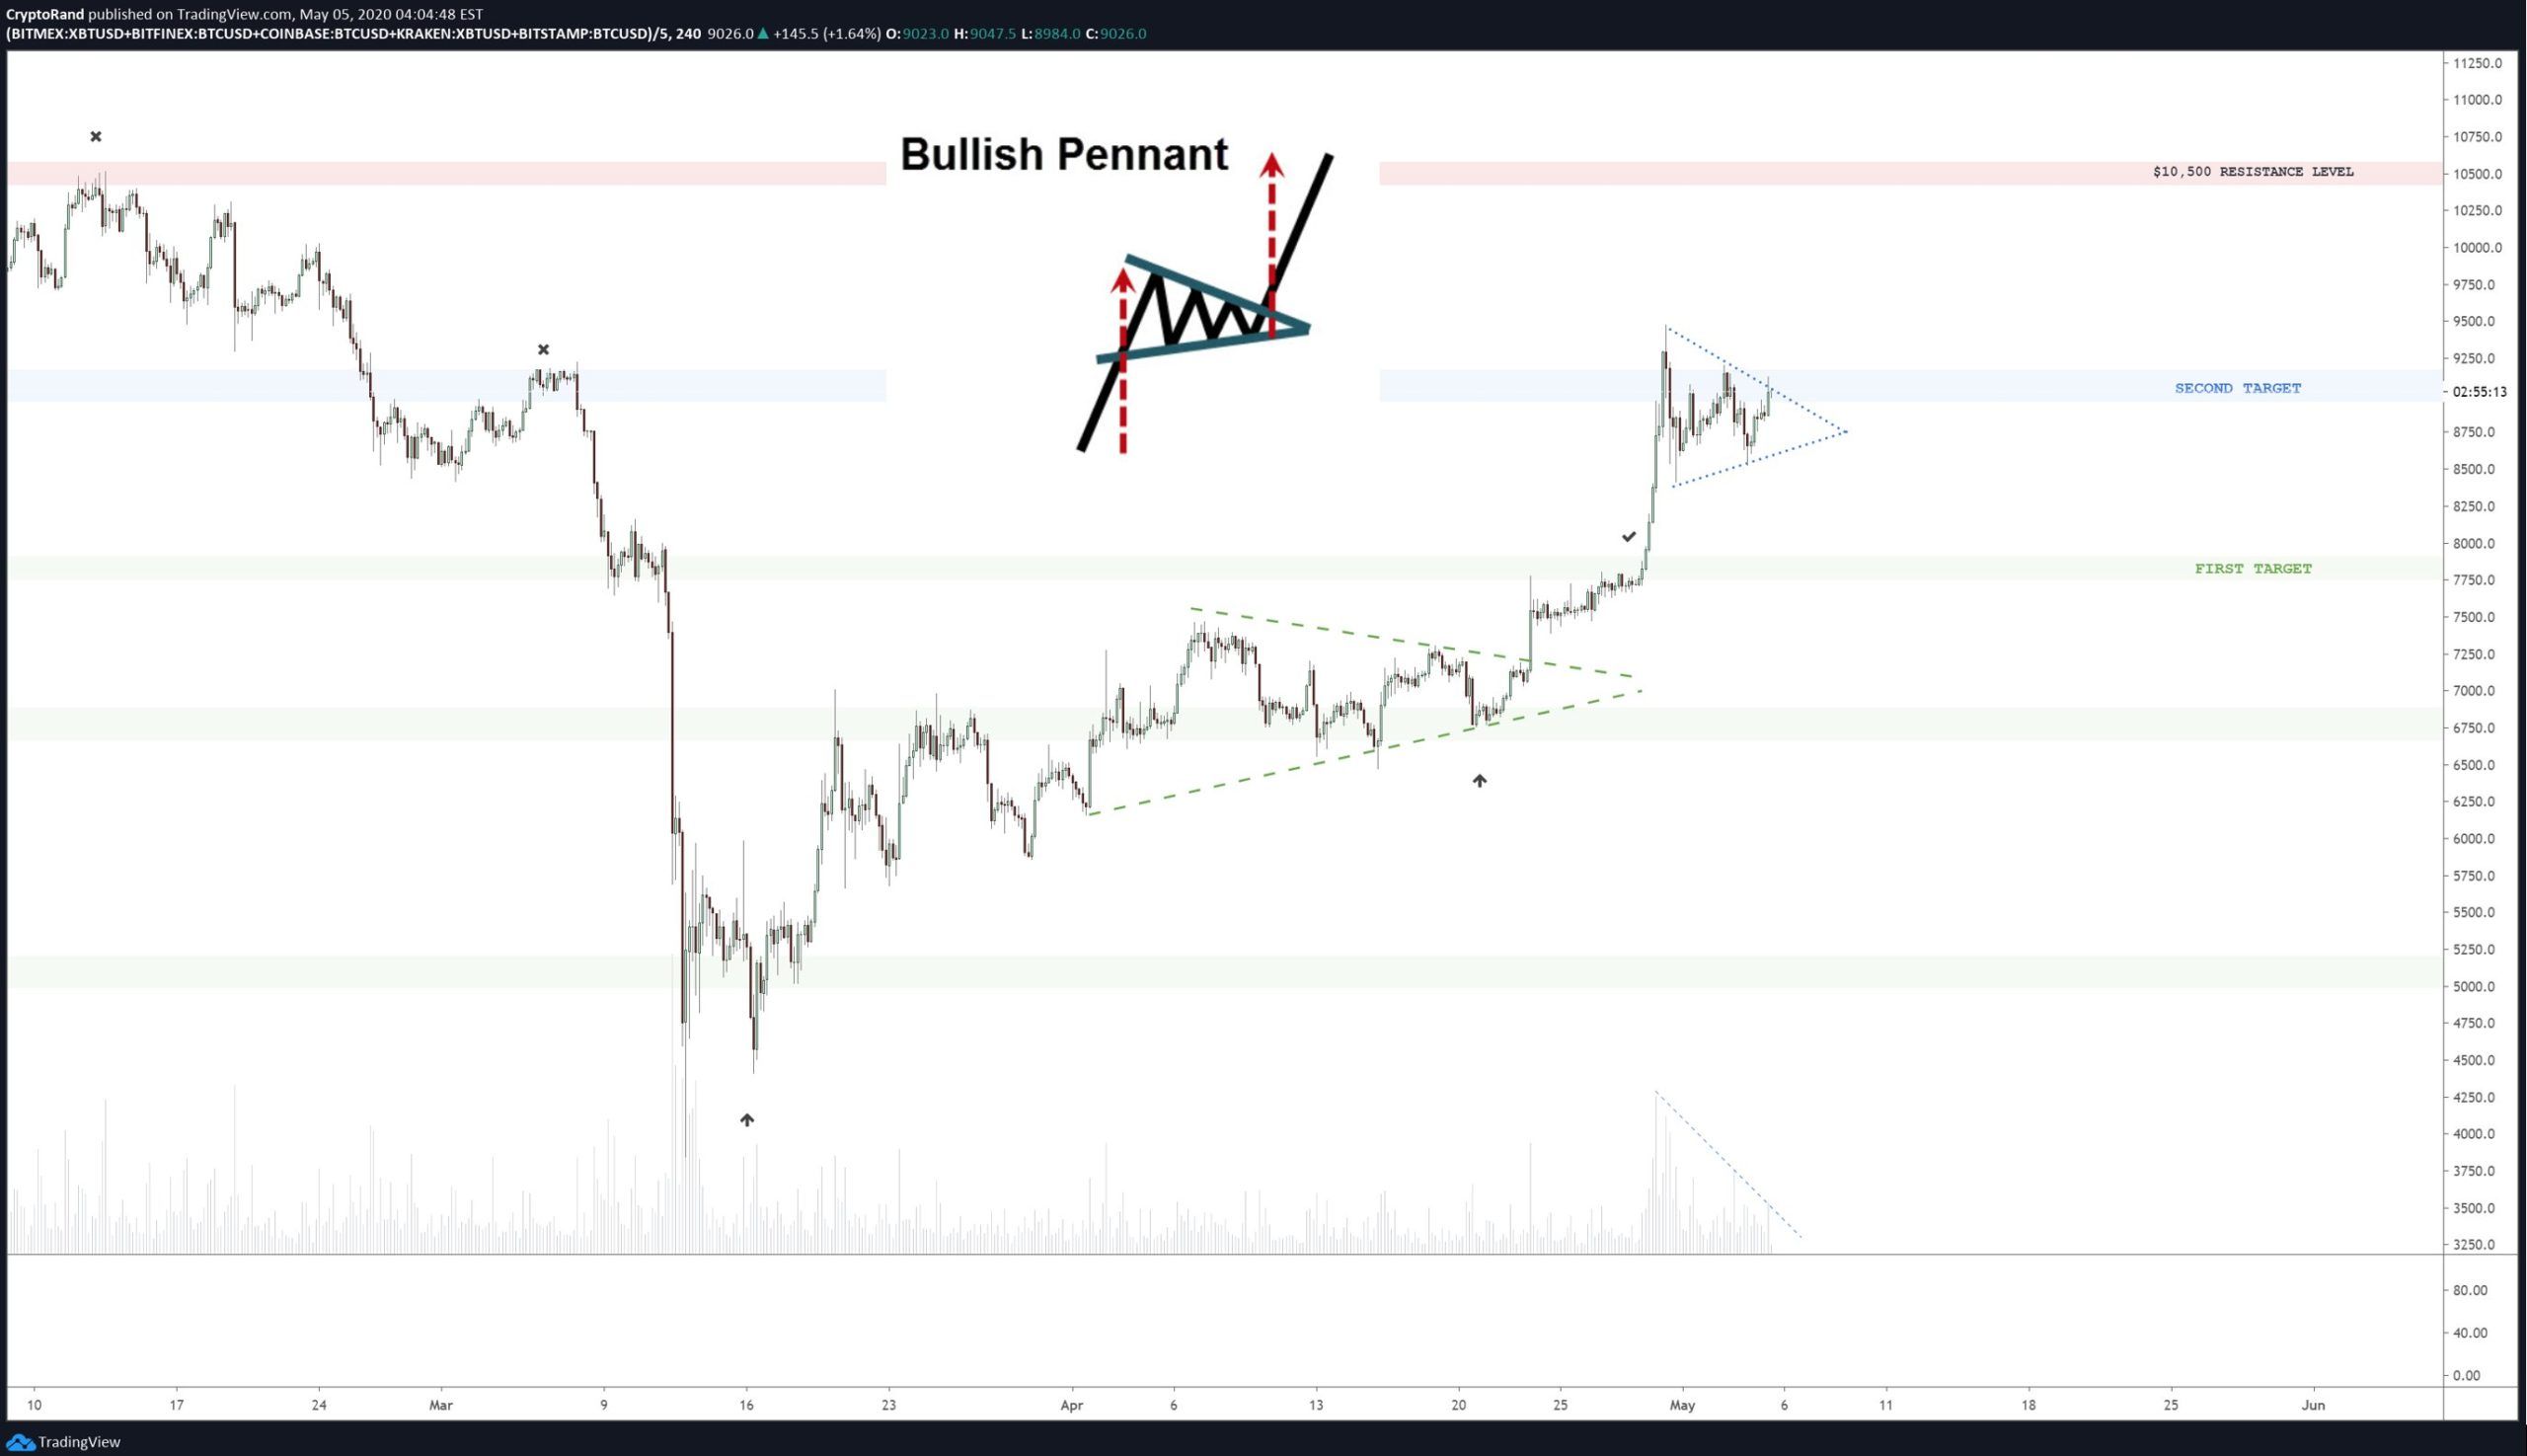
In this article, we will take a closer look at the BTC price movement and determine if the pennant has actually been created and the BTC price will break out.
Long-Term Resistance Line
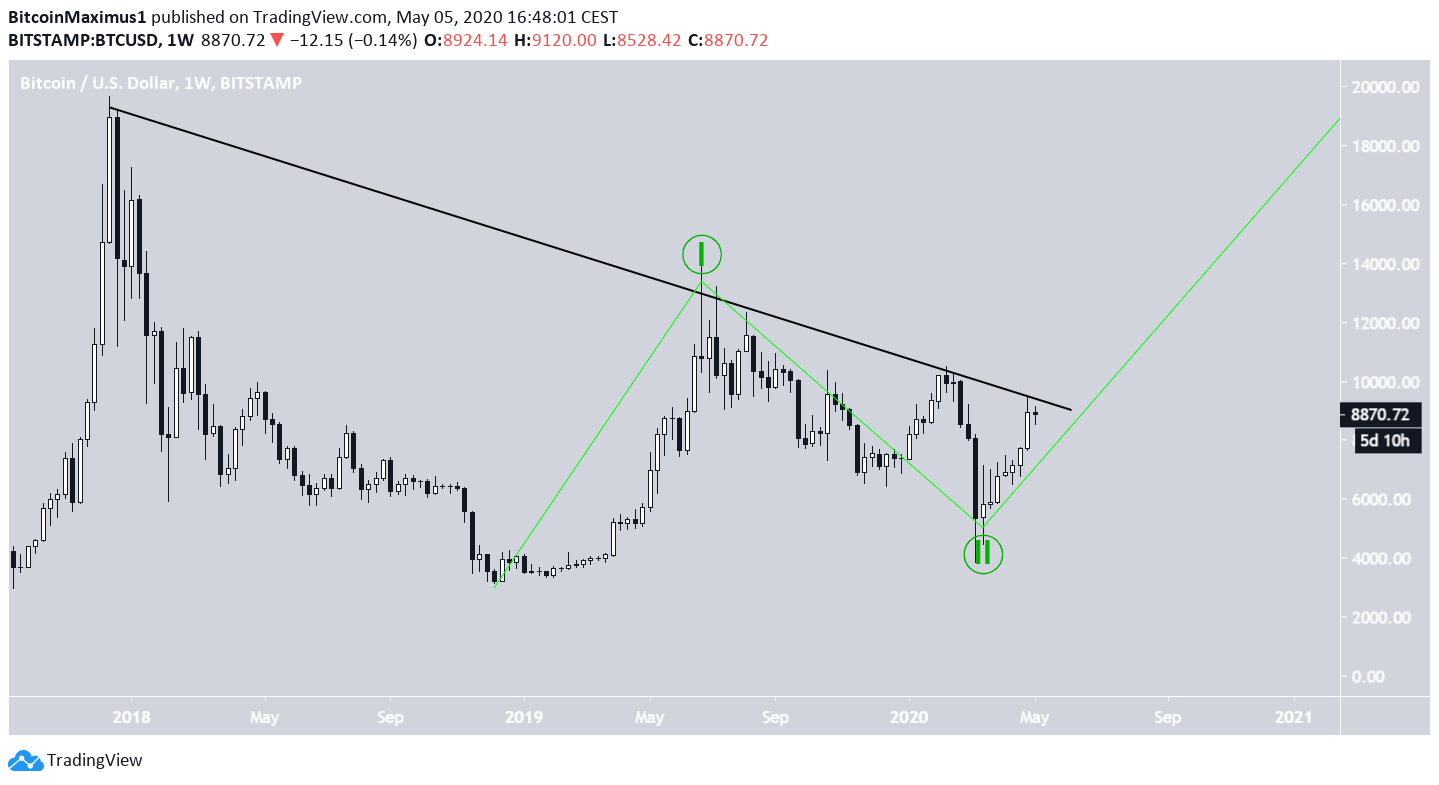
If the price is indeed trading inside a bullish pennant and breaks out, the breakout would not be a short-term occurrence but would have long-term ramifications instead. The weekly chart shows that the price has just reached a descending resistance line that has been in place for 875 days. Therefore, a breakout from this pennant would also mean a breakout above the long-term resistance line.
For the price to move in this direction, it would mean that the correction ended in December 2018 and the March bottom was just a higher low. In this scenario, the price is currently in wave three, which will cause a breakout above this long-term resistance line. Therefore, we have to find the proper short-term wave count that fits with this hypothetical breakout and the breakout from the short-term pennant.
Bullish Wave Count
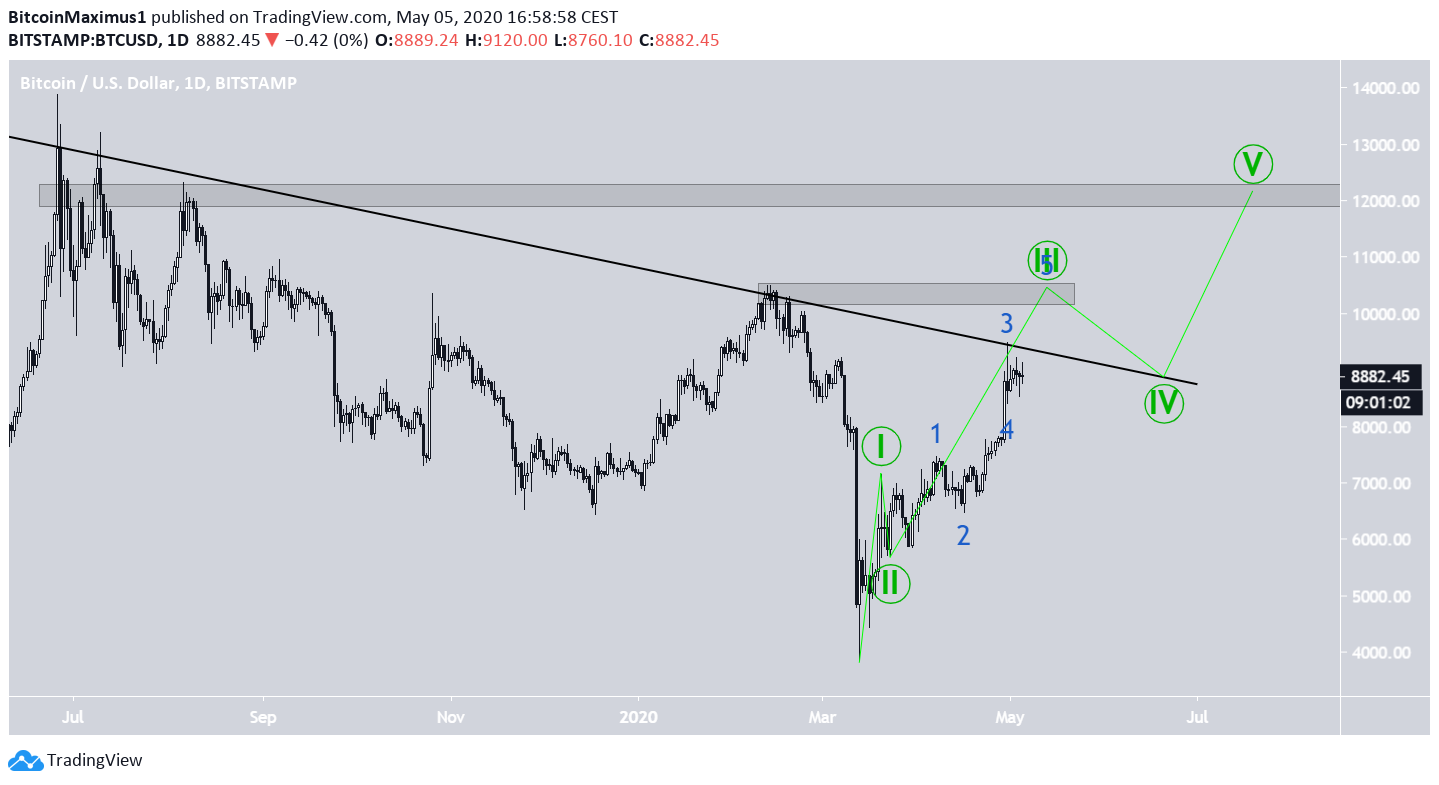
In order for this breakout to occur, the price would have to have begun a five wave Elliott formation on March 13. In the chart below, this formation is shown in green, with the price currently being in the third (III) wave.
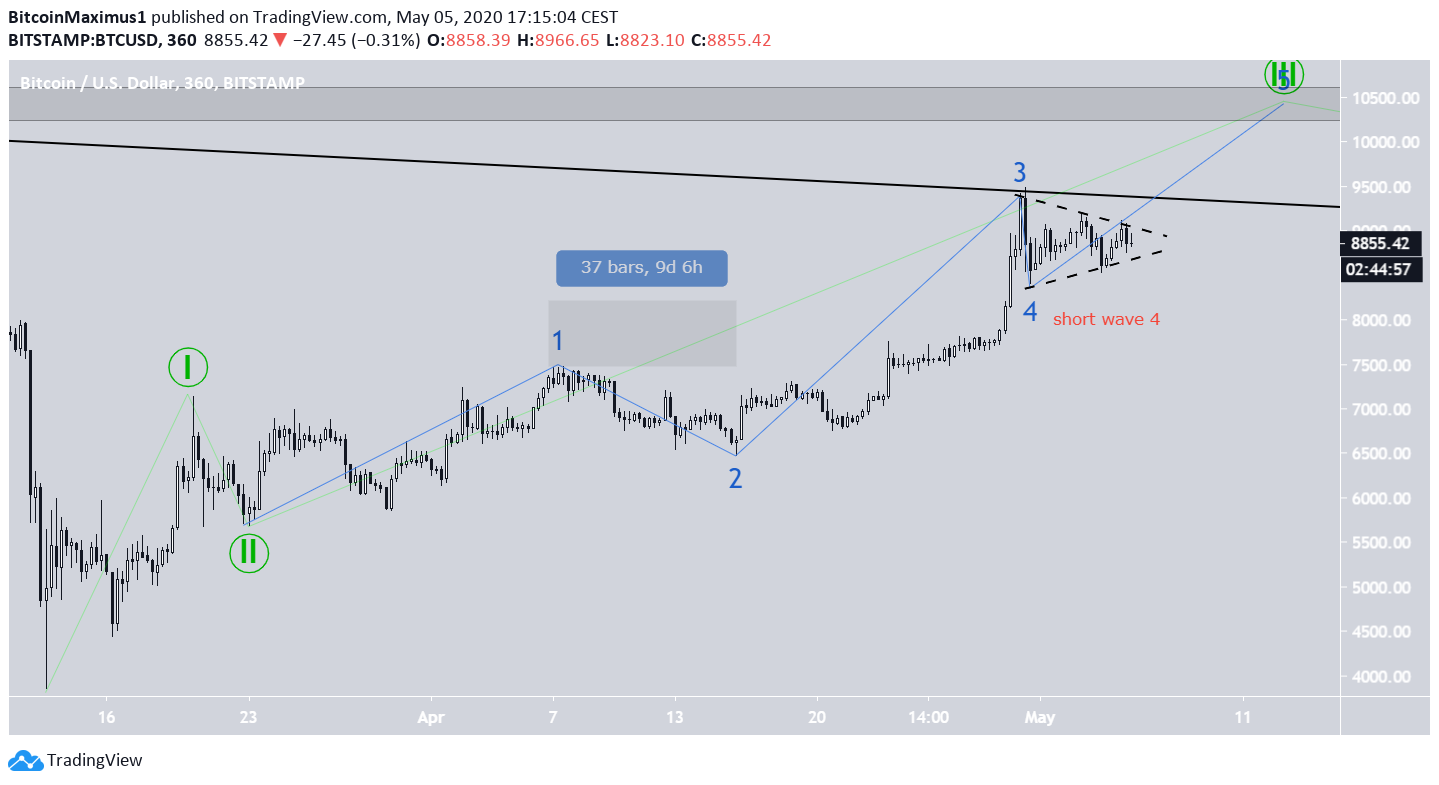
In order for this formation to be correct, the current wave began with a low of $5,995 on March 23 (II). Since the third wave is often extended, we can further divide it into five sub-waves, which are outlined with blue in the chart below.
In the sub-wave formation, the second wave was a gradual decrease, so the fourth one is expected to be sharp, as has been the case. In this context, the price is now in the process of moving upwards and soon break out above the pennant (dashed). Since the first and third waves have been extended, the fifth one is likely to be short, ending at the closest resistance level at $10,500. This possibility fits the the target given in the tweet.
As for the long-term movement, after breaking out above such a long-term resistance line, it would not make sense for the price to fall back below it once more. So, the fourth wave (IV) would only serve to validate this line as support, before the price bounces upwards once more.
Similar to the sub-wave formation, since the third wave is extended, the fifth one would be expected to be short, likely taking the price to the $12,000 resistance area.
To conclude, the Bitcoin price might be trading inside a short-term bullish pennant, a breakout from which would take the price to $10,500. While we think it is more likely that the price is trading inside a descending triangle, a breakout above the current short-term resistance line would invalidate the possibility and likely take the price towards $10,500.


