


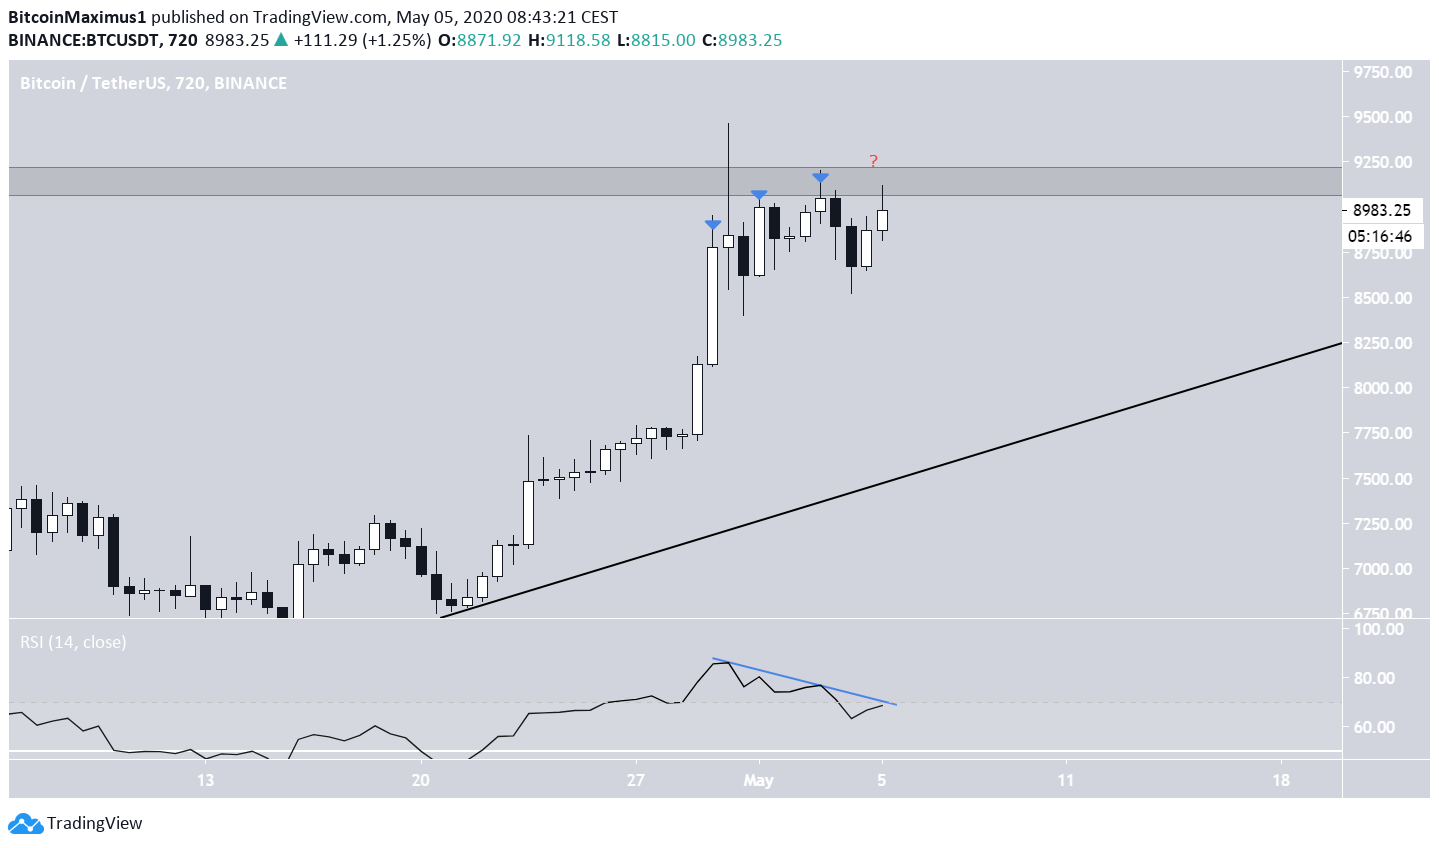
The Bitcoin price is currently trading at the resistance line of either a descending or symmetrical triangle. The next low will help determine the correct pattern.
This resistance, found at $9,150, is both a previous support level turned to resistance and an important Fibonacci level.
Bitcoin Reaches Major Resistance
Inside this resistance, the BTC price has closed three higher-highs and is possibly in the process of creating the fourth.
However, this movement was combined with a very strong bearish divergence in the RSI, which is still ongoing. This suggests that the price will eventually decrease, possibly falling towards the long-term ascending support line.
Triangle Pattern
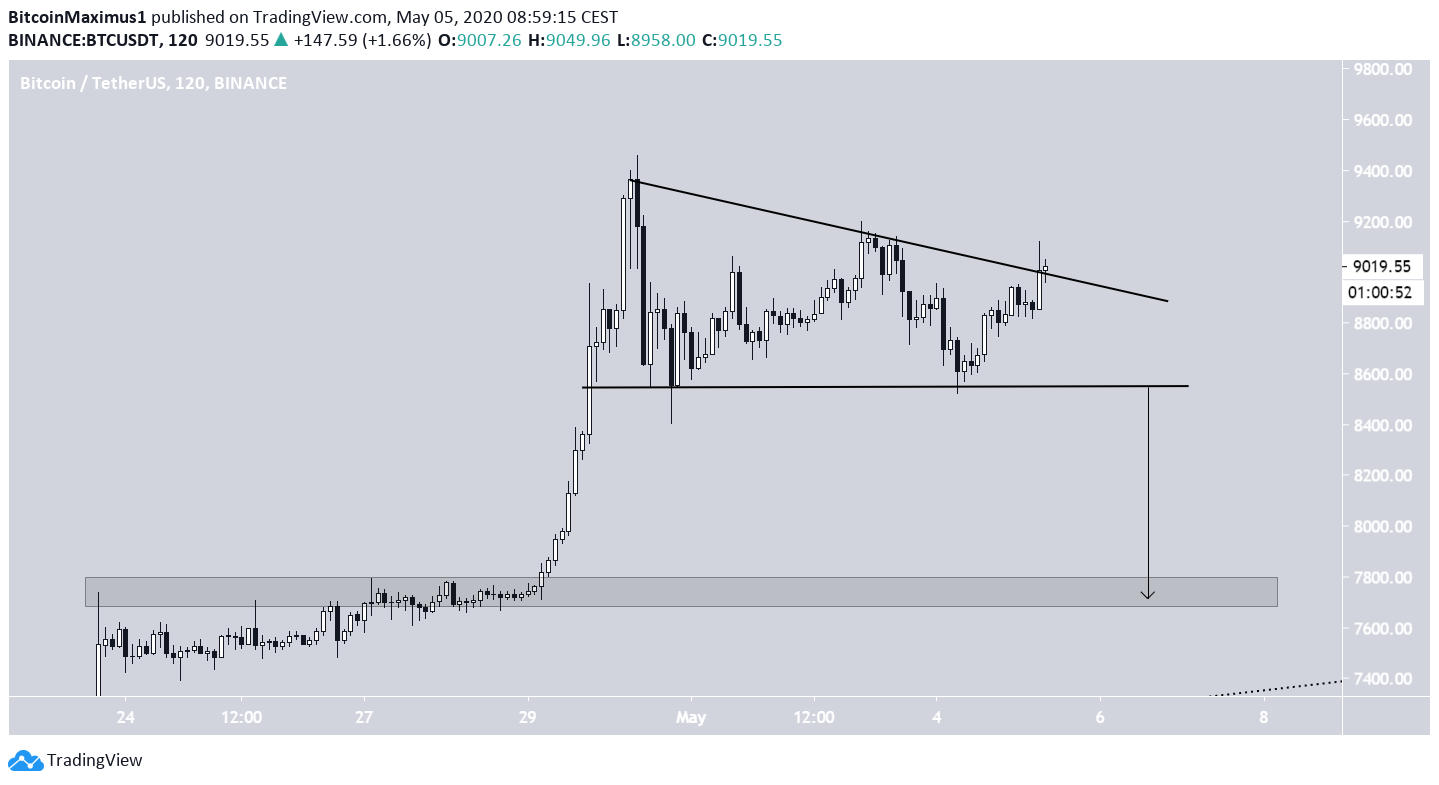
In the short-term, the price is likely trading inside a descending triangle. This is a bearish pattern that indicates the price could soon break down.
At the time of writing, the price was trading just above the resistance line of this pattern. A breakdown would likely take the price to the closest support level, found around $7,700.
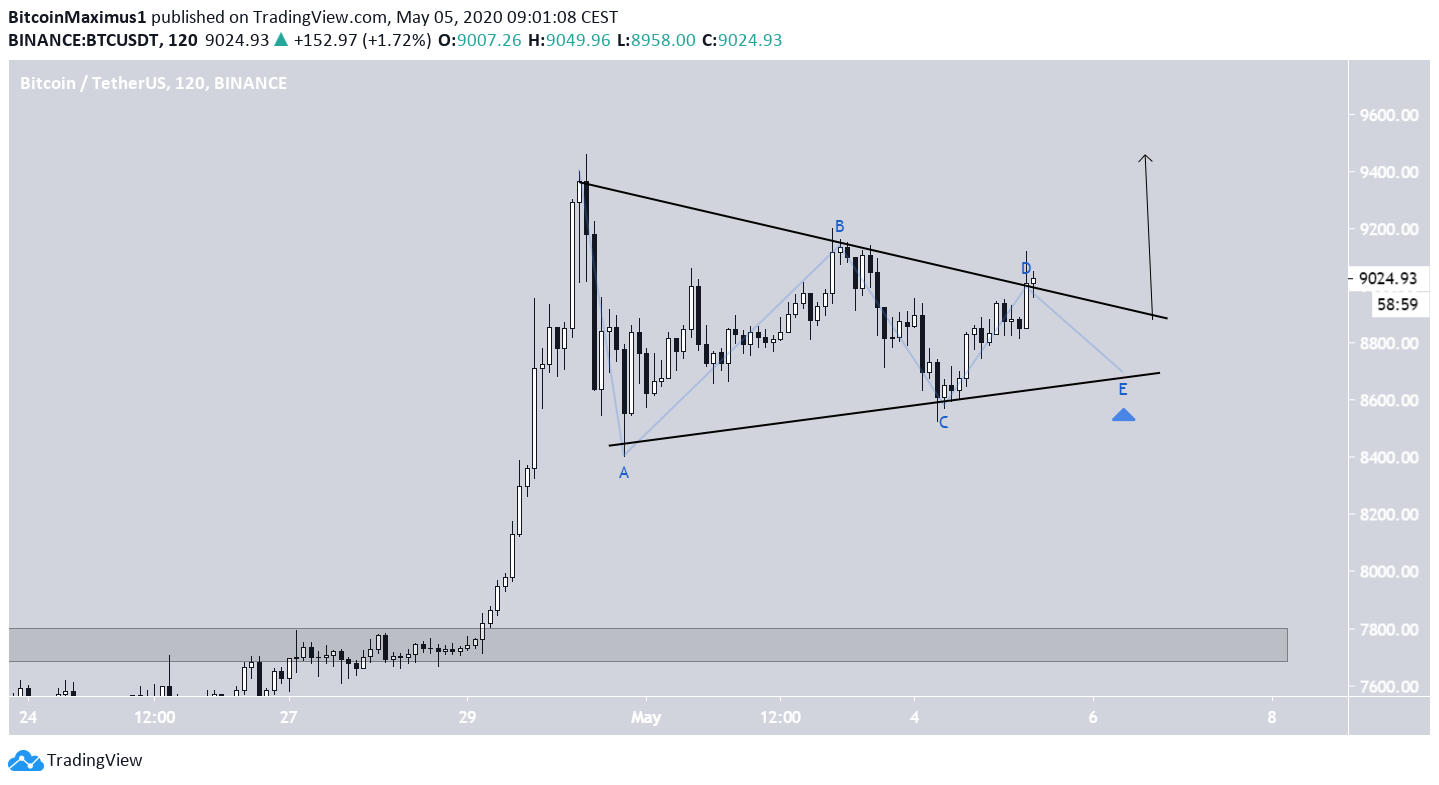
The more bullish scenario has the price trading inside a symmetrical triangle. While this is a neutral pattern, a breakout would be expected, since it is transpiring after a strong upward movement. However, due to the major resistance above the current price, this breakout could end in a double top at $9,400.
If the price gets rejected by the resistance area, it is likely to move downward. Whether it makes a low close to the (c) bottom in the image below, it would mean that the support line is horizontal, and the price is trading inside a descending triangle. If however, it makes a higher-low, as outlined by (e) in the chart, it would mean that the price is trading inside a symmetrical triangle and a breakout likely awaits.
To conclude, the Bitcoin price is trading inside either a descending or symmetrical triangle. The next low reached by the price will go a long way in determining which is the correct pattern. At the time of writing, the descending triangle theory is slightly more likely.
For those interested in BeInCrypto’s previous Bitcoin analysis, click here.


