


The ORDI price has been one of the best performers in Q4 of 2023, increasing by 2,200% since October 16.
ORDI reached a new all-time high of $82.80 today but fell slightly afterward. How will it fare until the end of the year?
ORDI Reaches New All-Time High
The ORDI price has increased since September 11. It created a higher low on October 16, greatly accelerating its rate of increase. The upward movement has been parabolic, without any significant price decreases.
After consolidation starting on December 6, ORDI broke out again yesterday and reached a new all-time high of $82.80 today. Since the start of the upward movement, the ORDI price has increased by 2,200%.
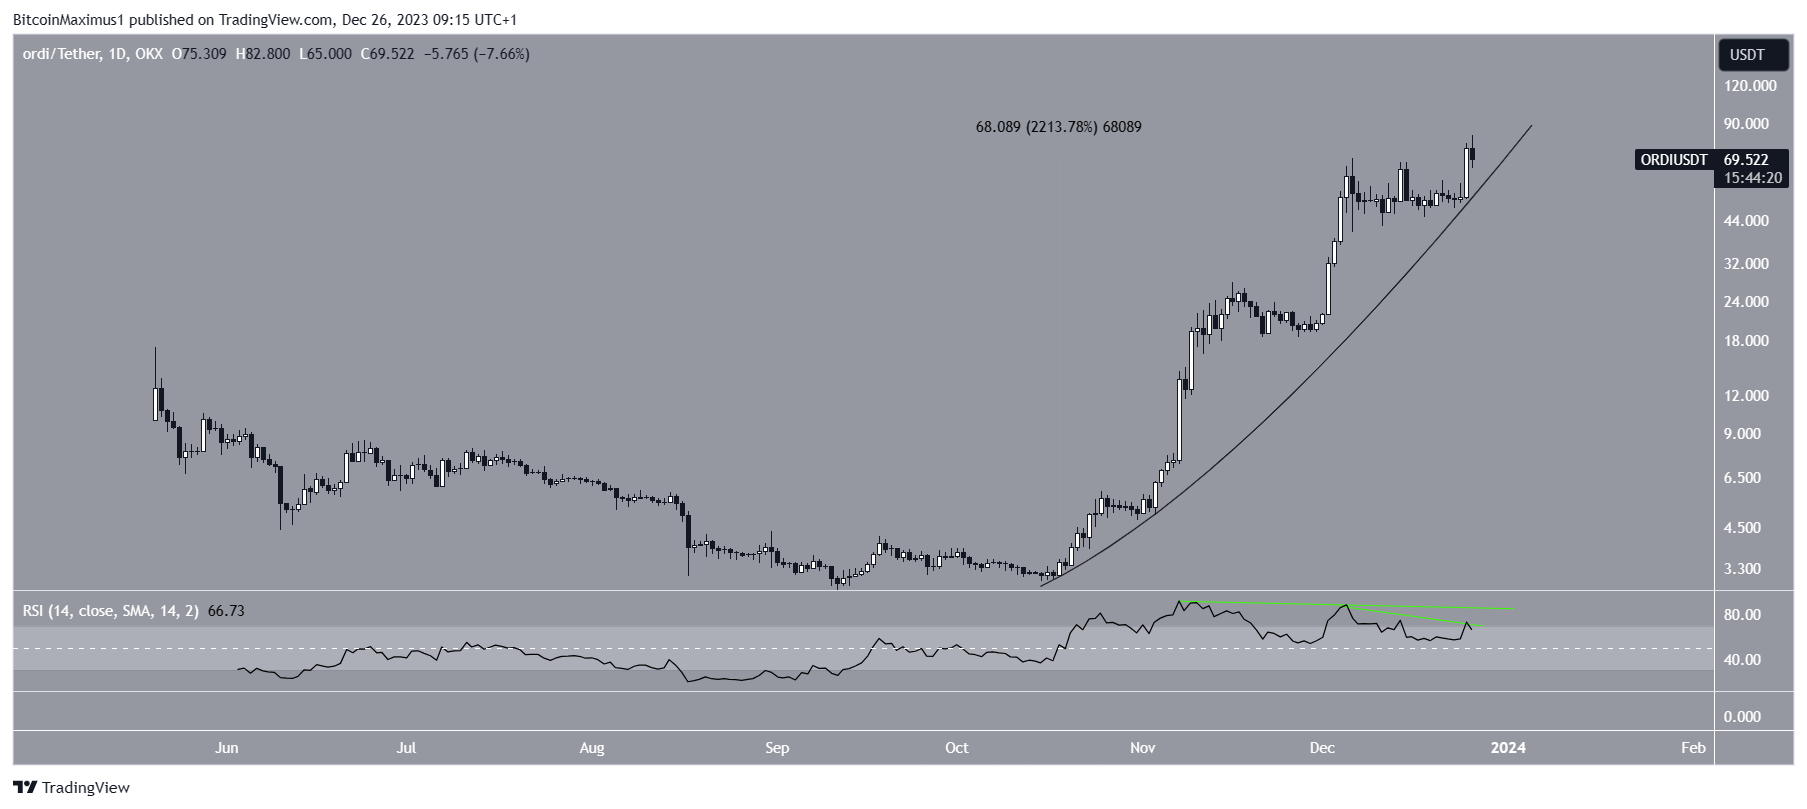
Market traders use the RSI as a momentum indicator to identify overbought or oversold conditions and to decide whether to accumulate or sell an asset.
Readings above 50 and an upward trend indicate that bulls still have an advantage, whereas readings below 50 suggest the opposite.
Despite the rapid price increase, the RSI shows signs of weakness. The indicator generated a bearish divergence in December, an occurrence when a momentum decrease accompanies a price increase.
Read More: Everything You need to Know About Ordinals
ORDI Price Prediction: $100 Within Reach?
Cryptocurrency analysts believe the upward movement for ORDI is not done yet.
Tryrex noted a breakout from a symmetrical triangle and suggested that the price has begun another upward movement.
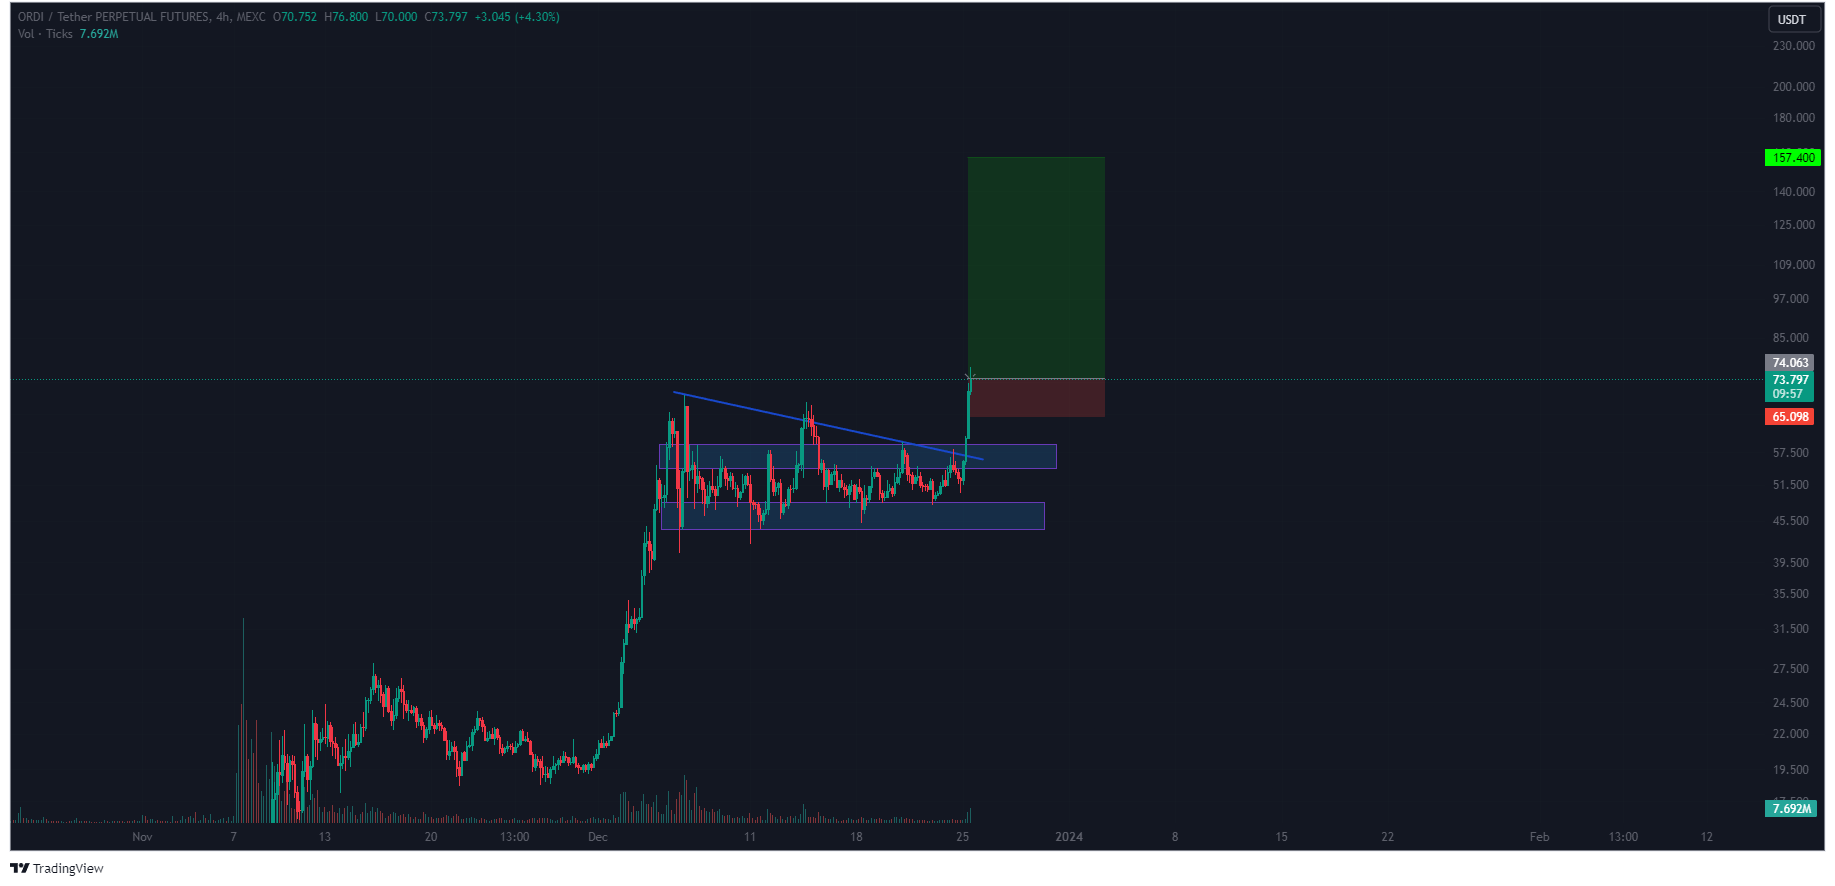
Teo has a similar belief, though he uses horizontal ranges to come to his conclusion.
Technical analysts employ the Elliott Wave theory to identify recurring long-term price patterns and investor psychology, which helps them determine the direction of a trend.
The most likely count indicates that the ORDI price is in the fifth and final wave of an upward movement that started in October. In it, wave three has extended significantly. The sub-wave count is in black.
So far, wave five has had 1.61 times the length of wave one. This is a potential area for a top. If ORDI exceeds this level, it can increase by 58% to the next resistance at $113.
As long as the ORDI price trades above its parabolic ascending support trend line, the trend remains bullish.
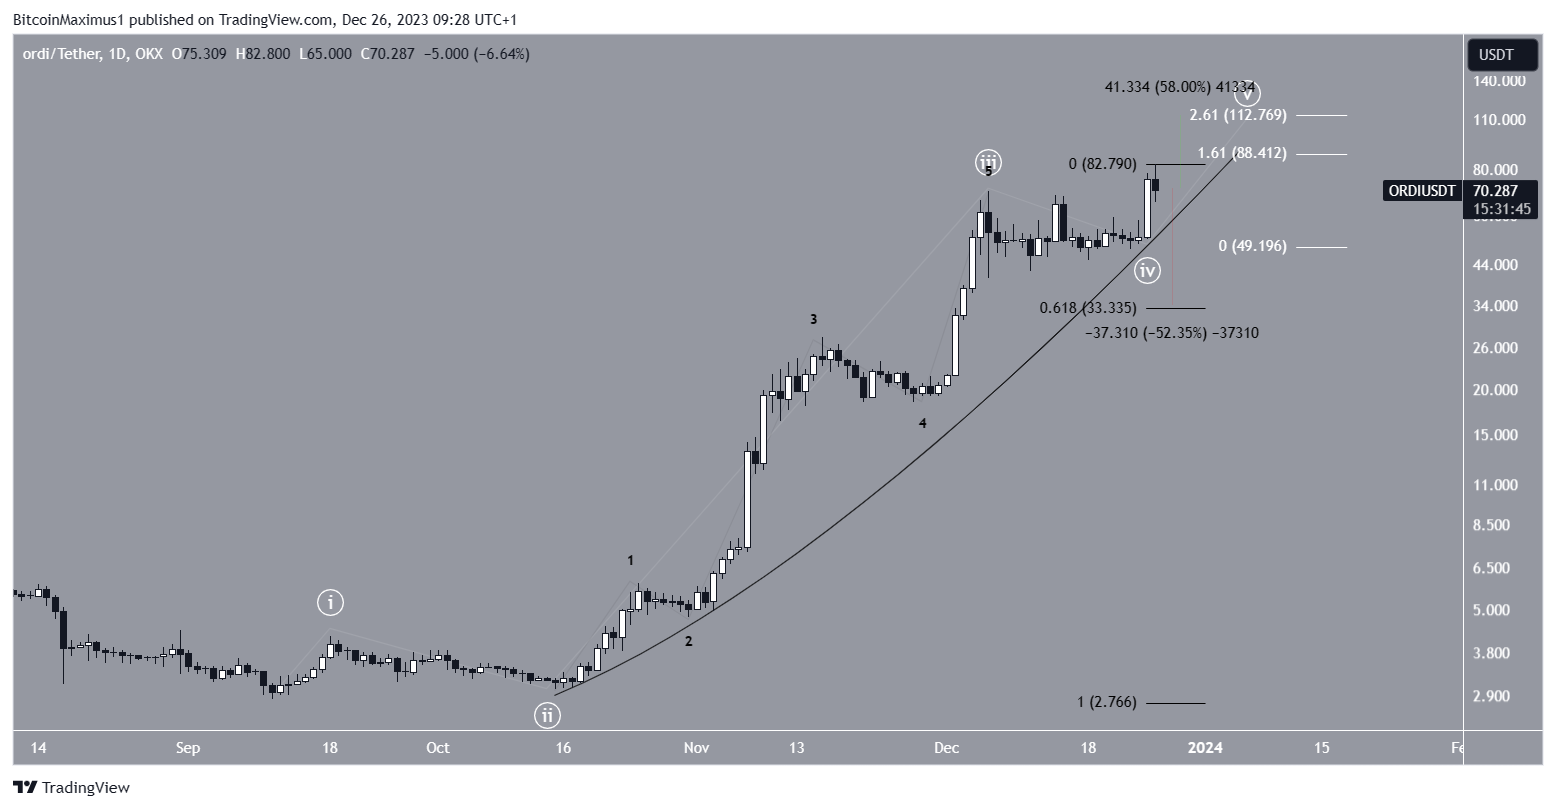
However, a breakdown from the parabola can trigger a 50% drop to the 0.618 Fib retracement support level at $33.
For BeInCrypto‘s latest crypto market analysis, click here.


